2
Acknowledgements
Naseef Huda, who was an Economist at the EPI, contributed to the literature review, statistical analysis and support on the design of fieldwork instruments. Economic modelling, statistical analysis and report editing was led by Peter Sellen, the EPI’s Chief Economist.
Fieldwork for the study was designed, conducted and its results reported by Sarah Gibson and Lizzie Oliver of CooperGibson Research.
The research team are grateful to the Lead Association for Catering in Education (LACA) for funding the study. They are indebted to the following members of the project’s advisory board for their advice on the research’s methodology and comments on the report:
Gillian Allcroft National Governance Association
Beverley Baker Lead Association for Catering in Education
Andy Kemp Bidfood
Ruth Lowe PTAUK
Dr Michael Nelson Public Health Nutrition Research Ltd
Jo Nicholas Children’s Food Trust
Dr Alexandra Turner Children’s Society
Lydia Vye National Association of Head Teachers
They are also grateful to the Department for Education for permission to use the National Pupil Database, and to Paul Bloomfield at the Office for National Statistics for his advice on using the Living Costs and Food survey.
Most importantly, the team would like to thank every school staff member, caterer, pupil and parent who participated in the fieldwork for their time and invaluable insights.
About the Education Policy Institute
The Education Policy Institute is an independent, impartial, and evidence-based research institute that promotes high quality education outcomes, regardless of social background. We achieve this through data-led analysis, innovative research and high-profile events.
Education can have a transformative effect on the life chances of young people, enabling them to fulfil their potential, have successful careers, and grasp opportunities. As well as having a positive impact on the individual, good quality education and child wellbeing also promotes economic productivity and a cohesive society.
Through our research, we provide insight, commentary, and a constructive critique of education policy in England – shedding light on what is working and where further progress needs to be made. Our research and analysis spans a young person's journey from the early years through to entry to the labour market.
Our core research areas include:
▪ Benchmarking English Education
▪ School Performance, Admissions, and Capacity
3
▪ Vulnerable Learners and Social Mobility
▪ Accountability, Assessment, and Inspection
▪ Curriculum and Qualifications
▪ Teacher Supply and Quality
▪ Education Funding
▪ Higher Education, Further Education, and Skills
▪ Our experienced and dedicated team works closely with academics, think tanks, and other research foundations and charities to shape the policy agenda.
This publication includes analysis of the National Pupil Database (NPD): 978-1-909274-46-4
https://www.gov.uk/government/collections/national-pupil-database
The Department for Education is responsible for the collation and management of the NPD and is the Data Controller of NPD data. Any inferences or conclusions derived from the NPD in this publication are the responsibility of the Education Policy Institute and not the Department for Education.
All maps in this publication contain National Statistics data © Crown copyright and database right 2016. Contains OS data © Crown copyright and database right 2016.
ISBN: 978-1-909274-51-8
4
Contents
Executive summary ... 6
Introduction and methodology ... 15
Part 1: Previous research evidence ... 18
1.1. Key policy reviews and recent developments in school food policy ... 18
1.2. Evidence on take-up... 21
1.3. Improving the quality of food eaten by children ... 25
1.4. Education, health and social impacts... 27
1.5. Helping families with the cost of living ... 38
1.6. Improving work incentives ... 39
1.7. Estimating the costs of school meal provision ... 39
1.8. Conclusions ... 41
Part 2: The implementation and perceived impacts of UIFSM ... 44
2.1. Implementing UIFSM ... 45
2.2. The nature of school meal provision ... 62
2.3. Take-up of school meals ... 75
2.4. Resourcing UIFSM ... 92
2.5. Educational outcomes... 104
2.6. Social and behavioural outcomes ... 108
2.7. Health outcomes ... 110
2.8. Household savings ... 118
Part 3: The costs and cost-effectiveness of UIFSM ... 123
3.1. Introduction ... 123
3.2. Summary of methodology ... 123
3.3. Modelling assumptions ... 125
3.4. Central results ... 133
3.5. Sensitivity analysis ... 138
3.6. Conclusion ... 139
Conclusion ... 142
Annex A: Case studies of school meal delivery ... 144
Case Study 1 ... 144
Case Study 2 ... 145
Case Study 3 ... 147
5
Case Study 5 ... 150
Case Study 6 ... 151
Case Study 7 ... 153
Case Study 8 ... 154
Case Study 9 ... 155
Case Study 10 ... 157
Annex B: Fieldwork methodology ... 159
Annex C: Statistical analysis methodology ... 171
6
Executive summary
In September 2014, the Universal Infant Free School Meals (UIFSM) policy was introduced,
stipulating that all children in England’s state funded schools in reception, year 1 and year 2 should be provided with a free school lunch. The aims of this study are to evaluate UIFSM’s potential educational, social and health effects; assess how the national policy has been implemented in schools; obtain perceptions of its outcomes; and estimate the economic costs of the policy. This report is informed by a literature review and statistical analysis of administrative and survey data, carried out by the EPI. Fieldwork was also conducted, by CooperGibson Research, including case study visits to schools, stakeholder interviews, and surveys of school leaders, teachers, caterers, parents and carers. The total costs of delivering UIFSM were estimated using an economic modelling approach, taking into account the financial savings generated for the families of reception and Key Stage 1 pupils.
How UIFSM has been implemented
Research to date suggests that it can be difficult to separate the impact of interventions that change the uptake of school meals from wider changes in school contexts and approaches to food
standards, physical activity, parental education, and school curricula. Qualitative research conducted for this report finds that:
▪ 53 per cent of senior and middle leaders surveyed reported that communications with school caterers had increased as a direct result of UIFSM, with engagement used to collect feedback for menu development and to deal with delivery issues.
▪ 18 per cent reported changing contractual agreements with caterers as a result of UIFSM.
▪ 47 per cent of school leaders also stated that that they had changed meal time arrangements as a result of UIFSM.
▪ For most schools visited, changes made included seating arrangements, timetables, staggering service, catering provision and ordering systems. ‘Family service’ was perceived by school leaders to be a more positive approach to mealtime, providing a calm dining environment. The social benefits of this approach were highlighted by school staff during the case study visits.
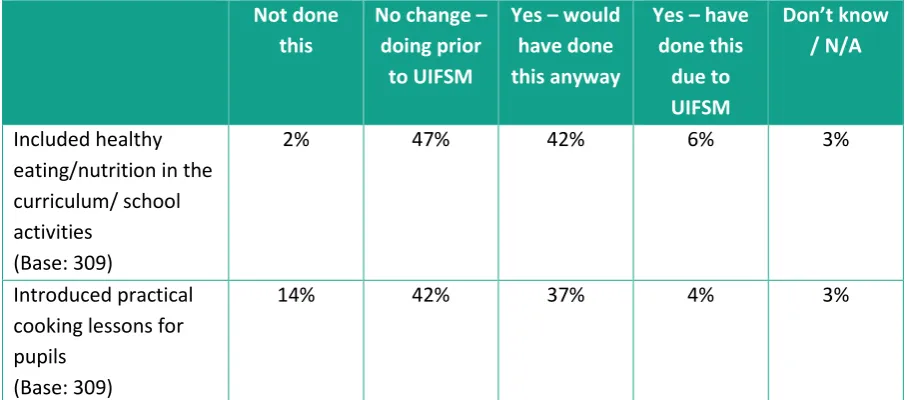
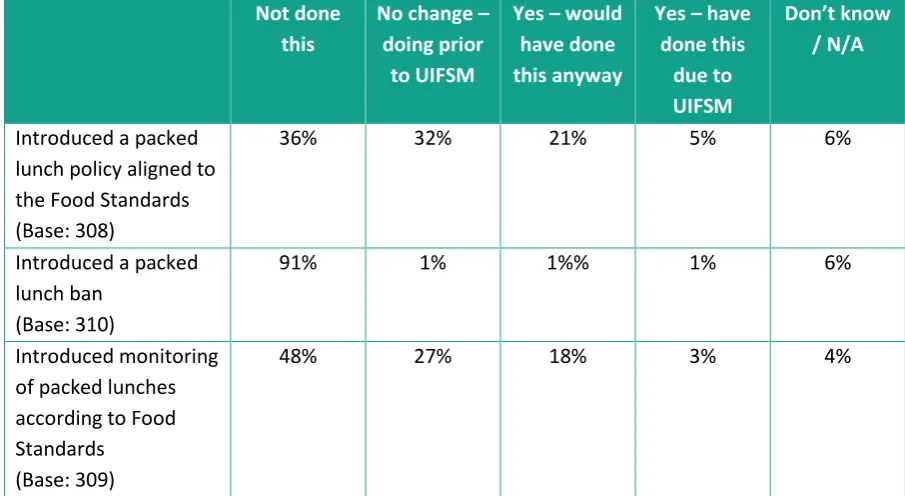
▪ 5 per cent of school leaders reported that their school had introduced a packed lunch policy aligned to the School Food Standards as a result of UIFSM, while 21 per cent said that their school had done so but would have with or without UIFSM, and 32 per cent said this was already in place.
▪ 39 per cent of school leaders said that they had started to promote lunches but would have done so regardless of UIFSM, while 29 per cent reported that they had promoted school meals due to UIFSM and 21 per cent said that their school was already promoting school lunches.
7
▪ Caterers responding to the online survey said that a range of approaches to learner engagement were implemented in schools due to UIFSM, most commonly, encouraging children to try new foods (93 per cent of 44) and ensuring children leave the serving counter with a balanced meal (89 per cent of 44).
▪ Almost all catering staff surveyed felt that the quality of the food produced for schools had either stayed the same or had improved due to UIFSM – 41 per cent of 49 catering staff surveyed believed the nutritional balance of meals had improved as a direct result of UIFSM, while 57 per cent thought it had stayed the same.
▪ All caterers surveyed said that hot meals were offered at their school (sometimes alongside cold options), and 44 per cent of 45 said that they were served more often due to UIFSM.
▪ 80 per cent of parents surveyed said that they were either very satisfied or satisfied with the school lunch service overall. Levels of satisfaction were generally high across a range of indicators, including dining facilities, quality of the food and information provided by schools about lunches.
▪ Parent satisfaction was lower with respect to the use of local suppliers (46 per cent), although levels of awareness about this were low.
▪ 45 per cent of parents surveyed agreed that their child enjoyed school lunches all of the time and 49 per cent agreed that their child enjoyed their school lunch some of the time, although some expressed concerns about the frequency of cakes or biscuits being available, a lack of variety in menu choices, or small portion sizes.
Although school leaders did not tend to think that specific policies had been introduced directly as a result of UIFSM, several suggested during the case study visits that the policy had encouraged their schools to raise awareness of healthy eating.
▪ 41 per cent of school leaders reported that the general profile of healthy eating across the school had improved as a direct result of the introduction of UIFSM.
▪ 12 per cent of said that they introduced policies to engage with parents specifically about healthy eating and school lunch provision as a result of the policy.
▪ Of 57 teachers surveyed, 19 and 21 per cent said that the issue of healthy food choices was discussed in class on a monthly and weekly basis respectively before UIFSM was introduced. This increased to 25 and 38 per cent after UIFSM was introduced. Teachers involved in case study visits felt that UIFSM had helped to raise awareness and provide a practical application of the topics they were covering in the classroom.
Take-up of school meals
Pilots of extending free school meals in England and Scotland have led to significant increases in take-up amongst primary-aged children. Increases in take-up among those who were previously eligible – and also for those who were entitled but not eligible (i.e. not registered) – suggests that stigma can affect take-up, or that associated changes in meal provision can have wider effects.
In schools visited for this research, UIFSM was perceived by all types of school staff to have led to an increase in take-up of school meals, particularly among Reception and Key Stage 1 pupils.
8
▪ Estimates based on the Living Costs and Food survey suggest that the proportion of infants, whose households were interviewed across the full financial year, taking a school meal over the previous week increased from 35 per cent in 2013-14 to 64 per cent in 2015-16.
Accounting for the number of meals taken in each case, which also increased, and the fact that some of these interviews will have taken place during holidays, this is equivalent to an increase in take up on a given school day from 38 per cent to 80 per cent.
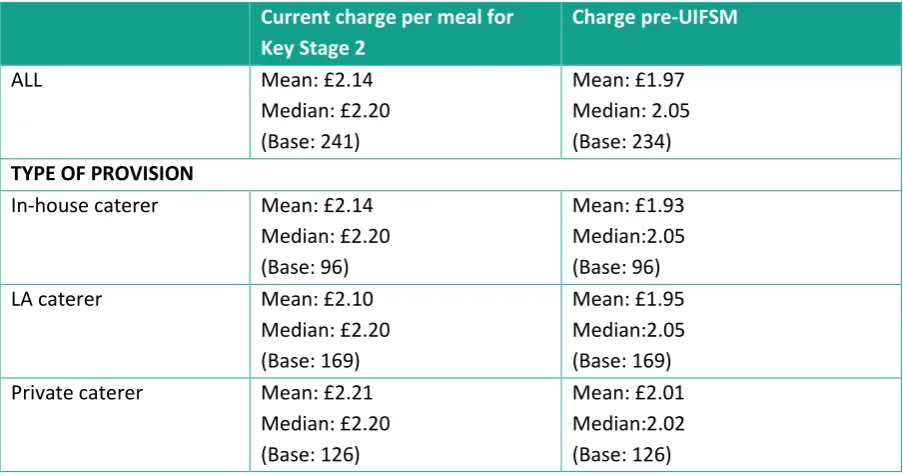
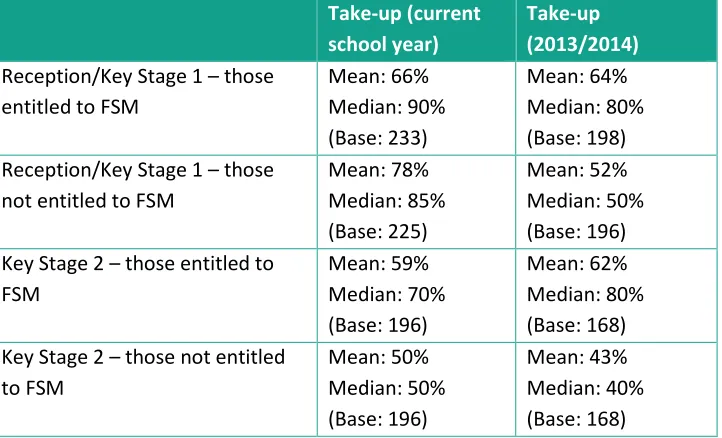
▪ The school leader survey suggested a modest increase in take-up in Key Stage 2 among those not entitled to FSM following the introduction of UIFSM, with a small decrease reported for those entitled to FSM. Schools participating in the visits sometimes reported small increases in Key Stage 2 take-up overall since the introduction of UIFSM, but there is no evidence of a substantial change in take-up among Key Stage 2 pupils in the Living Costs and Food survey.
▪ It is estimated that shortly before UIFSM was introduced, 80 per cent of recipients of free meals were from households in the bottom quartile of equivalised disposable income, and this decreased to 33 per cent afterwards. However, as today’s infants are disproportionately from households with below-average incomes, more than half (an estimated 62 per cent) of infants recorded in the survey as receiving FSMs in the last week were from households with below-median equivalised incomes following the policy’s implementation.
▪ Across the full calendar year, the estimated proportion of infants from the lowest quartile of household income receiving a free meal in the previous week increased from an estimated 25 per cent shortly before UIFSM’s introduction (equivalent to 34 per cent in a given school week) to 62 per cent (equivalent to 84 per cent in a given school week) afterwards.
Consistent with this evidence, reported take-up in the January School Census – which is used to determine school funding – has been high compared to historic levels in all three years since the policy was introduced, reaching 86.1 per cent for infants overall in 2017. There has been little change in take-up between 2015 and 2017, and take-up rates are still slightly higher for those claiming FSM than for others. The National Pupil Database has been used to assess variations in take-up rates recorded in January 2017:
▪ There are only small differences in take-up between pupils in different year groups, between boys and girls, and between pupils living in areas with different levels of deprivation.
▪ In contrast, there are clearer differences between pupils of different ethnic backgrounds. Chinese pupils had the highest rate of take-up among major ethnic groups, at 93.4 per cent, compared with 85.5 per cent of white pupils, who have the lowest take-up rates.
▪ 98 per cent of schools reported take up of over 60 per cent across all infants, with 75 per cent reporting over 80 per cent and 44 per cent reporting over 90 per cent. The distribution is particularly skewed for FSM-claiming pupils, with 37 per cent of schools reporting 100 per cent take-up for this group compared to 6 per cent for non-FSM-registered pupils.
▪ All local authorities have take-up rates of over 72 per cent, but – consistent with patterns seen prior to UIFSM – authorities in the north of England and in London tend to have higher-than-average take-up.
9
rates for all pupils (88.0 per cent) and schools with over 500 pupils have the lowest (85.7 per cent).
▪ Among mainstream schools, free schools had an average take up of 92.3 per cent, compared with the lowest rate seen of 82.9 per cent in sponsored academies, although this may be a result of free schools’ concentration in London, and there are a relatively small number of these schools.
▪ Schools with a latest Ofsted inspection outcome of Outstanding had the highest take-up rates, at 88.3 per cent - 6.0 percentage points greater than that of schools judged Inadequate.
▪ There is little variation between schools with different proportions claiming FSMs for Pupil Premium purposes.
Outcomes for pupils and their families
Childhood obesity is a growing problem amongst children and young people, and it has implications for the likelihood of being obese in adolescence and adulthood. Evidence suggests schools have an important role to play not only in educating young people about the benefits of healthy eating and keeping active, but also by providing them and their parents with opportunities to eat healthily and take part in exercise. There is also strong evidence that increasing the take up of school meals improves the nutritional balance of food consumed during the school day, with only 1.6 per cent of primary children’s packed lunches meeting the nutritional standards set for their classmates eating school lunches (Evans, 2016). Having school meals may also improve a child’s willingness to try new foods both in and out of school. If this is encouraged early enough, this may lead to better nutrition later in life. However, school meal interventions by themselves have not been found to have substantial benefits for levels of obesity in the short term.
Evidence on the precise links between nutrition and cognitive outcomes is generally not conclusive, however the universal FSM pilots in England, taking place in Newham and Durham between 2009 and 2012, had a statistically significant association with Key Stage 1 and especially Key Stage 2 attainment scores: pupils in both of the universal FSM pilot areas made around two months’ more progress than those in the control areas, with greater impacts for disadvantaged and low-attaining pupils. The mechanisms for this effect were not clear, and there was no clear evidence that extending FSMs improves school attendance (Kitchen et al., 2012). In the fieldwork conducted for this study:
▪ 29 per cent of school leaders identified an improvement in pupils’ readiness for learning as a result of UIFSM, but teachers participating in the online survey were more likely to identify this (40 per cent of 57).
▪ Some teachers thought attainment/progress in class (39 per cent); ability to complete desk-based activities (36 per cent); and ability to concentrate, not getting distracted (36 per cent) had increased as a result of UIFSM, with none reporting a deterioration.
▪ 60 per cent of school leaders felt that there had been no change in overall pupil behaviour since the introduction of UIFSM, whilst 19 per cent felt that behaviour had improved, 2 per cent felt it had deteriorated and 19 per cent did not know.
10
with a wider focus on healthy lifestyles, or as part of a ‘family’ ethos) had a large contributing factor to its perceived effect on outcomes.
▪ The majority of parents responding to the online survey felt that educational outcomes had stayed the same since the introduction of UIFSM, but 22 per cent of parents responding to the survey noted that achievement at school, attention span and a child’s ability to
concentrate had all improved in the last three years. 31 per cent attributed such changes ‘a great deal’ to UIFSM and 38 per cent attributed the changes ‘a little’ to UIFSM.
▪ 35 per cent of parents responding to the online survey felt that their child’s dining etiquette had improved since the introduction of UIFSM, and 26 per cent felt that behaviour at mealtimes was better. 31 per cent of parents attributed such changes ‘a great deal’ to free school meals and 38 per cent attributed the changes ‘a little’ to free school meals.
▪ 30 per cent of school leaders felt that pupils’ overall health had improved as a result of UIFSM being implemented, while 54 per cent of 57 teachers surveyed felt that the policy had had a positive impact on the health of children eligible for FSM. This message was reinforced during the visits to schools, with several members of school and catering staff highlighting that for many children the lunch was the only hot meal of the day.
▪ 56 per cent of parents surveyed felt their child was more likely to try new foods following the introduction of UIFSM. 38 per cent said that their child was more likely to drink water with their meals (with 19 per cent saying that their child was less likely to drink soft drinks with meals), and 33 per cent said that their child was more likely to eat pieces of fruit or vegetables. Most parents attributed such changes ‘a great deal’ or ‘a little’ to UIFSM.
The introduction of UIFSM has meant that some parents no longer need to provide a packed lunch for their children. Parents who no longer had to make packed lunches reported a median weekly saving of £10. The cost saving experienced as a result of free school meals provision was highlighted by some parents as having been especially beneficial to their households, not only in removing ‘stigma’ in claiming free meals, but also assisting with household budgets. While responses may be prone to error, the median reported weekly time saving from not having to make school meals, where relevant, was 50 minutes. This was reported by parents to have allowed more time spent with families in the evening, completing homework or playing with children.
Previous survey evidence has suggested that some parents see the prospect of the loss of FSM as a disincentive to move into work, although whether UIFSM has affected work decisions was not tested in this study and may be affected by the introduction of Universal Credit.
School leaders reported changes in registration for free school meals for the purposes of Pupil Premium funding due to the introduction of UIFSM:
▪ 31 per cent of school leaders surveyed reported that take-up of FSM for pupil premium purposes had decreased, 15 per cent reported that it had increased and 38 per cent reported that it had stayed the same.
11
▪ 30 per cent of 308 school leaders reported that they had introduced a strategy to
maintain/improve Pupil Premium take-up due to UIFSM, while 39 per cent would have done this anyway, 18 per cent were already doing it and 9 per cent have not.
Whilst the potential impact on total Pupil Premium spending is uncertain, and may have been mitigated by changes in the national funding rates applied by the Department for Education, this is likely to have redistributed funding – and possibly the targeting of interventions – away from infants and towards older pupils.
Delivery costs for schools
The changes in provision and increase in take-up of school meals have generated significant costs for schools and caterers, both in managing its implementation and in ongoing requirements.
▪ 54 per cent and 47 per cent of school leaders reported investment in new and refurbishment of old catering facilities respectively. For some schools, UIFSM represented an ‘opportunity’ to invest in improving the quality of lunch provision, but there were concerns in places about the adequacy of funding for capital improvements.
▪ Headteachers and school Business Managers highlighted during the case study visits that the ongoing maintenance of kitchen facilities was one of the largest costs to their schools in relation to the delivery of UIFSM.
▪ 35 per cent of school leaders surveyed reported an increase in investment in training staff for school lunch provision.
▪ 57 per cent of school leaders cited an increase in catering/supervisory staff numbers employed, and 51 per cent an increase in existing catering/supervisory staff hours.
▪ 20 per cent of school leaders reported an increase in the number of staff employed in the management and administration of free school meals, and 40 per cent reported an increase in the allocation of existing staff time to this.
▪ Overall, 8 per cent more school leaders reported a deficit for school meal provision when referring to the period after UIFSM had been introduced than when referring to the period beforehand, and there was no difference in the proportion reporting a profit. Of these, around half attributed the change solely to the introduction of UIFSM.
▪ Concerns were raised by some school leaders and by caterers that various resource demands would create sustainability issues in the future for UIFSM provision if the funding rate stayed at £2.30 per meal, due to the rising cost of food prices, ongoing maintenance costs of kitchens and remedial works to facilities.
UIFSM was felt to have had an impact on wider curriculum delivery. In several schools observed during the site visits, the dining room(s) was not a separate, dedicated space but a multi-purpose area required for assemblies and subject delivery including physical education. Where lunch service had increased and/or extended in duration, this therefore had a knock-on effect. Meanwhile:
▪ 35 per cent of school leaders reported an increase in senior leadership team time used for catering provision
▪ 38 per cent reported an increase in support staff time used.
12
more often with pupils, although an equal number of teachers had said that they spent more and less time on catering than before.
Whilst an increase in wider school staff involvement in lunch provision will have represented a burden for some schools, benefits for pupil socialisation and the identification of safeguarding issues were identified in case studies.
Aggregate costs and cost-effectiveness
The total costs of the policy have been estimated for the first 3 years of the policy, and projected forward to 2023-24 (covering a 10-year period), using published data and assumptions informed by the fieldwork reported here:
▪ In a central modelling scenario, the policy generates an increased real cost of producing school meals of £380m in 2017-18, adding up to a Net Present Value (NPV, with a base year of 2014-15) of £2.957bn over 10 years, in 2017-18 prices. Capital costs, other
implementation spending, and ongoing use of school staff time are estimated to amount to an NPV of £562m.
▪ However, making assumptions about the extent to which families perceive the financial and time-saving benefits of free meal provision, the consumer benefits from UIFSM are
estimated at £549m in 2017-18, or £4.407bn in NPV terms over the period, of which the majority are experienced by those who would not have been previously claiming FSMs.
▪ Subtracting these benefits from the economic costs of the policy leaves an estimated net economic benefit (on the narrow definition used here) of £887m across the period. Here, the increased cost to the education system of delivering school meals has been offset by benefits for households, assuming that there are economies of scale in the labour cost of providing meals.
▪ The net public sector cost, however, is an estimated £5.560bn across the period, including Government spending and the remaining burdens for schools, taking into account revenue loss. UIFSM creates a large transfer from taxpayers to households with infants who are not entitled to FSMs.
▪ In an alternative scenario where economies of scale are not realised, food price inflation is higher, and the assumed benefits experienced by households are lower, the net economic costs increase to total of £500m across the period, compared to a baseline without UIFSM.
▪ In a more optimistic scenario for these variables, with greater economies of scale and higher valuations for the benefits received by parents, the net economic benefit on these narrow terms is estimated to be as high as £1.618bn, though public sector costs are still £5.076bn.
The Department for Education has provided revenue funding for schools, at a rate equivalent to £2.30 per meal taken by newly-eligible pupils, amounting to almost £650m in 2016/17, and over the first two years of the policy gave an extra £32.5m to small schools. Around £180m of capital funding has also been provided.
13
school catering deficits. With the revenue funding rate currently fixed at £2.30, schools have benefited from weak wage growth and food input price deflation in the past.
▪ Across the rest of the period and depending on inflation rates, it is forecast that if the revenue funding rate is held at £2.30, by 2023-24 the policy could be creating a net annual cost to schools of £109m in today’s prices. Across the whole period, schools would have faced an NPV net cost of £433m in this scenario.
The Sutton Trust-EEF Toolkit can be used to compare the impacts and costs of educational interventions (on scales from ‘very low’, ‘low’, through ‘moderate’ to ‘high’ and ‘very high’), with interventions that are more expensive to deliver only proving cost-effective if they come with higher educational impacts (Higgins et al., 2014):
▪ If UIFSM were to achieve a similar impact on Key Stage 1 attainment to that observed in the pilot, the ‘effect size’ would place it in the ‘low impact’ category on this scale.
▪ On the other hand, the economic costs estimated here in the central scenario are negative (with Government spending resulting in savings to households). The size of the economic cost would be categorised as ‘very low’ on the scale – in which case the policy would appear to be cost-effective as an educational intervention, if such educational impacts were
achieved.
▪ However, the total public spending impacts are higher than the net economic cost, and would be categorised as a ‘moderate’ cost on the Toolkit scale, so the overall educational cost-effectiveness of the policy is weaker on this measure.
Conclusion
UIFSM led to a rapid increase in school meal take-up across the majority of schools. Schools and caterers have incurred significant costs and have made many revisions to the delivery of food, in order to implement UIFSM. There appears to be scope for schools to learn from others’ experience, as many have found solutions to challenges that others have struggled with. Most parents are satisfied with the quality of school lunch provision. Schools with better Ofsted inspection outcomes have tended to have higher rates of take-up, and, despite initial concerns for the ability of small schools in particular to deliver higher levels of take-up, these have not been reflected in the rates reported by schools.
Parents have cited significant financial benefits as a result of UIFSM and have appreciated the time that has been saved from not having to make packed lunches. Some, though generally less than half, of the school and parent/carer respondents to surveys have perceived positive impacts in the short term on educational, social and health outcomes, but such effects have not been tested for
14
In a central modelling scenario, the estimated economic resource costs of the policy are smaller than the value of financial and time savings for families, making UIFSM a potentially cost-effective
educational intervention on these terms. This is dependent on seeing the impacts observed in the FSM pilots replicated, on achieving economies of scale in production, and on maintaining quality in school food provision. School leaders and caterers should reflect on the lessons from this study, and the examples of alternative delivery approaches from case studies, to make sure this happens.
However, under any scenario the public sector financial costs are substantial, and on these terms the policy’s efficacy would rest on policymakers attaching a high value to improving the living standards of households with infants who were not already eligible for FSM, and on potentially generating health and social benefits.
So far, the funding of schools to deliver UIFSM appears to have been adequate on average, but a small proportion of schools have seen an increase in deficits in school meal provision, and on
15
Introduction and methodology
Background
The School Food Plan, a wide-ranging review of school food provision completed in 2013, recommended that the Coalition Government extend free school meals (FSMs) to all pupils in primary schools (Dimbleby and Vincent, 2013). The report suggested it would lead to positive improvements in health, attainment and social cohesion, while helping families with the cost of living, and came after a pilot of extending eligibility was carried out in a small number of areas between 2009 and 2012. Partially accepting the recommendations, the government announced the policy of Universal Infant Free School Meals (UIFSM) in September 2013.1 Under the Children and
Families Act 2014, all children in state funded schools in reception, year 1 and year 2 were to be provided a free school lunch from September 2014.2
UIFSM was implemented alongside new food standards, which came into force from January 2015.3
Further actions, developed as part of the School Food Plan, were also put in place to support delivery of the policy for infants, to encourage schools to improve the quality of school lunches, and to increase the proportion of pupils taking them more generally. This included the Small Schools Taskforce launched to develop practical advice for small schools, and a targeted support service for schools, local authorities and caterers.4
Evaluation aims
UIFSM was introduced across all state primary schools at the same time, has only been in place for three full years, and came at the same time as a range of other important reforms affecting schools, the measurement of pupil attainment, and school food provision. Given this, establishing statistically the impact on education or health outcomes of UIFSM is not within the scope of this study, though it is hoped that the evidence generated here would be informative for the design of future studies with these aims. The best statistical evidence of such potentialimpacts remains that generated by the FSM pilots (Kitchen et al., 2012). The aims of this research are to:
▪ summarise the existing research evidence on the potential impacts of UIFSM;
▪ evaluate how the national policy has been implemented and how it has affected schools.
▪ obtain perceptions of educational, health and social outcomes; and
▪ estimate the costs of the policy, and the potential cost-effectiveness of UIFSM as an educational intervention.
Whilst representatives of the catering industry have been surveyed and interviewed, the focus of the research has been on assessing the implementation of the policy and its potential impacts for
educational and social outcomes from schools’ and parents’ perspectives, rather than exploring in detail the supply-chain impacts in relation to school meal provision.
1https://www.gov.uk/government/news/free-school-lunch-for-every-child-in-infant-school 2http://www.legislation.gov.uk/ukpga/2014/6/contents/enacted
16
Methodology
The methodology for this study was informed by discussions with the project’s advisory group, whose membership is listed in the acknowledgements.
A review of the research literature was carried out, to provide insights into the potential impacts of UIFSM and the aspects of delivery that would be important in determining these outcomes. This included evidence generated by recent pilots of extending FSM eligibility, and focused on the relationships between school meals, child nutrition, health outcomes and education.
This evidence informed the design of mixed-method fieldwork to evaluate the policy’s implementation, carried out between May and July 2017, including:
▪ 10 case study visits to primary schools, including qualitative discussions with pupils, parents and parent governors, teachers and support staff, catering staff and midday supervisors, external catering managers, school leaders and business managers.
▪ A survey of school-based staff, with responses from 327 different schools, including 286 senior leaders and business managers, 21 middle leaders, 51 catering staff and meal supervisors, 62 teachers and teaching assistants/SENCOs, and 41 administrators and other staff.
▪ A survey of 508 parents.
▪ 17 qualitative interviews with suppliers, catering providers and school leaders.
▪ Cost proformas to collect quantitative information on take-up and costs from schools and caterers, with 22 received (the information from these was not in a format consistent enough to enable inclusion of findings in this report).
To complement the findings of this fieldwork, and validate some of the perceptions reported by its participants, statistical analyses were conducted using publicly available data. These were:
▪ an assessment of variations in school meal take-up across pupils and schools, as reported in school censuses since 2014/15 and included in the National Pupil Database;
▪ an estimation of longer-term trends in school lunch take-up for pupils from households of different levels of income, using the Office for National Statistics’ (ONS) Living Costs and Food survey (LCF); and
▪ an assessment of changes in the proportion of children claiming FSMs for pupil premium purposes, using statistics published by the Department for Education.
17
Organisation of this report
Part 1 outlines the findings of the literature review, Part 2 reports the findings of fieldwork and statistical analyses by aspects of policy implementation and types of perceived outcomes, and Part 3 describes the analysis of costs and cost-effectiveness. The report concludes with a summary of the key messages provided by the research and their potential implications.
18
Part 1: Previous research evidence
1.1. Key policy reviews and recent developments in school food policy
The implementation of Universal Infant Free School Meals (UIFSM) was the culmination of a series of policy developments aimed at promoting healthier schools and lifestyles amongst school children. This stemmed in part from evidence showing poor nutrient and food intake amongst some school-aged children from the National Diet and Nutrition Survey (Ells et al., 2008, citing 2000 survey).
The Scottish Government set up an expert panel to look at free school meals in 2003 (Scottish Executive’s Expert Panel on School Meals, 2003), and this was followed by a review in England in 2005 (School Meals Review Panel, 2005), and soon after in Wales (Department for Education, Lifelong Learning and Skills, 2006) and Northern Ireland (Department of Health, Social Services and Public Safety, 2006). These panels recommended the introduction of standards to ensure the quality of food provided in schools on the basis that it would have the potential to support children’s
nutrition, growth, and development; and informed by anecdotal evidence from teachers and parents on improvements in children’s concentration, behaviour, learning, and academic performance when healthier school food is introduced (School Meals Review Panel, 2005).
These reviews have resulted in the introduction of a variety of food-based and nutrient-based standards for school food and other food and drink served in schools in the UK. All maintained schools in England, as well as most academies and free schools, are legally required to meet the regulations.5
Concern about children’s diets has continued, as has belief in the significant role of schools in promoting healthy lifestyles and the importance of establishing good food habits early on.
Policymakers have also identified further benefits of free school meals in terms of reducing stigma, building social cohesion, helping families with the cost of living, and improving educational
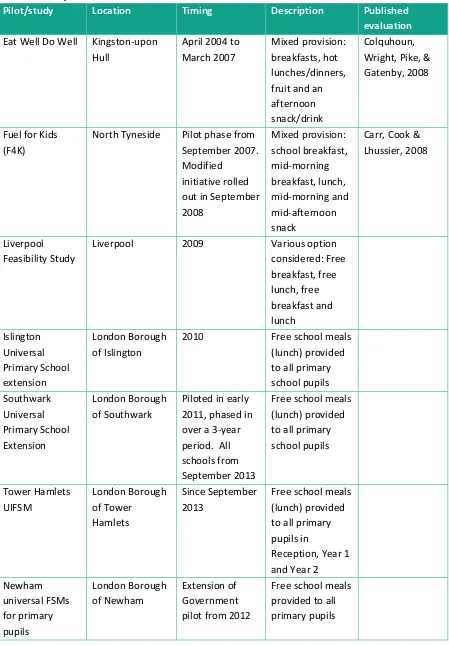
outcomes. This led to Government-led pilot initiatives in Scotland (Her Majesty's Inspectorate of Education, 2008) and England (Kitchen et al., 2012, Rahim et al., 2012) to introduce or extend free school meals to various groups of school pupils (see Section 1.2). Several other, locally-led initiatives identified have either introduced free school meal provision for all primary pupils or a subset (sometimes following a pilot) or investigated the feasibility of doing so – these are summarised in Table 1.1.
19 Table 1.1: Locally-led FSM extension initiatives
Pilot/study Location Timing Description Published evaluation Eat Well Do Well Kingston-upon
Hull
April 2004 to March 2007
Mixed provision: breakfasts, hot lunches/dinners, fruit and an afternoon snack/drink
Colquhoun, Wright, Pike, & Gatenby, 2008
Fuel for Kids (F4K)
North Tyneside Pilot phase from September 2007. Modified
initiative rolled out in September 2008 Mixed provision: school breakfast, mid-morning breakfast, lunch, mid-morning and mid-afternoon snack
Carr, Cook & Lhussier, 2008
Liverpool Feasibility Study
Liverpool 2009 Various option
considered: Free breakfast, free lunch, free breakfast and lunch Islington Universal Primary School extension London Borough of Islington
2010 Free school meals
(lunch) provided to all primary school pupils Southwark Universal Primary School Extension London Borough of Southwark
Piloted in early 2011, phased in over a 3-year period. All schools from September 2013
Free school meals (lunch) provided to all primary school pupils Tower Hamlets UIFSM London Borough of Tower Hamlets Since September 2013
Free school meals (lunch) provided to all primary pupils in
Reception, Year 1 and Year 2 Newham universal FSMs for primary pupils London Borough of Newham Extension of Government pilot from 2012
20
Another review of school food, The School Food Plan (Dimbleby and Vincent, 2013), was commissioned by the Coalition Government.6 That suggested that, whilst there had been
improvements in the nutritional quality of school food in England, and positive developments in the integration of food and health issues in schools’ curricula, this was not reflected in all schools. It also found that take-up remained too low to enable the economies of scale in provision that can reduce costs for schools, or to ensure enough pupils were receiving the nutritional benefits of a school lunch.
One recommendation of the School Food Plan was to simplify school food standards to make them easier to implement and enforce. The nutrient-based standards, introduced in between 2006 and 2009, were found to be complicated and expensive to enforce as well as placing restrictions on local flexibility and creativity. The standards were reformed, moving to a focus on final food standards (School Food Plan, 2015). Research conducted by the Children’s Food Trust to test the revised food based standards with caterers found that 90 per cent of school cooks and 80 per cent of caterers thought the new standards were easier to understand and 80 per cent of cooks and caterers thought they would provide more flexibility (Mucavele, Nicholas, & Sharp, 2013). The Government has committed to update the standards in the light of new dietary recommendations on sugar and nutrition (HM Government, 2016).
Another recommendation of the School Food Plan was to extend FSMs to all primary school children, starting with the most deprived areas. The Government agreed to extend it in all state-funded schools, but only for infants. Following its announcement in September 2013, UIFSM was introduced in England in September 2014 via the Children and Families Act 2014, which stipulated that all children in state funded schools in reception, year 1 and year 2 should be provided a free school lunch, with revenue and capital funding provided to schools (see Part 3 for more details of UIFSM’s funding).7 The Children’s Food Trust (CFT) and the Lead Association for Catering in Education (LACA)
were commissioned by the Department for Education (DfE) to provide a support service for schools, local authorities and caterers preparing to provide UIFSM.8 Several further actions announced along
with the School Food Plan were also intended to support delivery of the policy and raise take-up of school meals more generally. This included a Small Schools Taskforce launched to develop practical advice for small schools.9 Scotland introduced a similar scheme in January 2015, using Barnett
formula consequentials of the English funding allocation.10
The remainder of this literature review will consider the evidence for each of these potential impacts using relevant interventions with a particular emphasis given to the pilot evaluations in England and Scotland. It will conclude by summarising the evidence on impacts as a whole, identifying those factors which are likely to influence these and drawing out any particular lessons for the fieldwork element of the study.
6http://www.schoolfoodplan.com/the-plan/
7http://www.legislation.gov.uk/ukpga/2014/6/contents/enacted
8http://www.schoolfoodplan.com/report/kickstart-take-up-of-good-school-food/ 9http://www.schoolfoodplan.com/universal-free-school-meals/
21
1.2. Evidence on take-up
Evidence from both the English and Scottish pilot studies showed substantial increase in take up of school meals for eligible pupils following introduction of free school meals.
Figure 1.1 shows that, in Scotland, take up increased for pupils not registered for FSM (from 41 per cent to 69 per cent, an increase of 28 percentage points (ppts)) and for those previously registered for FSM (from 89 per cent to 94 per cent, an increase of 4.4ppts) (Maclardie et al., 2008). Overall, the uptake amongst all P1-P3 pupils increased from 53 per cent to 75 per cent (22ppts).11 Uptake
[image:21.595.81.475.455.703.2]also increased marginally for older pupils who were not eligible for the pilot (from 47 per cent to 50 per cent).
Figure 1.1: Scottish Trial: Percentage take up of School Meals by FSM eligibility before and during trial. All data from trial survey apart from non-trial area data (School Meal Census). Maclardie et al. (2008).
11 P1 to P3 is broadly equivalent to Year 1 to Year 3 in England
FSM Trial – Scotland (Her Majesty's Inspectorate of Education, 2008)
A 9-month trial commissioned by the Scottish Government, which took place between October 2007 and June 2008 in five local authorities in Scotland (East Ayrshire, Fife, Glasgow, Scottish Borders and West Dunbartonshire). These authorities were chosen to represent areas of deprivation and a mix of urban and small town/rural areas.
Free school meals were offered to all primary school pupils in the trial areas in P1 to P3 (broadly equivalent to Reception to Year 2 in England).
22
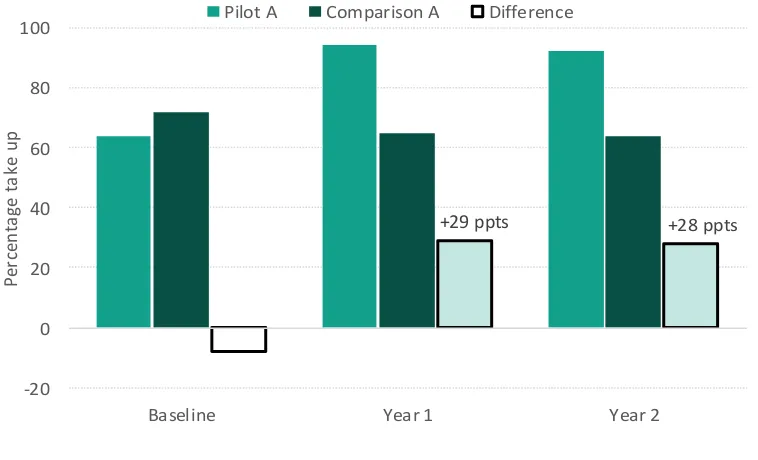
As shown in Figures 1.2 and 1.3, overall take-up in the English pilot for all pupils in Reception to year 4 increased by 28 ppts in area A12 and by 29 ppts in area B13 compared to the comparison areas
[image:22.595.77.456.461.691.2](Kitchen et al., 2012) by year 2.
Figure 1.2: English Pilot impact on percentage take up in area A. Significant differences shaded light green. Kitchen et al. (2012).
12 Newham
13 Durham
+29 ppts +28 ppts
-20 0 20 40 60 80 100
Baseline Year 1 Year 2
P
er
ce
n
ta
ge
t
a
ke
u
p
Pilot A Comparison A Difference
FSM Pilot – England (Rahim et al., 2012)
Two-year programme operating in three local authorities between the autumn of 2009 and summer of 2001. Two different approaches to extending FSM provision were tested – a ‘universal’ offer (Newham and Durham) where all primary school children were offered free school meals; and an extended entitlement offer in primary and secondary schools
(Wolverhampton).
A joint initiative between the then Department for Children, Schools and Families (now the Department for Education) and the Department of Health, with matched funding from participating local authorities.
The pilot included a range of supporting activities in each area to encourage take-up and to increase parental awareness of the pilot such as talks and taster sessions.
Both an impact evaluation and implementation evaluation were carried out of the pilot. Evidence of impacts was sought on pupils’ eating habits at school and at home; pupils’ general health and wellbeing; pupils’ behaviour, absences and academic performance.
23
Figure 1.3: English Pilot impact on take-up in area B. Significant differences shaded light green. Kitchen et al. (2012).
Whilst most of this increase in take-up was driven by the substantial increase in take-up of school meals in the pilot areas, there was also evidence that the pilot helped to mitigate an observed fall in take-up of school meals by those taking school meals at the baseline in the comparison areas. The pilot was shown to have a positive and significant impact on take-up for pupils who were already eligible for FSM as well as for those who were not. For those who were eligible for FSM at the baseline, the pilot increased take-up by 16 ppts, compared to the comparison group. Amongst those pupils who were not eligible for FSM at the baseline, this effect was, unsurprisingly, higher at 35ppts (Figure 1.4).
Figure 1.4: English Pilot impact on take-up in areas A and B by FSM eligibility under the old criteria at baseline. Significant differences shaded light green. Kitchen et al. (2012).
+23 ppts +29 ppts
-20 0 20 40 60 80 100
Baseline Year 1 Year 2
P
er
ce
n
ta
ge
t
a
ke
u
p
[image:23.595.78.507.503.739.2]24
These take-up figures are not strictly comparable with the Scottish figures as the pilot lasted two years in England, compared to one year in Scotland. The English evaluation also used differences between pilot areas and comparison areas to determine impact, whilst the Scottish study was a before and after analysis14. Nevertheless, it is interesting to note that in both pilots, take-up
increased amongst those pupils previously eligible for FSM. This suggests that increased take-up amongst the most disadvantaged children, an aim of the current policy in England, had been realised.
Reducing stigma
Entitlement to FSM is dependent on parental receipt of certain benefits.15 For a child to be eligible
for a FSM, a child’s parent or guardian has to register with their child’s school/local authority. Stigmatisation have been found to be a key barrier both to parents registering for FSM if entitled (claiming FSM), and taking the meals up (Harper & Wood, 2009). This is also likely to be worse where parents have bad memories of claiming FSM from their own time at school (MacLardie et al., 2008; P. Storey & Chamberlin, 2001; The Children's Society, 2016). There is sometimes a lack of awareness of entitlement (Woodward, Sahota, Pike, & Molinari, 2015). Other barriers may relate to the
claiming process. In response to this, many schools now use an eligibility checking service which requires little documentation from parents (Long, 2017), and many have opted for payment systems that make it more difficult for children to identify who is in receipt of free meals. Research has suggested that around 11% of pupils entitled to FSM were not claiming them in 2013, with pupils living in less deprived areas; attending schools with a lower school FSM rate; families with higher status occupations or pupils living in a family with higher parental qualifications being less likely to claim (Iniesta-Martinez & Evans, 2012; Lord et al., 2013).
There is evidence from various pilots in the UK that universal provision of school lunches can improve take-up not only from those who are registered but also from those who are entitled but not registered.16 Findings from the Hull initiative suggest that 71 per cent of staff felt that there was
less stigma attached to children on free school meals than before (Colquhoun et al., 2008). As noted above, the universal entitlement pilot in England and Scotland substantially increased the likelihood of those children entitled and eligible to have free school meals to take them. Interestingly, in England, it was also found that take-up also increased for those children who were entitled to free school meals but not eligible at the baseline – with 73 per cent having taken a school meal during the last week, compared to 34 per cent of similar pupils in comparison areas – only slightly lower than that for all non-takers of school meals in the pilot areas at the baseline (79 per cent) (Kitchen et al., 2012). This group covered 11 per cent of pupils in the universal pilot areas. The qualitative case studies (Rahim et al., 2012) indicated that the increased likelihood of taking up school meals among this group might be attributable to several factors including the removal of any stigma associated
14 The Scottish study did include data on non-trial areas from alternative sources which showed that take up over the same period had remained fairly static.
15 Income Support, income-based Jobseeker’s Allowance, income-related Employment and Support Allowance, support under Part VI of the Immigration and Asylum Act 1999, the guaranteed element of Pension Credit,
Child Tax Credit (provided they’re not also entitled to Working Tax Credit and have an annual gross income of no more than £16,190), Working Tax Credit run-on, Universal Credit.
25
with taking FSM, the fact that parents are no longer required to apply for free meals, that they were unaware they were entitled, or that they responded to the promotion of school meals during the pilot. In the Scottish trial, although the stigma attached to receiving FSM was not seen as a particular issue in primary schools, the trial was viewed positively in light of the fact that it eliminated the possibility of stigmatisation (MacLardie et al., 2008).
This suggests that providing a universal service is likely to increase take-up amongst disadvantaged groups, although it is likely that following the recommendation in the School Food Plan (Dimbleby and Vincent, 2013) to have a cashless payment system to shorten queuing times and prevent stigmatisation, that this source of stigma is becoming less of an issue.
1.3. Improving the quality of food eaten by children
There is clear evidence that the introduction of the school standards has improved children’s nutrition in schools and some evidence of a positive impact of the introduction of school food standards in England on consumption both inside and outside school in primary school children aged 4-7 years (Adamson et al., 2013, citing Haroun et al. (2010) and Adamson et al. (2011)). There have also been improvements in packed lunches over the same period, although it is unclear whether this is due to schools introducing packed lunch policies in line with the standards (Pearce, Harper, Haroun, Wood, & Nelson, 2011).
One meta-analysis found that, compared to school meals, total energy intake was higher with packed lunches, but that higher levels of sugar, saturated fat and sodium made their nutritional quality poor (Evans, Cleghorn, Greenwood, & Cade, 2010).17 Another study found the energy intake
from both packed lunches and school lunches to be low, given children’s energy needs, perhaps reflecting portion size or waste (Pearce et al., 2011). This research also revealed, however, that those children having school lunch had total lunchtime dietary intakes more in line with dietary recommendations than those children having a packed lunch 6 to 8 months after the nutrient-based standards for school lunch became mandatory. Recent research suggested that only 1.6 per cent of primary children’s packed lunches met the nutritional standards set for their classmates eating school lunches - up by 0.5 percentage points since the last study conducted 10 years previously (Evans and Cade., 2016).18 Few of the packed lunches met the standards for vitamin A (17 per cent),
iron (26 per cent) or zinc (16 per cent), mostly due to the lack of fresh salad and vegetables and un-processed meat or fish. Children having a school meal have been found to consume a healthier diet over the whole day compared with children who take a packed lunch to school (Evans et al., 2015).
Findings from the free school meal pilot in Hull showed that whilst a hot school lunch could
theoretically provide a more nutritionally balanced meal than a packed lunch, the pattern of actual consumption meant that a packed lunch was more likely to provide an excess of calories at
lunchtime, and a school dinner a shortage, but that the packed lunch was likely to provide more
17 A typical primary-school lunch would consist of two courses: a hot or cold main meal, a starchy accompaniment, a portion of vegetables/salad and a dessert/fruit. Water and bread would also be freely available. A packed lunch would typically contain a sandwich, a yoghurt, a chocolate biscuit, a piece of fruit and a bottle of squash (Pearce et al., 2011)..
26
calories from fat, as well as more saturated fat, sodium and sugar (Colquhoun et al., 2008).19 The
packed lunch also provided more micronutrients due to the volume of food consumed. Children in a school of high eligibility for FSM were likely to consume both the highest calorie intake from packed lunches (with implications for obesity) and low-calorie intakes from hot dinners (due to waste, with implications for hunger and lack of ability of a school lunch to make up for poor nutrition at other times).
Results from the national FSM pilot studies were positive in terms of improving the perception of quality of the food served. In Scotland, given the short term nature of the trial, the evaluation was not intended to provide a robust evaluation of the impact on pupils’ nutritional intake, health, behaviour or educational attainment; rather, the evaluation considered the early perceptions of health and other benefits (MacLardie et al., 2008). The qualitative research found that school meals were viewed positively overall by pupils and parents: pupils generally enjoyed the meals and parents felt that they were healthy and of high quality. Even parents whose child did not take school meals were positive about them. However, these views were not held by all parents, particularly amongst those in the least deprived areas, with some feeling that the packed lunches they had given to their child had been healthier than the school lunches.
Evidence from the English pilot showed that the increased take-up of school meals led to a shift in the types of food that pupils ate at lunchtime, away from foods typically associated with packed lunches towards those associated with hot meals as, not surprisingly, pupils were more likely to have a hot meal in the universal areas (+32 percentage points (ppts)) (Kitchen et al., 2012). As shown in Figure 1.4, at lunchtime, pupils in the universal pilot areas were significantly more likely to eat vegetables (+26 ppts), chips or roasted/fried potatoes (+13ppts) and rice/pasta/potatoes not fried in oil (+16ppts) and to drink water (+20ppts) than in the comparison areas. Pupils were significantly less likely to eat whole pieces of fruit (-19ppts)20 and crisps 18ppts) and to drink soft drinks
(-16ppts). The universal entitlement pilot also affected parent’s perceptions of school meals and their children’s eating habits, with parents in the universal areas much more likely to think that a school meal was better for their child’s health than a packed lunch (Kitchen et al., 2012; Rahim et al., 2012).
As in Scotland, the universal pilot in England improved parental perceptions of school meals, compared to the comparison areas. Parents in the universal pilot areas were more likely to give positive ratings for the quality of school meals (+7ppts), how healthy school meals are (+7 ppts), dining facilities (+12 ppts) and time taken for pupils to be served (+9ppts), although parents in comparison areas were more likely to respond ‘don’t know’ rather than give a negative rating to these aspects (Kitchen et al., 2012).
19 All primary and special school children in Hull were offered free school meals from April 2004 to March 2007. Schools were also encouraged to have free breakfast clubs which makes it difficult to attribute any findings specifically to the lunch service.
27
Figure 1.4: English pilot impact on consumption of foods at lunchtime: only differences significant at the 1% or 5% level are shown. Kitchen et al. (2012).
Given that school meals are generally a healthier option than packed lunches, and evidence that the introduction of food standards has improved the nutrition content of school lunches (Spence et al., 2013), increases in take-up of school meals will be critical to improving the intake of healthy food at lunchtime. Research has also shown that it is more expensive to consume a healthy diet than a less healthy one (Morris, Hulme, Clarke, Edwards, & Cade, 2014). Therefore, given the increases in take-up of school meals seen in the pilots detailed above, it seems likely that the presumed increased take up following UIFSM could have had a bigger impact in terms of improving nutrition intake – at least during school time – than any recent changes in the content of packed lunches, particularly for children from economically disadvantaged backgrounds.
1.4. Education, health and social impacts
Improving health in the short term
Weight status when children start primary school is an important predictor of health outcomes in later life. Across all countries of the UK, more than one in five children are overweight or obese during their first year of primary school and, by year 6, over one in three children are in one of these categories (Royal College of Paediatrics and Child Health, 2017). There has been little improvement in the proportion of children of healthy weight in any country over the last ten years, indeed there is evidence that younger generations are becoming obese at earlier ages and staying obese for longer (HM Government, 2016, citing Johnson et al (2015)). Those children living in deprived areas are much more likely to be overweight or obese and this is getting worse (HM Government, 2016, citing Health and Social Care Information Centre (2015)).
28
intake remains low (Weichselbaum & Buttriss, 2014). This research also highlighted continued evidence of socio-economic inequalities, with children from higher income families tending to have higher intakes of fruits and vegetables compared to children from lower income families.
Tooth decay is almost entirely preventable, but in 2013 (the latest year for which data is available), nearly a third (31 per cent) of 5 year olds and nearly a half (46 per cent) of 8 year olds had obvious decay experience in their primary teeth. Children eligible for FSM are more likely to have oral disease than other children of the same age.21
One systematic review of European studies looked at the effectiveness of school-based programmes promoting a healthy diet on actual dietary intake and on BMI levels (Van Cauwenberghe et al., 2010; Katz, O'connell, Njike, Yeh, & Nawaz, 2008). This found that the strongest evidence was for
multicomponent interventions that combine improved availability of fruit and vegetables (e.g. free or subscription) with a nutrition education curriculum delivered by the teacher and at least some parent involvement. A meta-analysis of school-based interventions to improve daily fruit and vegetable intake in children aged 5 to 12 showed that they can moderately improve fruit intake, but had a minimal impact on vegetable intake (Evans, Christian, Cleghorn, Greenwood, & Cade, 2012).
In terms of preventing obesity in particular, combined diet and physical activity interventions may be more effective than diet and physical interventions implemented separately (Brown & Summerbell, 2009). In its recent plan to tackle childhood obesity, the Government has said that this is likely to require a multi-faceted approach to tackle a number of causal factors related to environment, genetics, culture, and behaviour. The food offered in school and the adoption of ‘whole school approaches’ to food and healthy living are seen as key components in tackling this (HM Government, 2016).
The Scottish pilot evaluation did not explicitly measure any health outcomes in the pilot areas so there is no way of knowing if the pilot had any short-term impacts on the health of the children in these areas. The English pilot, using both survey and administrative data22 showed no significant
impact on the likelihood of children being obese or overweight for any of the pilot models (including the universal pilot areas). The study authors suggested this may be due to the universal pilot areas not significantly changing calorie intake (as opposed to nutrient intake) or that the evaluation period was too short to see any changes.
Evidence from the National Child Measurement Programme (NCMP) also suggests that the pilots are unlikely to have significantly reduced obesity rates (Public Health England, 2017):
▪ The NCMP takes height and weight measurements of Children are in reception and year 6 each year, primarily in state-maintained schools in England. The programme was launched in the 2005/06 academic year and now holds eleven years of data. A recent analysis of NCMP data by Public Health England examined trends in Body Mass Index (BMI) measures between 2006/7 and 2015/16.
▪ The report showed that, across the period, rates of obesity have fallen for reception boys, with no significant trend for girls, whilst it has increased for both at year 6. The prevalence of underweight has reduced slightly for boys and girls at reception, and more significantly for
29
girls at year 6. There has been an increase in inequality between areas with different levels of deprivation – increases in obesity have been faster in poorer parts of the country.
▪ The analysis calculated the extent to which trends in standardized BMI (‘BMI z-score’, which takes into account age and sex) in each local authority in England across the period diverged from that of the country as a whole, controlling for the age, ethnicity and the deprivation of pupils’ area of residence (using the Index of Multiple Deprivation).
▪ The FSM pilots in Newham and Durham began 3 years into the 10-year period assessed, and Islington also began universal FSM in primary schools from 2010/11 (4 years in), with the implied period of ‘treatment’ for each cohort of year 6’s increasing progressively from these points.23 If these programmes had substantially affected child weights, it would be
reasonable to expect it to lead to a divergence in the average rate of change across the period from that of the national trend.
▪ For year 6 boys, the results suggested that Islington had a trend similar to the national average, County Durham had a trend that was higher but not statistically significantly so, and Newham had a rate of increase across the period that was statistically significantly greater (but by a small amount - 0.01 of a standard deviation per year).
▪ For year 6 girls, Islington had a trend that was higher than the average but not statistically significantly so, County Durham had a trend similar to the national average, and Newham again had a statistically significantly greater increase (by 0.01 of a standard deviation per year).
▪ These data are therefore not consistent with extensions of FSMs in the recent past
substantially reducing the average BMI of local children by the time they reach year 6, or at least by an amount great enough to offset other local factors. Whilst Newham appears to have seen an increase in average BMI greater than the national trend, the difference is small in magnitude. The analysis only controlled for the effect of deprivation on levels of BMI, not for the fact that over the period there was a greater increase in BMI for children in relatively deprived areas more generally – this would be especially likely to affect Newham, which had the 2nd greatest extent of deprivation recorded in the 2010 IMD scales24.
There is limited evidence on the impact of school-based nutrition interventions on dental health, however self-reported dental health before and after the intervention was largely the same in Hull, although there was a reduction in extractions over the course of the pilot (Colquhoun et al., 2008).
Building healthier food habits for the long term
One of the key aims of the UIFSM policy is to improve diet and health in the long term through establishing good dietary habits early on. Research which observed over 400 children aged 24-26 months at lunchtime showed that breastfeeding and giving children a variety of solid foods at a
23 In Newham, year-6s in 2009/10 would have experienced universal FSMs for at most 1 school year, whilst those of 2015/16 would have experienced it for up to 7 school years at the point of measurement.In Newham, year-6s in 2009/10 would have experienced universal FSMs for at most 1 school year, whilst those from the following year onwards would have experienced it for up to 2 school years, as the scheme was ended at the conclusion of the 2009-12 pilot. In Islington, year-6s in 2010/11 would have experienced universal FSMs for at most 1 year, whilst those of 2015/16 would have experienced it for up to 6 school years at the point of measurement.
30
young age influences their preference for food variety. These children were followed up when they were aged between 4 and 22 years old and a food choice questionnaire was used to establish their contemporary food variety. It was found that these early food experiences can ensure children are more likely to keep trying a variety of foods into older childhood, adolescence and early adulthood (Nicklaus, 2009; Nicklaus, Boggio, Chabanet, & Issanchou, 2004, 2005). This is beneficial, as eating a variety of foods is essential to achieve energy and nutrient needs (Krebs-Smith, Smiciklas-Wright, Guthrie, & Krebs-Smith, 1987) and contributes to the pleasure of eating (Rolls, 2000). The impact of this on the likelihood of obesity remains to be explored (Nicklaus, 2009).
Being obese in particular as a child has been found to increase the likelihood of obesity in adulthood. A recent systematic review of 15 cohort studies showed that obese children and adolescents were around five times more likely to be obese in adulthood than others (Simmonds, Llewellyn, Owen, & Woolacott, 2016). Those long term habits can have large consequences: in 2014-15, £5.9 billion was spent on poor diet-related ill health by the NHS in England and £0.9bn on physical inactivity
(Scarborough et al., 2011).25 These figures cover chronic conditions such as cardiovascular disease
(CVD), cancer, diabetes and dental caries. Over £5bn was spent on overweight/obesity-related ill health, although this includes costs from poor diet and physical inactivity. This covers conditions such as ischaemic heart disease and stroke, breast cancer, colon/rectal cancer and osteoarthritis. Costs are also projected to rise in the future due to projected increases in the prevalence of overweight and obesity – with a £2bn increase in costs by 2030 representing 2 per cent of total health-care spending in 2009 in the UK (Wang et al., 2011).
In addition to escalating healthcare costs, obesity creates indirect costs through decreases in workforce productivity (Lehnert et al., 2013). Lost earnings due to sickness or early death are estimated at up to £2.6bn and the costs of lower employment as a result of obesity in terms of welfare costs and lost earnings may be as much at £16bn or more (McCormick & Stone, 2007).
In the English pilot, a longitudinal survey of pupils and parents showed that apart from pupils in the universal areas being significantly less likely to report eating crisps at least once a day (-13ppts), there were no other significant changes in the child’s diet or drink on school days, despite the changes observed at lunchtime (Kitchen et al., 2012). There was also no impact on the likelihood of eating a hot meal in the evening, suggesting that parents did not see a hot meal at lunchtime as a substitute for a hot meal in the evening.26 There were some differences for those children who had
an unhealthy diet at the baseline.27 Firstly, they were less likely to take a school meal than all pupils
and, while there was no impact on the likelihood of eating cake, biscuits, chocolate bars or puddings among the pilot group as a whole, there was an impact of +23ppts among the pupils with a less healthy diet. There was no significant impact on the likelihood of eating crisps at least once a day among pupils with less healthy diets even though they had a decreased likelihood (-25ppts) of eating
25 Costs have been adjusted for inflation with the assumption that England represents 85 per cent of UK cost and are based on obesity levels. No adjustment has been made for the slight changes in overweight and obesity rates over this period.
26 Note that a hot meal is not necessarily more nutritious than a cold meal but depends on the contents of the meal.
31
crisps at lunchtime. This suggests that these children were more than making up for the healthy food they were given at lunchtime (and possibly not eating) by filling up on un