literacy and numeracy of
13- to 19-year-olds in England,
1948–2009
Research report
Published by the National Research and Development Centre for Adult Literacy and Numeracy
For information on alternative formats, or to give feedback on the content and accessibility of this publication, please contact:
Publications NRDC
Institute of Education 20 Bedford Way London WC1H 0AL
Telephone: +44 (0)20 7612 6476 Fax: +44 (0)20 7612 6671 Email: [email protected]
© Crown Copyright 2010
Contents
Executive summary ...6
1. Introduction ... 10
1.1 Context 10 1.2 Method 10 1.3 Structure of this report 11 2. Sources of data ... 12
2.1 Reading 13 2.1.1 National monitoring surveys ... 13
2.1.2 Lifetime cohort studies ... 15
2.1.3 International surveys ... 15
2.1.4 Repeated use of standardised tests ... 16
2.1.5 Adult literacy surveys ... 17
2.2 Writing 18 2.2.1 National monitoring surveys ... 18
2.2.2 National test results ... 19
2.2.3 National examination results ... 19
2.2.4 Analyses of examination scripts ... 19
2.3 Numeracy 20 2.3.1 National monitoring surveys ... 20
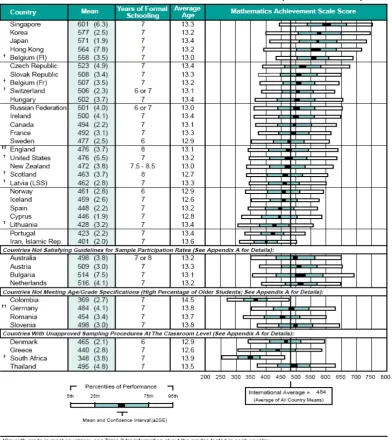
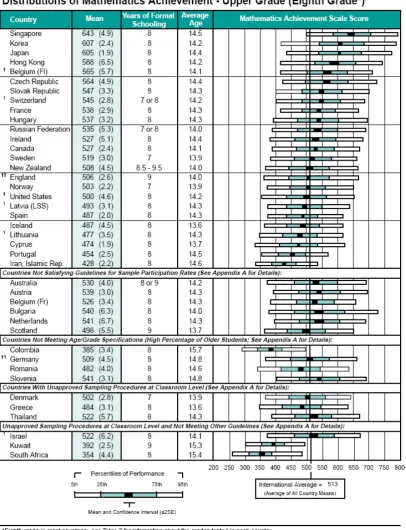
2.3.2 International surveys ... 20
2.3.3 Repeated use of standardised tests ... 22
2.3.4 National test results ... 23
2.3.5 National examination results ... 23
2.3.6 Adult numeracy surveys ... 23
3. Findings ... 25
3.1 Reading 25 3.1.1 National monitoring surveys, 1948–88 ... 25
3.1.2 International surveys, 1960–2006 ... 27
3.1.3 Repeated use of standardised tests, 1997–2009 ... 31
3.1.4 Adult literacy surveys, 1996–2003 ... 32
3.1.5 Conclusions on trends in reading attainment ... 34
3.2 Writing 34 3.2.1 National monitoring surveys, 1979–88 ... 34
3.2.2 National test results, 1995–2007 ... 34
3.2.3 National examination results, 1989–2009 ... 35
3.2.4 Analyses of examination scripts, 1980–2004 ... 36
3.2.5 Conclusions on trends in writing attainment ... 37
3.3 Numeracy 38 3.3.1 National monitoring surveys, 1978–87 ... 38
3.3.2 International surveys, 1964–2007 ... 38
3.3.3 Repeated use of standardised tests, 1997–2009 ... 49
3.3.4 National test results, 1995–2007 ... 49
3.3.5 National examination results, 1989–2009 ... 51
3.3.7 Adult numeracy surveys, 1981–2003 ... 51
3.3.8 Conclusions on trends in numeracy attainment ... 54
3.4 Correlations between literacy and numeracy achievement 55 4. Interpretation ... 57
4.1 ‘Single-criterion’ studies 57
4.4 Implications for policy 72
4.5 Caveat 72
Date of research and writing of this report
This report is based on research funded by the Department for Education and Skills and undertaken between April 2005 and March 2007. The text was updated in March 2010 to include reference to additional research made available since the initial research was completed.
Project team and authorship
Professor Greg Brooks, University of Sheffield, project director Dr Sammy Rashid, University of Sheffield, research fellow
Sammy Rashid assembled all the data and all the level descriptions, carried out all
necessary statistical analyses, and wrote the first draft of this report (80% of the research, 40% of authorship).
Greg Brooks directed the project and edited this report (20% of the research, 60% of authorship).
Acknowledgments
The project was funded by the Skills for Life Strategy Unit within the (then) Department for Education and Skills, now subsumed into the Department for Business, Innovation and Skills, via the National Research and Development Centre for adult literacy and numeracy, which is led by the Institute of Education, University of London.
Executive summary
Headline findings
The reading, writing and numeracy attainments of this age group at the top end are among the best in the world. Except in number skills at age 13 over 20 years ago and in writing between 1980 and 1993 there is no evidence of a decline in any area. Overall, the data suggest that average attainments in all three areas have improved over roughly the last decade. Most young people do have functional to good literacy and numeracy, but more needs to be done. In particular, about 17% of young people aged 16–19 have poorer literacy, and about 22% have poorer numeracy, than is needed for full participation in today’s society.
Method
Information on attainment levels of 13- to 16-year-olds was gathered from national
monitoring surveys for the period 1948–88, international surveys for the period 1960–2007, and test and examination results for 1995–2009. Data on 16- to 19-year-olds were extracted from adult literacy and numeracy studies for the period 1981–2003. More information was available for reading than for numeracy, and least for writing. Where possible, the data were analysed to provide time series, and detailed criteria for various levels of literacy and
numeracy from more recent surveys were assembled and analysed.
Conclusions on trends in attainment in reading
•
There was an improvement in average reading scores from 1948 to 1960.•
Average levels remained remarkably constant from 1960 to 1988.•
There is a gap in the evidence base from 1988 to about 1997.•
Some data suggest a gentle rise between 1997 and 2004, then a further plateau.•
But the proportion of young adults with poor reading (below Level 1) seems to have remained stubbornly at about 17%. A lifecourse trend (improvement into early middle age, then usually a plateau, then decline) will have lifted some people into adequate literacy levels by their early to mid 20s, but many still have poor literacy at all later ages.Conclusions on trends in attainment in writing
•
There is no evidence before 1979.•
There was no significant change between 1979 and 1988.•
GCSE results suggest a rise from 1989 to 1990, then a plateau from 1990 to 1998, then a gently rising trend up to about 2005 and a rather faster increase up to 2009. The increase over the entire period was substantial.•
But studies of examination scripts suggest little change between 1980 and 2004 (with a dip in between).•
There may be no contradiction: achievement at particular levels may not have changed (as suggested by studies of marking in KS3 and GCSE), even if overall levels have.Conclusions on trends in attainment in numeracy
•
There is very little evidence before 1978, and none at age 13 after 1995.At age 13
•
There appears to have been a slight decline between 1964 and 1988, especially in arithmetic.•
There appears to have been no significant change between 1988 and 1995.At age 14
•
International surveys show no significant change between 1995 and 2003, but•
National data show a significant improvement between 1997 and 2007/09 (Yellis and KS3 maths), even though a part of the rise in KS3 maths between 1996 and 2000 may have been due to grade drift.No satisfactory way of resolving most of this contradiction suggests itself, but
•
There was a significant improvement between 2003 and 2007 (TIMSS).At age 15/16
•
There was a small improvement between 1978 and 1982.•
There was no significant change between 1982 and 1987.•
There was a substantial increase in the GCSE ‘pass rate’ between 1989 and 2005.At age 16+
•
Though there are four surveys spanning the period 1981–2003 they cannot be used to identify trends.•
However, they all show that substantial proportions of young people (16–19 or 16–24/25) have poor numeracy (below Entry level 3), of the order of 22%.Overall
•
On average, number skills in England are poorer than in many other countries, especially industrialised ones, though other aspects of numeracy are better.Criteria and standards
•
There is no evidence to suggest that the criteria against which literacy and numeracy attainment is judged have been lowered. On the contrary, there is some evidence that the criteria have been maintained or even made more demanding.•
The criteria used to judge poor literacy focus on reading, and essentially define it as the ability to handle only simple texts and straightforward questions on them where no distracting information is present or nearby. Making inferences and understanding forms of indirect meaning (e.g. allusion, irony) are likely to be difficult or impossible.•
The criteria used to judge poor numeracy essentially define it as very basic competence in maths, mainly limited to arithmetical computations and some ability to comprehend and use other forms of mathematical information.•
While these are useful skills, they are clearly not enough to deal confidently with many of the literacy and numeracy challenges of contemporary life.•
That said, most young people in England do have functional skills, and those with the highest skills are up with the best in the world.•
Moreover, since criteria for judging both literacy and numeracy appear to have become more demanding in recent years, steadily or gently rising and even quite flat graphs can be seen as a success story.Implications for policy
•
Efforts to improve the initial teaching of literacy and numeracy to young children must continue.•
Children who fall behind in the early stages must be identified and given targeted catch-up programmes immediately.•
Family literacy and numeracy programmes can make a contribution to preventing early failure.•
Effective programmes should be maintained and not funded only in the short term.•
The search for effective ways of raising levels of functional literacy and numeracy should continue.•
Given that a light sample monitoring system seems to be being established at adult level there is a case for re-establishing one at school level.Caveat
1. Introduction
1.1 Context
How well can 13- to 19-year-olds in England read, write and use mathematics, now and in the past? These are the questions this project set out to investigate. It arose from the
considerable interest within the (then) Department for Education and Skills in 2004–05 in the literacy and numeracy levels of this age-range, especially in the light of the results from the PISA (Programme for International Student Assessment) survey of 2000. A brief paper on literacy levels at age 15/16, 1948–2003 was delivered to the Department in December 2004 (Brooks, 2004); this project began in the autumn of 2005, and ended in March 2007. In the interim before publication, this report was updated in December 2007 and again in
November–December 2009 in order to add data that had appeared since the project formally ended.
The topic is relevant to:
•
the fact that half of the 860,000+ achievements under the Skills for Life Strategy to the end of academic year 2003/04 were provided by 16- to 18-year-olds•
the achievement of the government’s Skills for Life targets for 2004, 2007 and 2010, in particular the achievement of the 2010 target two years early, by the summer of 2008•
the Leitch review of skills and the ambitious targets it set for adult literacy and numeracy levels to be achieved by 2020•
the government’s subsequent setting of an ambitious interim target for 2011•
the high rate of drop-out from education at age 17•
progress towards the Government’s targets for GCSE (age 16)•
the gradual introduction of diplomas following the Tomlinson proposals for reform of 14– 19 education•
the Foster review of further education•
what employers can reasonably expect of young people entering the labour market•
the relationship between public examination pass rates and other evidence such as surveys and standardised tests•
international comparisons, and•
the questions of whether and, if so, in which direction, levels of attainment of 13- to 19-year-olds have moved over time.1.2 Method
1.3 Structure of this report
The sources which were used (and some which were not) are described in Chapter 2, and the findings on the literacy and numeracy levels of 13- to 19-year-olds (and in some cases of older age groups) in Chapter 3. The criteria against which the levels were judged are
2. Sources of data
The questions the project addressed inherently required the use of quantitative data, which could have come from various sources:
•
Self-report•
Studies of progress in adult literacy and numeracy•
Qualifications achieved in adult literacy and numeracy•
National monitoring surveys•
Lifetime cohort studies•
International surveys•
Repeated use of standardised tests•
Trends in national test results•
Trends in examination results•
Analyses of examination scripts•
Adult basic skills surveysExamples of all of these were used, except the first three:
•
For present purposes, self-report was considered inherently less reliable than performance on a test.•
There have been four national studies of progress in adult literacy, the last two of which also covered adult numeracy:o A study by the National Foundation for Educational Research in 1976–79 (Gorman, 1981; Gorman and Moss, 1979)
o The Basic Skills Agency’s Progress in Adult Literacy study in 1998–99 (Brooks
et al., 2001)
o A study by the National Institute of Economic and Social Research in 2002–07 (Metcalf et al., 2009)
o The National Research and Development Centre for adult literacy and
numeracy’s Learner Study in 2003–07 (Brooks and Pilling, forthcoming; Rhys Warner et al., 2008; Vorhaus et al., 2009).
However, these studies by definition sampled only adults with poorer literacy and numeracy; since this means that the samples were not representative of the full population or of the full range of attainment levels the findings were not used.
•
Similarly, the national Learning and Skills Council (LSC) and its predecessor, the Further Education Funding Council, have for many years collected data on qualifications inThe sources that were used are now listed and briefly described; some that were not used in one area or another (in addition to those already ruled out for all areas) are also listed, and the reasons for not using them are given. Details are given first for reading, then for writing, and finally for numeracy. In most cases it is clear whether literacy results should be included under reading or writing since the assessment focused on one or the other. The key stage 3 (KS3) national tests in English at age 14 did have separate reading and writing papers, but results for them were not published separately. It was decided to include the results from these tests under writing because they are most akin to GCSE English results. The forms of evidence used in each area are listed in Table 2.1.
Table 2.1: Forms of evidence used for reading, writing and numeracy Used for:
Form of evidence Reading Writing Numeracy
National monitoring surveys
Lifetime cohort studies
International surveys
Repeated use of standardised tests
Trends in national test results
Trends in examination results
Analyses of examination scripts
Adult basic skills surveys
None of the sources available for England is as comprehensive as the main source for France would be. Every year the French Ministry of Defence organises a ‘jour de préparation’ which all 17-year-olds must attend, young women as well as young men, and at which their literacy is tested. (This is a survival from the days of compulsory military service for young men.) In 2004 the results showed that 11% of French 17-year-olds struggled to understand a simple text, and 4.5% had extreme difficulty.
For caveats on the use of national test and examination results for monitoring trends over time see Green and Oates (2007) and other authors cited by them. They also advocate the re-establishment of a light sample monitoring system at school level (the last such survey in England took place in 1988) to provide evidence on trends that is not subject to text or examination pressures or attempts to achieve government targets.
For parallel data on attainments over time at primary level see the two analyses prepared for the Cambridge review of primary education in England directed by Robin Alexander: Tymms and Merrell (2007) for the national evidence, and Whetton, Ruddock and Twist (2007) for the international evidence. The latter provides a summary of arguments for and against the reliability of international comparative data, and arguments for the robustness of international data are elaborated in Whetton, Twist and Sainsbury (2007) – these arguments are also, of course, relevant to the age range considered in this report and should be taken into account when judging the results summarised here, particularly the numeracy results.
2.1 Reading
No information was available from trends in national test results (but see the note above about KS3 test results), trends in examination results or analyses of examination scripts.
2.1.1 National monitoring surveys
•
A series carried out in 1948/1952/1956/1961(twice)/1971 using the Watts-Vernon test•
A series carried out in 1955/1960/1971/1979 using the National Survey 6 test•
A series carried out annually from 1979 to 1983 and with a final survey in 1988 by the Assessment of Performance Unit Language (i.e. English) Monitoring Project.(For most of the period these surveys also covered Wales and, in 1979–88, Northern Ireland. When they were available, separate figures for England were used for this report; when they were not, the combined figures for England and Wales were used. Given that over 90 per cent of the population of the two countries lives in England, removing the data for Wales would have made rather little difference.)
Watts-Vernon (WV) and National Survey 6 (NS6) surveys
For a summary of the results of all these surveys except the last see Start and Wells (1972). Pupils aged 15/16 (Year 11) were targeted in all these surveys, and in many later ones, as being, generally, in their last year of secondary education. The survey findings could
therefore be seen as estimates of the effectiveness of 11 years of schooling. The surveys of 1948–71 were conducted either by HM Inspectorate or by the National Foundation for Educational Research (NFER).
The WV test was developed from 1938 by Dr Watts. He piloted it with London schoolchildren, but no records appear to have survived of any testing carried out. The Ministry of Education (1950) calibrated WV using ‘accurate’ pre-war norms of other tests, and by testing pupils in six secondary schools in London and the Home Counties chosen to be ‘fairly representative’. The sample was 432 Year 10 pupils (14- to 15-year-olds). By modern standards this
‘standardisation’ was rudimentary, and caution therefore needs to be exercised in interpreting findings from this test. It had 35 items. Each was a multiple-choice sentence-completion item with five options. The first item was:
You can buy stamps at a post (station, house, shop, man, office).
The NS6 test, devised in 1955, appears to have been standardised more rigorously (by NFER). It had 60 items. Each was again a multiple-choice sentence-completion item with five options. The first item was:
Mary has one brother called ( Ann / Susan / John / Hilda / Jane ).
In the 1971 survey both tests were taken by all pupils in the sample, thus enabling a statistical link between the two series.
When first developed WV and NS6 were considered state-of-the-art, but by the time they were last used (in 1971 and 1979 respectively) had come to seem both out of date (for example, an item in NS6 used the word ‘mannequin’) and to under-represent the complex nature of reading and its uses, not to mention other aspects of language. However, for the period 1948–71 the results from these tests are the only national monitoring survey information available for any age group in the range 14 to 19 (and for any aspect of the curriculum) in England.
Assessment of Performance Unit (APU) surveys
new era in reading tests. Some items were multiple-choice but most were ‘supply’ type, that is, pupils had to write their own short answers. Roughly half the booklets contained fiction and half factual material. Several tests were used in more than one year, in particular in 1979, 1983 and 1988, thus enabling statistical equating across years. Similarly, NS6, on its final outing, was taken by a sub-sample of pupils in the 1979 survey, thus enabling a statistical link between the APU surveys and both previous series.
2.1.2 Lifetime cohort studies
There are three possibly relevant studies of this type ongoing in Britain:
•
The Medical Research Council National Survey of Health and Development (NSHD), based on all those born in Britain in a week in March 1946. This cohort took the WV reading test at age 15 in 1961 (Douglas et al., 1968);•
The National Child Development Study (NCDS), based on all those born in Britain in a week in March 1958. This cohort took a reading test at age 16 in 1974 (Fogelman, 1976, 1983);•
The British Cohort Study 1970 (BCS70), based on all those born in Britain in a week in April 1970; this cohort took a reading test at age 16 in 1986 in what was called the‘Youthscan’ study
Unfortunately, the results of NCDS and BCS70 could not be used. NCDS used a variant of the WV test which cannot be statistically equated with it, and the BCS70 ‘Youthscan’ results were unreliable and incomplete due to a teachers strike. However, the NSHD result was used, because the test was the Watts-Vernon – the result has therefore been included with those from the series of national monitoring surveys which used this test (and the heading ‘lifetime cohort studies’ does not re-appear in Chapter 3).
2.1.3 International surveys
There have been six such surveys that could be relevant here:
•
a survey in 1960 of the reading attainment of pupils aged 13/14 in 12 countries, carried out by the International Association for the Evaluation of Educational Achievement (IEA) (Foshay et al., 1962)•
a survey in 1971 of the reading attainment of pupils aged 13/14 and 15/16 in 15 countries, also carried out by IEA (Thorndike, 1973)•
four surveys in 2000, 2003, 2006 and 2009 of the reading attainment of pupils aged 15 called the Programme for International Student Assessment (PISA), sponsored by the Organisation for Economic Cooperation and Development, and carried out by an international consortium (Gill et al., 2002; OECD, 2005, 2007; Bradshaw et al., 2007).The UK’s PISA 2003 results were declared unreliable by OECD because of an inadequate sample, and were therefore not used, and the 2009 results were not available in time to be included. The results of the other four surveys just listed were used.
The IEA surveys, 1960 and 1971
In the 1971 survey all the test items were again of four-option multiple-choice type. For 13/14-year-olds there were two tests containing eight passages and 52 items; for 15/16-year-olds, also two tests containing eight passages, but 54 items.
England and Wales took part jointly in both IEA surveys.
PISA 2000, 2006
England, Northern Ireland and Scotland took part in 2000 and all four countries of the UK in 2006, and the surveys were designed to enable calculation of separate results for England. PISA 2000 was carried out in 32 countries and the main focus was on reading literacy, with sub-samples of pupils also taking tests of mathematical literacy and scientific literacy. PISA 2006 was carried out in 57 countries and the main focus was on scientific literacy, with sub-samples of pupils also taking tests of mathematical literacy and reading literacy. The reading tests were all of the ‘new era’ type pioneered by NFER in the APU surveys. The definition of reading set out for the 2000 survey and also used later was:
the ability to understand, use, and reflect on written texts to participate effectively in life (PISA does not seek to measure the extent to which students are fluent readers or their ability in spelling or word recognition). Reading literacy was assessed using a series of texts, and a number of tasks set for students on each text. Just over half of the tasks were in the form of multiple-choice questions; the rest required students to construct their own answers…
In each domain, a student’s score is expressed as a number of points on a scale, and shows the highest difficulty of task that the student is likely to be able to complete. The scales are constructed so that the average score for students from all OECD countries participating in PISA 2000 is 500 and its standard deviation is 100 – that is, about two-thirds of students internationally score between 400 and 600. Each country contributes equally to this average irrespective of its size…
In [the 2000 survey in] England, co-operation was obtained from 4,120 young people born in 1984, in a representative sample of 155 schools throughout the country: 59% of those initially selected and 82% after including replacement schools for those that refused to take part. Thirty-five students who were born in 1984 were randomly selected to take part from each school. In March 2000 each student took a written assessment lasting two hours, which was administered in his or her own school using standardised methodology and in test conditions… The response rate among students who were selected to take part and were eligible for the survey was 81%. (Gill et al., 2002)
In PISA 2006, because the main focus was science, only a sub-sample of pupils took the reading tests. However, in each country their results were weighted to estimate the
performance of the full sample.In England, 169 schools and 4935 pupils participated in PISA 2006.
2.1.4 Repeated use of standardised tests
motherhood, and young mothers are more likely to have less education and associated qualifications – hence the reduction in the ... children’s test scores.’
Yellis
Therefore the only, but very useful, source of standardised test data over time was the Yellis vocabulary test devised by the CEM Centre at Durham University written vocabulary test can be considered as a measure of one part of reading ability. The Yellis test has been taken by nationally representative samples of year 10 pupils (age 14) annually since 1997; data for 1993–2009 were made available to this project (for details see the Acknowledgments). All items are four-option multiple-choice, and the test is computer-administered and adaptive.
2.1.5 Adult literacy surveys
Between 1972 and 2003 there were 10 national surveys and one international survey which assessed the reading attainment of nationally representative samples of adults in England, but only three included young people under 20:
•
the International Adult Literacy Survey(IALS), 1996 (Carey et al., 1997)•
the Basic Skills Agency’s survey of need, 1996–97 (Basic Skills Agency, 1997a)•
the Skills for Life survey of need (SfL), 2002–03 (Williams et al., 2003),and only two of these reported separate findings for an age-group relevant to this project, the exception being the Basic Skills Agency’s survey.
IALS, 1996
This was the first of only two international adult literacy surveys which have so far been mounted, and the only one in which the UK took part. (A policy decision was made in 2000 not to participate in the Adult Literacy and Lifeskills (ALL) survey of 2002–03; England instead carried out its own survey – see below. However, all four countries of the UK are scheduled to take part in the next such survey, the Programme of International Assessment of Adult Competencies (PIAAC), in 2011.)
Like PISA, IALS was sponsored by OECD and carried out by an international consortium. It took place in 23 countries in three sweeps between 1994 and 1998. The UK took part in the second sweep in 1996.
The definition of literacy used in IALS was:
using printed and written information to function in society, to achieve one’s goals, and to develop one’s knowledge and potential.
Literacy was examined across three domains:
•
Prose literacy: the knowledge and skills required to understand and use information from texts such as passages of fiction and newspaper articles;•
Document literacy: the knowledge and skills required to locate and use information contained in various formats such as timetables, graphs, charts, and forms; andFor this report, the prose and document domains were taken to represent literacy, and results for them are reported in Section 3.1.4 under reading. ‘Quantitative literacy’ was taken as a proxy for numeracy – results for this are given in Section 3.3.2 under numeracy.
The tests were all specially devised, and most were based on pieces of authentic text (that is, authentic in the source language; all were subject to translation). All responses were of supply type.
In Britain, the survey sampled a total of 3811 adults aged between 16 and 65. Of these, 372 respondents were from England and in the age group 16 to 25 – no further differentiation within that group was available. Weighting was used to allow for sample design and adjustments were made for any non-response bias.
The SfL survey, 2002–03
This survey treated literacy as one domain rather than two. The survey covered only
England, but the age-range 16–64. The data were broken down by age-groups, of which one was 16–19. The test items were all specially devised, by CDELL, the Centre for Developing and Evaluating Lifelong Learning at the University of Nottingham. A pilot version of the instrument was heavily criticised by Brooks et al. (2005) for the inauthentic nature of some of the items. All responses were multiple-choice. This was one of the few surveys covered in this report to be computer-administered. It was to an extent adaptive: after a short and very simple initial screening section, test-takers were routed to three further blocks of items intended to be appropriate to their reading level as estimated from their percentage score on the previous block. A new Skills for Life survey scheduled for 2010 is intended to provide the first over-time evidence on reading performance at adult level. This and the decision to take part in PIAAC (see above) seem to represent the establishment at adult level of a light sample monitoring system of the sort that was abolished at school level in 1988.
2.2 Writing
No information was available from lifetime cohort studies, international surveys or repeated use of standardised tests.
There has been one international study specifically of written composition at school level, of pupils aged 13/14 in 1983. England and Wales took part (Gubb et al., 1987), but the survey was deliberately designed and reported to prevent the calculation of average national scores and therefore the creation of a ‘league table’ (Gorman et al., 1988). Even if that had been possible, there have been no further attempts to carry out such a survey, so that it would not be possible to comment on trends over time.
2.2.1 National monitoring surveys
The only surveys which covered writing which provided usable results for this report were the APU surveys of 1979–83 and 1988 (see again Gorman et al., 1988, 1991). As with reading, the writing tests were all specially devised, and attempted to present authentic literacy tasks. Several tests were used in more than one year, in particular in 1979, 1983 and 1988, thus enabling statistical equating across years. The principal results from the APU surveys were measures of attainment in written composition, but a small amount of information was also available on spelling, based on re-analyses of scripts from the 1980 and 1983 surveys.
Use was also made of a detailed study of the comparability of marking standards in 1996 and 2001 (Massey et al., 2002).
2.2.2 National test results
Overall national results for the KS3 (age 14) English tests were obtained for 1995 to 2008
when these tests were in operation. The results for 2008 were not used here because the marking problems which occurred in that year (and which led to these tests being
discontinued after 2008) made them insufficiently comparable to earlier results. The form of these tests varied slightly over this period, but they always contained a reading test, focusing largely on a Shakespeare play, and a paper testing writing; there was sometimes also a spelling test. Only aggregated results were published. The test was therefore an assessment of response to literature as well as of literacy as such; nevertheless it has been counted here as a literacy test.
Use was also made of a detailed study of the comparability of marking standards in 1996 and 2001 (Massey et al., 2002).
2.2.3 National examination results
The relevant data under this heading are results for GCSE English (Language), which for present purposes has been counted, like the KS3 English tests, as a literacy test, even though an assessment of oracy (speaking and listening) skills has contributed to candidates’ overall GCSE results since 1994 (in 1989–93 oracy was separately certificated). Although three different examination boards now offer this exam in England (and earlier in the period covered by the data gathered there were one or two more), the national data are aggregated across boards. Also, although people of other ages may take this examination, the published national data relate only to pupils aged 15/16 and were therefore usable for this project.
Each cohort of pupils in these years numbered between 520,000 and 660,000. It should be noted that two slightly different definitions of pupils eligible to be counted in the ‘15-year-old’ age-group were used during this period: for 1989 to 2004, those aged 15 on 31 August at the start of the academic year; for 2005 to 2009, those at the end of KS4. This does not appear to have caused any significant change in the overall results.
Information was obtained for the period 1989–2009, that is, for the entire history of GCSE
from its inception to the present (sources:
years).
Use was also made of a study of examination standards in GCSE English between 1989 and 1995 (SCAA, 1996).
2.2.4 Analyses of examination scripts
worse or similar control of (for example) spelling, punctuation, paragraphing, overall text structure, and the content of what they wrote.
There have been three such studies:
•
The first was carried out by the University of Cambridge Local Examinations Syndicate, now part of the OCR Board, in 1995, and compared aspects of the writing of candidates taking examinations in English at 16+ in 1980, 1993 and 1994 (Massey and Elliott, 1996)•
QCA (2004) studied standards of performance in GCSE English in the period 1999–2002•
the Cambridge study was later extended to 2004 (Massey et al., 2005). All three were obtained and used.2.3 Numeracy
For numeracy, information was available under all the headings listed under reading and/or writing except analyses of examination scripts (there were none) and lifetime cohort studies.
For brief details of the three ongoing lifetime cohort studies see under reading, Section 2.1.2. There were no numeracy results from them that could be used for this project. The NCDS (1958) and BCS70 (1970) studies did not administer a maths test at any relevant age. The NSHD (1946) cohort did take a maths test at age 15, but the test had been specially devised and could not be calibrated with any others analysed here. Also, the distribution of the raw scores was severely skewed and indicated that the test was too difficult.
2.3.1 National monitoring surveys
There were no maths surveys comparable to the reading surveys of the period up to 1971. However, the APU Mathematics Monitoring Project, also based at NFER, carried out surveys at age 15/16 (Year 11) in England, Wales and Northern Ireland annually from 1978–82, with a final survey in 1987 (APU, 1988; Foxman et al.,1990a, b).
The tests were all specially devised. The modes of assessment were written and practical, and the tests covered number, measures, algebra, geometry, and probability and statistics. Again, items were repeated systematically in order to enable calculation of trends over time.
2.3.2 International surveys
For numeracy, this is the major source of information, because there have been 10 relevant studies at school level (and two at adult level with data for a relevant age-group – see Section 2.3.6):
•
First International Mathematics Survey (FIMS), 1964 – age 13•
Second International Mathematics Survey (SIMS), 1981 – age 13•
International Assessment of Educational Progress 1 (IAEP1), 1988 – age 13•
International Assessment of Educational Progress 2 (IAEP2), 1991 – age 13•
The Third International Mathematics and Science Study-Repeat (TIMSS(R)), 1999 – age 14•
Trends in International Mathematics and Science Study (TIMSS 2003), 2003 – age 14•
Trends in International Mathematics and Science Study (TIMSS 2007), 2007 – age 14•
Programme for International Student Assessment (PISA), 2000 – age 15•
Programme for International Student Assessment (PISA), 2006 – age 15Results from all of these were gathered and used; brief details of each survey follow.
FIMS, 1964
England and Wales (together) along with eleven other countries (including Scotland) participated in the First International Mathematics Survey, which surveyed 13-year-olds (attending school in the (school) year where the majority of students had attained the age of 13 by the middle of the school year). Those in the final year of (non-compulsory) secondary education were also surveyed; in Britain this meant what is now called Year 13, but since the sample was by definition not representative of all young people of that age the results have not been used in this report. The survey was conducted by IEA. Categories of mathematics tested were new maths (e.g. groups, matrices), basic arithmetic, advanced arithmetic, algebra and geometry (Husén, 1967).
SIMS, 1981
Twenty education systems, including England and Wales (together) participated in the Second International Mathematics Survey, seventeen years after FIMS. The main sample consisted of 13-year-olds. (Year 13 students were again tested, but their results are not reported here.) The testing covered arithmetic, algebra, geometry, descriptive statistics and measurement (
Robitaille and Garden, 1989).
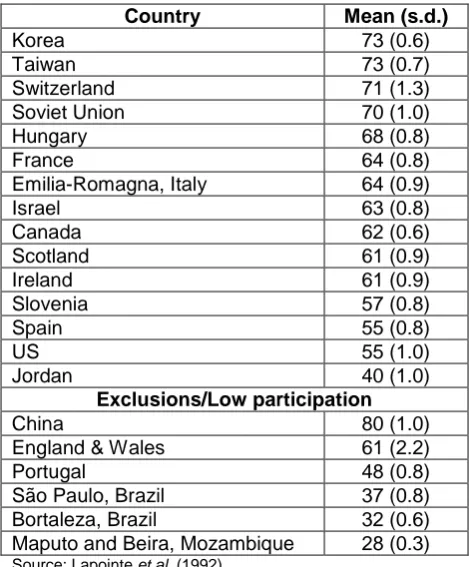
IAEP1, 1988
IAEP1 assessed the mathematics achievement of 13-year-old students (born 1 January to 31 December 1974) in six countries. England, Scotland and Wales all contributed to the UK sample. Sixty-three questions were asked in the test (Lapointe et al., 1989).
IAEP2, 1991
IAEP2 assessed the mathematics skills of samples of 13-year-old students from 20 countries. 75 questions were set (Lapointe et al., 1992).
TIMSS 1995
This study was conducted at five grade levels (including the seventh and eighth grades, UK Years 8 and 9) in more than 40 countries. Students were tested, and extensive information about the teaching and learning of mathematics was collected from students, teachers, and school principals. Altogether, TIMSS tested and gathered contextual data for more than half a million students and administered questionnaires to thousands of teachers and school principals
TIMSS(R), 1999
This study was conducted by the International Study Center at Boston College,
TIMSS 2003
This study collected educational achievement data at the eighth grade (Year 9) to provide information about trends in performance over time, together with extensive background information to address concerns about the quantity, quality, and content of instruction. Approximately 50 countries from all over the world participated
TIMSS 2007
This is the most recent study in this ongoing series (the next is planned for 2011). Again, data were collected on educational achievement at the eighth grade (Year 9), together with extensive background information. A total of 48 countries from all over the world participated (http://nces.ed.gov/timss/table07_1.asp#f4).
PISA 2000, 2006
For details of the samples see above under reading, Section 2.1.3. The basic definition of mathematical literacy for the 2000 survey and later was:
the ability to formulate and solve mathematical problems in situations encountered in life
and a more elaborate definition was also given:
Mathematical literacy is defined as the capacity to identify, understand and engage in mathematics and to make well-founded judgements about the role that mathematics plays in an individual’s current and future private life, occupational life, social life with peers and relatives, and life as a constructive, concerned and reflective citizen. As with reading, mathematical literacy indicates the ability to put mathematical knowledge and skills to use, rather than just mastering them within a school curriculum. Mathematical literacy was assessed through a combination of question types. As with reading literacy, there were a number of texts in which a situation or problem was explained, and then more than one question or task based on the text was presented to students. Various combinations of diagrams and written information were used. Some questions were multiple-choice, but open-ended items were used for assessing higher-order
mathematical processes. PISA measures students’ capacity to analyse, reason, and communicate ideas effectively by posing, formulating, and solving mathematical problems in a variety of contexts. (Gill et al., 2002; see also OECD, 2001)
Both in 2000 and in 2006 mathematics was a minor domain and only sub-samples of pupils took the maths tests. However, their results were weighted to estimate the performance of the full sample. (The mathematics results of PISA 2003, in which maths was the major domain, could not be used for the reason stated under reading, Section 2.1.3.)
2.3.3 Repeated use of standardised tests
Again (cf. under reading, Section 2.1.4), one possible source was not used. In 2004 the children of BCS70 cohort members were also given a number skills test, and the average scores of the different ages of children involved were again compared with those of the original standardisation sample (Bynner and Parsons, 2006: 91–94). At ages 13 and 14, the children’s average scores were about the same as those of the standardisation sample, but at ages 15 and 16 they were slightly lower (Bynner and Parsons, 2006: 94, Figure 6.15). However, these cannot be taken as reliable over-time results either, for the same reasons as given under reading.
Yellis
been taken by nationally representative samples of year 10 pupils (age 14) annually since 1997; data for 1993–2009 were made available to this project (for details see the
Acknowledgments). All items are four-option multiple-choice, and the test is computer-administered and adaptive.
2.3.4 National test results
Overall national results for the KS3 (age 14) maths tests were obtained for 1995 to 2008
when these tests were in operation. The results for 2008 were not used here because the marking problems which occurred in that year (and which led to these tests being
discontinued after 2008) made them insufficiently comparable to earlier results.
Use was also made of a detailed study of the comparability of marking standards in 1996 and 2000 (Massey et al., 2002).
2.3.5 National examination results
The relevant data under this heading are results for GCSE mathematics, which for present purposes has been counted as a numeracy test. As with GCSE English, although people of other ages may take this examination, the published national data relate only to pupils aged 15/16 (see Section 2.2.3 for a slight change in 2005 concerning which pupils were counted as ‘aged 15’) and are aggregated across exam boards, and were therefore usable for this project. Information was obtained for the period 1989–2009, that is, for the entire history of
GCSE from its inception to the present (sources:
various years).
2.3.6 Adult numeracy surveys
Between 1981 and 2003 there were seven national and two international surveys which assessed the numeracy attainment of adults in England, of which four included young people under 20 and gave separate results for a relevant age-group:
•
the ACACE (Advisory Committee on Adult Continuing Education, later the National Institute of Adult Continuing Education, NIACE) survey, 1981•
IALS, 1996•
the International Numeracy Survey, 1996•
the Skills for Life (SfL) survey of need, 2002–03.ACACE, 1981
This survey was carried out by Social Surveys (Gallup Poll) Ltd for ACACE. It attempted to measure the numeracy attainment of a nationally representative sample of adults selected according to ITV regions (ACACE, 1982; Sewell, 1981; Social Surveys (Gallup Poll) Ltd, 1981). However, the instrument used was clearly inadequate – just 11 very simple items.
IALS, 1996
International Numeracy Survey, 1996
This study involved testing people aged 16–60 with 12 numeracy tasks in 7 industrialised countries: Australia, Denmark, France, Japan, Netherlands, Sweden, and the UK. Just under 6,000 people were involved in the study. They were representative of the populations of the participating countries involved. The UK section was carried out by Opinion Research Business on behalf of the Basic Skills Agency (Basic Skills Agency, 1997b).
In the UK the number of people who refused to tackle the tasks at all was higher than in any of the other countries. This may have been, however, for a variety of reasons unconnected with their mathematical skill. The instrument used has been widely criticised for its banality.
The SfL survey, 2002–03
3. Findings
As in Section 2, information is presented first for reading, then writing, then numeracy. However, this section also has a final short subsection on correlations in attainment between literacy and numeracy. There is a good deal of information for reading and numeracy, much less for writing.
3.1 Reading
3.1.1 National monitoring surveys, 1948–88
This is the longest and most comprehensive section of the data analysed in this report. The data for the WV, NS6 and APU series are shown in Tables 3.1–3 respectively. The WV and APU results are for England only; those for NS6 sometimes include Wales. The WV and NS6 results are average raw scores; those for the APU series are average standardised scores.
Table 3.1: Results for Watts-Vernon reading test, age 15, 1948–71, England only
Year
Mean score
Change since previous survey
School types * Sample
size
Sample details 1948 20.79 n/a Maintained and direct grant
grammar
3314 Judgment sample 1952 21.25 + 0.46 Maintained and direct grant
grammar
(not known)
Stratified random 1956 21.71 + 0.46 Maintained and direct grant
grammar
1741 Stratified random 1961a 24.10** + 2.39 Secondary moderns and
comprehensives only
18156 Stratified random 1961b 23.53 (from 1956) +1.82 In principle, all, including
independent schools
c.4400 Sub-sample of NSHD life-time cohort 1971 23.46 (from 1961a) –0.64
(from 1961b) –0.07
Maintained and direct grant grammar
1844 Stratified random
* For this period, maintained schools were grammar, secondary technical, secondary modern and comprehensive schools, whether operated by local education authorities (LEAs) or as ‘voluntary controlled’ or ‘voluntary aided’ schools; ‘voluntary’ schools were mostly church schools. ‘Direct grant’ grammar schools took a minimum of 25%, and in some cases up to 100%, LEA pupils (those who had passed the ‘11+’), and received funding for those pupils direct from the Ministry of Education/ Department for Education and Science, and not from LEAs.
** Estimate for total maintained school population based on the assumption that other schools made the same advance as secondary modern schools between 1956 and 1961.
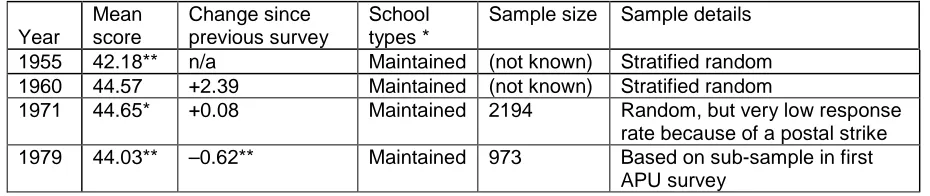
Table 3.2: Results for NS6 reading test, age 15, 1955–79
Year
Mean score
Change since previous survey
School types *
Sample size Sample details 1955 42.18** n/a Maintained (not known) Stratified random 1960 44.57 +2.39 Maintained (not known) Stratified random
1971 44.65* +0.08 Maintained 2194 Random, but very low response rate because of a postal strike 1979 44.03** –0.62** Maintained 973 Based on sub-sample in first
APU survey
* For the definition of maintained schools see footnote to Table 3.1. In 1971 direct grant grammar schools were also included, to allow direct comparison with the simultaneous WV survey. However, the scores shown are for maintained schools only; the scores including direct grant grammars were almost exactly the same (mean = 44.96).
** Mean and change scores for England AND Wales. Given that over 90% of the population of the two countries lives in England, the figures are probably valid for England alone.
Notes: (1) The sample sizes for 1955 and 1960 could not be retrieved from the literature. (2) The rise from 1955 to 1960 is known from the literature to have been statistically significant, and the changes from 1960 to 1971 and from 1971 to 1979 to have been statistically non-significant.
At this distance in time perhaps the most interesting fact about the 1971 results is the reaction to the small drop in the mean score on the WV test relative to the 1961a survey. Despite the difference being statistically non-significant (and the non-significant rise on NS6 and the obviously non-significant fall from the 1961b survey) a considerable moral panic over ‘falling standards’ ensued, fuelled to an extent by the presentation of the results in Start and Wells (1972) in a graph with a grossly truncated and therefore misleading y-axis scale. However, the positive outcome was the setting up of the Bullock Committee, whose report in turn led to the setting up of the APU.
Table 3.3: Results for APU reading tests, age 15, 1979–88, England only, pupils with English as 1st language only
Year Mean score 1979 99.7 1980 99.6 1981 99.8 1982 100.1 1983 99.9 1988 100.6
None of the differences were statistically significant.
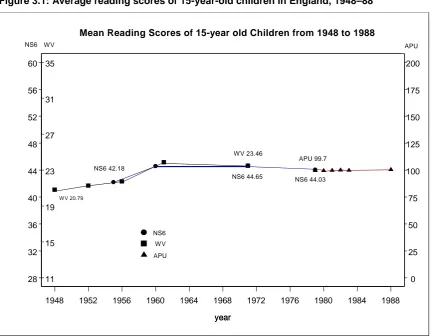
It proved possible to display the data from all three series of surveys on one graph (Figure 3.1). This is because most of the pupils in the 1971 survey took both the WV and the NS6 test, and a sub-sample of those in the 1979 survey took both NS6 and a subset of the APU tests. It was assumed that the average scores for WV and NS6 in 1971 could be treated as equivalent and made to coincide, despite their different score scales; and a parallel
Figure 3.1: Average reading scores of 15-year-old children in England, 1948–88
Scores below the baseline values of 11 and 28 for WV and NS6 respectively (on the left y-axis) could not be calibrated with the APU scale (on the right). Very few pupils scored below those marks, and in any case a score of less than 11 on the WV was described (in earlier and less PC days) as indicating ‘illiteracy’.
Figure 3.1 shows a general increase in attainment from 1948 until 1960/61 and then
effectively no change for the rest of the period examined. It is widely thought that there was a decline in standards due to the Second World War and that this took some years to rectify afterwards; see, for example, Start and Wells (1972) and Hurry (1999). The virtually flat line from 1960 to 1988 is striking.
3.1.2 International surveys, 1960–2006
The IEA surveys, 1960 and 1971
Given that national surveys were also going on at the time, 1960–61 and 1971 were busy years for reading surveys in schools.
Because different tests were used on the two occasions, the international survey results do not permit calculation of a trend over time. However, some findings of interest emerge from the ranking data, and from the distribution of scores. Though there were problems of sampling in some countries, the 1960 study placed the average scores of the age 13/14 (Year 9) pupils in the 12 participating countries in the following order: Yugoslavia, Scotland, Finland, England and Wales, United States, Switzerland, West Germany, Sweden, France, Israel, Belgium, Poland (Foshay, 1962). The 1971 study produced the following rank orders for the two relevant ages (Thorndike, 1973):
Age 13/14 (Year 9) Age 15/16 (Year 11) year
1948 1952 1956 1960 1964 1968 1972 1976 1980 1984 1988 11 15 19 23 27 31 35 year 28 32 36 40 44 48 52 56 60 year 0 25 50 75 100 125 150 175 200
Mean Reading Scores of 15-year old Children from 1948 to 1988
NS6
WV
APU
NS6 WV APU
New Zealand New Zealand
Italy Scotland
United States England & Wales Belgium (French-speaking) Netherlands
Finland Finland
Scotland Belgium (French-speaking)
Sweden Sweden
Hungary Israel
England & Wales Belgium (Flemish-speaking) Netherlands Italy
Belgium (Flemish-speaking) Hungary
Israel United States
Chile Chile
Iran Iran
India India
On its own, the position of England and Wales in the 1971 age 13/14 list could have been seen as slippage from the 1960 position, but the higher placing at age 15/16 suggests that it was a cohort effect.
Inspection of the distribution of scores reveals another point of interest. Even in the 1960 study it was noted that England and Wales had ‘by far the largest dispersion of test scores’ (Pidgeon, in Foshay, 1962, p.59), with Scotland close behind. In the 1971 study, the
standard deviation for England and Wales was among the largest at age 13/14 (though not at age 15/16). Pidgeon had a theory on this in 1962:
The general aim of the grade class teacher may tend to result in a relatively smaller dispersion. Perhaps exerting a greater influence, however, is the belief a teacher may have that innate ability is of paramount importance in determining the level of attainment to be expected from a child. Streaming by ability, which is viewed as an administrative device resulting from the acceptance of this belief, will merely tend to enhance its effects. When all these factors act in the same direction the effect will clearly be greatest and this is what happens in England. Here, it is claimed, the aims and, more especially, the beliefs of most teachers and educational administrators lead them to expect wide differences in performance, and this is what is therefore achieved. Where, on the other hand, the grade placement system operates and especially where, within such a system, teachers do not attempt to measure innate ability and therefore do not expect their pupils’ attainments to be matched to it, then the dispersion of achievement will be much less. (Pidgeon, in Foshay, 1962, pp.61–62)
In other words, low expectations of some children contribute to their low achievement; and in this respect very little seems to have changed in British education. If this expectation effect is true, it would seem to imply a ‘devil take the hindmost’ attitude, possibly rooted in Britain’s class structure, and a need to counteract this by concentrating special help on those most in need.
PISA 2000, 2006
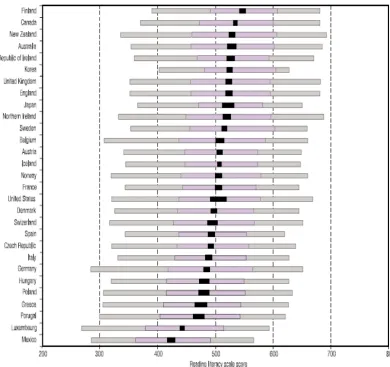
Figure 3.2: Reading attainment of 15-year-olds in PISA 2000
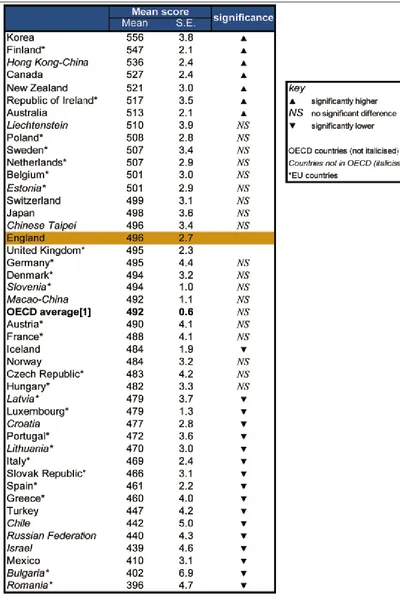
Figure 3.3: Reading attainment of 15-year-olds in PISA 2006
The authors of the 2000 report for England commented:
The proficiency in reading … literacy of 15-year-olds in England compares well with that of young people of the same age in other countries. Students in England scored an average of 523 points on the reading literacy scale, significantly higher than students in OECD countries as a whole, where the mean score was set at 500. English students were at a similar level of achievement as those in, for example, Australia, Japan and Sweden. Countries with lower average achievement than England included France and Germany, and in only two countries, Finland and Canada, did 15-year-olds do
significantly better than in England. (Gill et al., 2002)
No statistical comparison between the 2000 and 2006 mean scores for the UK was given in either the 2006 international report or the 2006 national report for England, apparently because the OECD (2007, p.325, note 4) retrospectively declared the 2000 result unreliable. It is therefore not possible to state whether the fall of 27 points in England’s mean score between the two surveys was or was not statistically significant.
However, it may be possible to address the question of a trend over time in a rough-and-ready fashion by considering rank orders. At age 15/16 England and Wales were 3rd out of 15 countries participating in 1971, the UK (and therefore probably England because the ‘United Kingdom’ sample was largely from England) was 7th out of 27 in 2000 – see Figure 3.2, and England was 17th out of 57 in 2006 – see Figure 3.3. The 2006 international report (OECD, 2007, Figure 6.8b, p.298) estimated that the UK’s rank was between 11th and 16th of the 30 OECD countries (all OECD countries took part), and between 14th and 22nd among all 57 participating countries. Given the increased number of countries participating in 2000 and 2006, these placings are probably roughly equivalent, and therefore consistent with the level graph from 1970 onwards in the national data.
3.1.3 Repeated use of standardised tests, 1997–2009
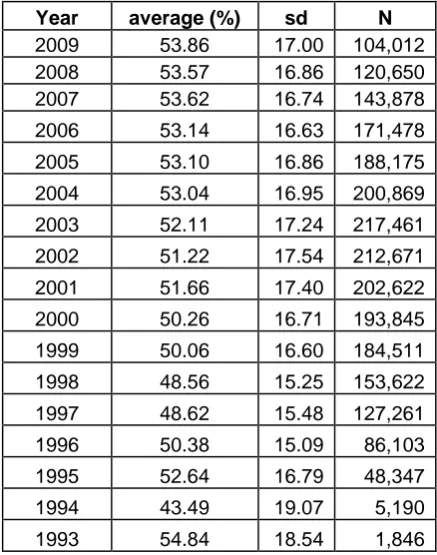
The results for the Yellis vocabulary test taken by pupils in Year 10 (age 14) 1993–2009 are shown in Table 3.4. Details of the test itself are at
Table 3.4: Average Yellis vocabulary scores, 1993–2009 Year average (%) sd N
2009 53.86 17.00 104,012 2008 53.57 16.86 120,650 2007 53.62 16.74 143,878 2006 53.14 16.63 171,478 2005 53.10 16.86 188,175 2004 53.04 16.95 200,869 2003 52.11 17.24 217,461 2002 51.22 17.54 212,671 2001 51.66 17.40 202,622 2000 50.26 16.71 193,845 1999 50.06 16.60 184,511 1998 48.56 15.25 153,622 1997 48.62 15.48 127,261 1996 50.38 15.09 86,103 1995 52.64 16.79 48,347
1994 43.49 19.07 5,190
1993 54.84 18.54 1,846
NB – The Yellis test changes only by one or two questions (of 120) each year, based on statistical analysis.
3.1.4 Adult literacy surveys, 1996–2003
International Adult Literacy Survey (IALS), 1996
Results for the prose and document literacy domains are shown in Table 3.5. Note that the numbering of IALS and UK National Qualifications Framework levels is out of step by one.
Table 3.5: IALS prose and document literacy results by age group, England only
Age-group 16–25 26–35 36–45 46–55 56–65 Total IALS
level
Sample size 372 1172 928 2472
UK NQF level
% % % % % %
Prose literacy
3/4/5 Level 2 or above 52 54 54 49 24 48
2 Level 1 30 29 29 29 37 30
1 Entry level 17 18 17 22 39 21
Document literacy
3/4/5 Level 2 or above 56 56 58 48 27 51
2 Level 1 26 25 24 28 33 26
1 Entry level 18 19 18 24 40 23
Source: Carey et al. (1997)
The authors of the report for Britain (and these remarks apply fully to England) commented:
It should also be noted that these results were the major source of the Moser Committee’s estimate (GB. DfEE, 1999) that about 20% of adults in England (roughly 7 million people) had less than functional literacy, where the minimum level of functional literacy is defined as Level 1, and ‘less than functional literacy’ therefore as Entry level. However, in the youngest age-group slightly fewer than 20% were in Entry level.
The Skills for Life (SfL) survey of need, 2002/03
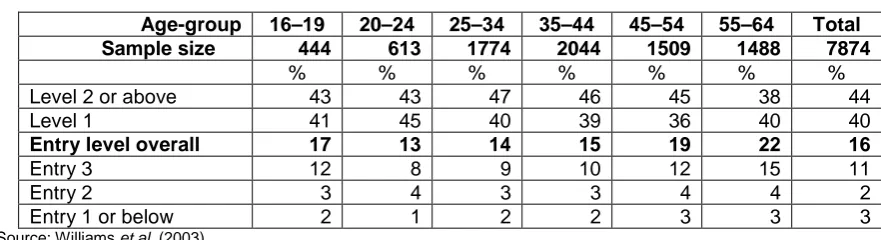
This survey treated literacy as a single domain. Results by age-group are given in Table 3.6. The survey also gathered data on participants’ qualifications; though not presented here, these data are commented on in the quotation below the Table.
Table 3.6: Skills for Life survey results for literacy, by age group
Age-group 16–19 20–24 25–34 35–44 45–54 55–64 Total Sample size 444 613 1774 2044 1509 1488 7874
% % % % % % %
Level 2 or above 43 43 47 46 45 38 44
Level 1 41 45 40 39 36 40 40
Entry level overall 17 13 14 15 19 22 16
Entry 3 12 8 9 10 12 15 11
Entry 2 3 4 3 3 4 4 2
Entry 1 or below 2 1 2 2 3 3 3
Source: Williams et al. (2003)
The authors of the report commented:
There were large differences in educational achievement between the various age-groups. Younger respondents were much more likely to hold qualifications than older respondents. Around 10 per cent of respondents under the age of 35 held no
qualifications at all but this proportion climbs steadily with each subsequent age group: 16 per cent of 35- to 44-year-olds, 27 per cent of 45- to 54-year-olds and 41 per cent of 55- to 65-year-olds held no qualifications. However, the relatively flat age data for literacy test performance suggests that the difference between age groups in underlying ability was minimal. The sharp increase in qualification acquisition since the war – particularly in the 1960s and 1970s – has not led to a sharp increase in literacy skills. (Williams et al.,2003)
Williams et al. could equally have put the last point the other way round: the ‘sharp increase in qualification acquisition since the war’ has been achieved despite a generally steady level of underlying reading skills (for a related point about writing see Section 3.2.5). That could be interpreted as meaning that test demands have fallen – but Section 4 shows that this is not the case; more positively, it could be taken to show that young people have increasingly learnt how to give of their best under test/examination conditions, which in turn implies that their teachers have improved their preparation of pupils to take the tests/exams.
Also, what Williams et al. did not remark on is that these data also show an increase in low skills in the oldest age-group, though not as sharp as in the IALS data, and a decrease in the percentage with low skills from 16- to 19-year-olds to the next age-group. Both are
compatible with a ‘lifecourse’ trend in attainment, namely that literacy skill increases in early middle age (perhaps as a result of honing the skills needed in employment), then plateaus for some decades, then declines again. A similar pattern was apparent across the age-range 22 to 74 in the results of the Older and Younger survey conducted in 1993–94 (Basic Skills Agency, 1995).
[image:33.595.73.514.220.340.2]same ‘inverted U-shape’ graph appears in surveys conducted years apart argues against this interpretation.
Another finding which supports the lifecourse theory is this. In 1972, a sub-sample of the NSHD cohort who had taken the Watts-Vernon reading test in 1961 when they were aged 15 (see Section 3.1.1) took it again, at the age of 26. The results showed ‘a substantial general increase in reading scores’ over the 11-year gap, and an ‘illiteracy rate … as low as one per cent’; the corresponding ‘illiteracy rate’ for these same people at age 16 had been 3.5 per cent (Rodgers, 1986).
3.1.5 Conclusions on trends in reading attainment
•
There was an improvement in average reading scores from 1948 to 1960.•
Average levels remained remarkably constant from 1960 to 1988.•
There is a gap in the evidence base from 1988 to about 1997.•
The Yellis data suggest a gentle rise between 1997 and 2004, then a further plateau.•
There was a fall in the average score between the two PISA surveys of 2000 and 2006, but it is not known whether this was statistically significant.•
But the proportion of young adults with poor reading (Entry level) seems to have remained stubbornly at about 17%. The lifecourse trend (improvement into early middle age, then usually a plateau, then decline) will have lifted some people into adequate literacy levels by their early to mid 20s, but many still have poor literacy at all later ages.3.2 Writing
3.2.1 National monitoring surveys, 1979–88
There were none before 1979, and results for the APU writing surveys were not (and could not have been) expressed, like those for reading, as average standardised scores. However, results for repeated tasks are given in the various reports, especially those for 1979, 1983 and 1988. These show quite clearly that there had been no overall change in the average level of attainment in writing of Year 11 pupils in England in that period.
Brooks et al. (1993) analysed attainment in spelling in samples of repeated writing tasks undertaken by Year 11 pupils in 1980 and 1983. The level of attainment in spelling was the same in both years.
3.2.2 National test results, 1995–2007
The results for KS3 English 1995–2007 are shown in Table 3.7 and Figure 3.4. Both versions of the data show that the curve moved steadily to the right, that is, towards higher overall levels. The headline figure for this age-group is the percentage achieving Level 5 or above, which rose from 55% to 74% in this period, a substantial increase of 19 percentage points.
those achieving Level 5 or above in that period was genuine, and not caused by drift in markers’ expectations or award of grades.
Table 3.7: KS3 English results, 1995–2007
National Curriculum levels (%)
Below 4 4 5 6 7 & 8 5 or above
2007 12 13 41 25 8 74
2006 13 14 38 25 10 73
2005 13 13 39 26 9 74
2004 14 15 37 24 10 71
2003 14 16 34 24 10 68
2002 14 19 34 22 11 67
2001 15 19 32 23 9 64
2000 15 20 35 22 7 64
1999 16 20 36 21 7 64
1998 16 19 30 25 10 65
1997 17 27 34 17 6 57
1996 20 23 31 18 8 57
1995 17 28 35 16 4 55
Figure 3.4: KS3 English results, 1995–2007
English Key Stage 3 Test Results 1995-2007
0 5 10 15 20 25 30 35 40 45
A & B4 4 5 6 7 & 8
Level P ercen tag e o f P up ils Ach ievi ng L evel 2007 2006 2005 2004 2003 2002 2001 2000 1999 1998 1997 1996 1995
Source: Based on preceding table
3.2.3 National examination results, 1989–2009
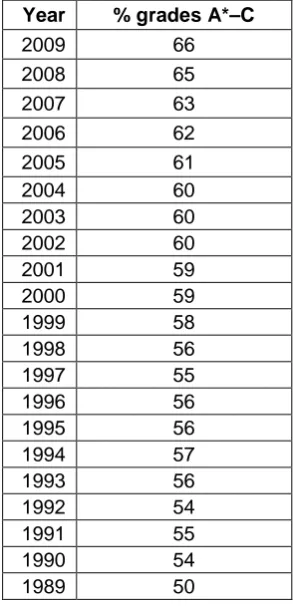
The results for GCSE English (Language) for the period 1989–2009 are shown in Table 3.8. For notes on the numbers and age of the pupils involved, see Section 2.2.3. The proportion of the cohort taking GCSE English (Language) rose over the period from 88% to 95%, thus making the results very representative of the full population of Year 11 pupils. The
Table 3.8: GCSE English results, 15-year-olds, England only, 1989–2009 Year % grades A*–C
2009 66
2008 65
2007 63
2006 62
2005 61
2004 60
2003 60
2002 60
2001 59
2000 59
1999 58
1998 56
1997 55
1996 56
1995 56
1994 57
1993 56
1992 54
1991 55
1990 54
1989 50
Sources:
A study of examination standards in GCSE English between 1989 and 1995 (SCAA, 1996) was carried out jointly by Ofsted and SCAA (the (then) Schools Curriculum and Assessment Authority, later merged into the Qualifications and Curriculum Authority, QCA, now the Qualifications and Curriculum Development Agency, QCDA). The study concluded that there was little evidence of any significant change in examination standards (criteria) in that period. This suggests that the rise of six percentage points in those achieving grade C or above in that period was genuine and not caused by grade drift.
3.2.4 Analyses of examination scripts, 1980–2004
Since the first of the three relevant studies (Massey and Elliott, 1996) was later extended it is dealt with below.
QCA (2004) found no change in standards of attainment in GCSE English in the period 1999–2002. This largely confirms the findings from the overall exam grades, above.
Massey and Elliott (1996) took samples of age 16 English examination scripts from 1980 (GCE O-Level), 1993 and 1994 (GCSE), and Massey et al. (2005) added GCSE scripts from 2004. For each exam they analysed a similar question (across years) from the scripts of 30 boys and 30 girls. The question was a composition of some kind (a story or opinion). The fourth sentence was taken from each script, and the sentences were compared using five criteria:
1. vocabulary
2. spelling
4. sentence structure
5. use of ‘non-standard’ structure.
Massey and Elliott (1996) argued that, using the above criteria, quantitative analysis was possible, whereas a qualitative analysis (e.g. of imagination, content and style) was impossible without further evidence.
All samples were taken from exam scripts rather than coursework because for the latter more time and help would have been available (and in 1980 there was no coursework). No CSE scripts from 1980 were analysed, so comparison with all grades of GCSE was also
impossible.
Massey and Elliott (1996) concluded that (1) they could not validly compare the content, structure and stylistic qualities of the scripts over time because the form of the paper and the task demands had changed too much; (2) they could, however, validly compare the technical aspects; (3) on these, candidates in 1980 seemed rather more accomplished than those in 1993 and 1994; but (4) the researchers ‘therefore lack[ed] sufficient empirical evidence to conclude safely that, overall, writing in 1980 was better, grade for grade, or that grading standards … ha[d] changed.’
The results of the extended study showed that, while 1993 and 1994 were relatively poor years, th