Prediction and Measurement of Electron Density
and Collision Frequency in a Weakly Ionised Pine Fire
Kgakgamatso Mphale&Mohan Jacob&Mal. Heron
Received: 1 November 2006 / Accepted: 1 February 2007 / Published online: 1 March 2007
#Springer Science + Business Media, LLC 2007
Abstract Pine litter flame is a weakly ionised medium. Electron-neutral collisions are a dominant form of particle interaction in the flame. Assuming flame electrons to be in thermal equilibrium with neutrals and average electron-neutral collision frequency to be much higher than the plasma frequency, the propagation of microwaves through the flame is predicted to suffer signal intensity loss. A controlled fire burner was constructed where various natural vegetation species could be used as fuel. The burner was equipped with thermocouples and used as a cavity for microwaves with a laboratory quality network analyzer to measure wave attenuation. Electron density and collision frequency were then calculated from the measured attenuation. The parameters are important for numerical prediction of electromagnetic wave propagation in wildfire environments. A controlled pine litter fire with a maximum flame temperature of 1080 K was set in the burner and microwaves (8–10.5 GHz) were caused to propagate through the flame. A microwave signal loss of 1.6–5.8 dB was measured within the frequency range. Based on the measured attenuation, electron density and electron-neutral collision frequency in pine fire were calculated to range from 0.51–1.35×10¹⁶m−3and 3.43–5.97×10¹⁰s−1respectively.
Keywords Wildfire . Microwave attenuation . Weakly ionised gas . Chemi-ionisation . Thermal ionization
K. Mphale (*)
Physics Department, University of Botswana, P/Bag 0022, Gaborone, Botswana e-mail: kgakgamatso.mphale@jcu.edu.au
M. Jacob
Electrical and Electronic Engineering Department, James Cook Univeristy, Townsville QLD 4811, Australia
e-mail: mohan.jacob@jcu.edu.au
M. Heron
1 Introduction
The absorption of energy by electrons in the flame may results in a considerable signal intensity loss for microwaves propagating it. When the weakly ionised flame medium is illuminated with electromagnetic energy, electrons are accelerated by the electric field of the incident waves. Assuming that interaction between electrons and neutrals is elastic, the neutrals gain little kinetic energy during collisions mainly because they are relatively massive. Electrons are scattered isotropically such that the average velocity after collision is zero. In this way energy is transferred from the microwaves to the flame.
Weakly ionised gases at atmospheric pressure can effectively absorb microwaves. The absorption rate is directly related to Ne=υeff; where Ne is electron density and υeff is
momentum transfer collision frequency [1]. Several studies have taken advantage of the effect and determined ionisation and momentum transfer collision frequency in flames and hot vapours, e.g., Smith et al., [11], Belcher et al., [12], Shuler et al., [13] and Sturgeonet al., [14]. Belcheret al.[12] studied the absorption of centimetric waves in a 1.45 cm wide alkali seeded coal gas-air flame at 2200 K. From the absorption measurements, Belcheret al.[12] determined collision frequency and electron density to be 8.8×10¹⁰s−1and 2.0×10¹⁷m−3respectively. Smithet al., [11] carried out a very similar experiment but with hydrogen-air flames at a temperature range of 1900–2000 K. Using electrodynamical theory, Smithet al., [11] calculated electron density to range from 0.8– 1.5×10¹⁷m−3in the flames. Comparatively, clean unseeded flames contain lower ionisation than seeded flames. E.g., Adler, [15] conducted an experiment in which radio waves were caused to propagate through pure jet fuel flames at a temperature of 1920 K. Using propagation theory, [15] observed ionisation and collision frequency of 1.9×10¹²m−3and 6.5×10⁸ s−1 respectively. Shuler et al. [13] also performed a microwave propagation experiment on unseeded lean hydrogen-oxygen flames at adiabatic temperatures which ranged from 2400–3000 K. Electron density in the hydrogen-oxygen flames ranged from 2.5–3×10¹⁵m−3and average momentum transfer collision frequency was determined to be 2.6×10¹¹s−1.
Based on studies by [1, 2,11–14], microwave communication efficiency on wildfire grounds, where adiabatic flame temperatures could be up to 1900°C, may be impaired by the weakly ionised environment. Strong microwave attenuation is anticipated to occur at very hot regions of the fire [3, 4]. Active remote sensing devices such as radars at microwave frequencies are used to detect large scale fires. In very high intensity wildfires (90 MWm−1) with electron densities up to 1018m−3, flame dielectric constants are low. This may significantly attenuate reflected radar signals.
Propagation test have been carried out in wildfire environments. In the experiments, signals were caused to propagate above fire. As consequence, no significant attenuation was observed. The experiment investigates microwave propagation at a very hot and weakly ionised region of a pine fire with emissive power of 62 KWm−2. Signal attenuation was measured using a 2-port Vector Network Analyser (VNA). Flame electron density and electron-neutral collision frequency were then calculated from the s-parameter determined attenuation.
2 Ionisation In The Flame
then thermally ionised to produce electrons and ions on selective basis determined by temperature and ionization potential. Particles that appreciably thermally ionise in the flame are alkalis and graphitic carbon (Cn) owing to their low ionisation potential and work function of 4.34 and 4.35 eV respectively [5]. Thermal ionisation of flame species (P(g)) occurs by the following reaction equation:
P gð Þ ,Pþð Þ þg e ð1Þ
Another possible mechanism by which significant ionization may occur in vegetation fuel flames is chemi-ionisation (e.g., in [6]). In the process, dissociation reactions provide part of the energy required for ionization since there are exothermic and the rest is from the flame. Exited methyl radical CH* is a known contributor to chemi-ionisation in flames eg. in Sorokinet al.[6]. CH radical reacts with oxygen atoms in the flame to produce CHO+, a primary ion in hydrocarbon flames [7] and electrons according to the following reaction equation:
CH*þO,CHOþþe ð2Þ
3 Prediction of electron density and collision frequency
3.1 Estimation of electron density in the fire
During combustion, volatiles are released from the vegetation’s organic matrix and drawn into the combustion zone of the fire by convective currents. Potassium species form a large fraction of ionisable particulates in the volatiles. Potassium compounds are first decomposed into respective atoms and the later species are ionized upon excitation. Potassium atoms also exist in the volatiles. The atoms result from radical or hydrogen reduction of potassium-charcoal (K-O-C) complex [18]. If only atoms of potassium are considered and temperature together with other physical properties of the fire are averaged over the whole burner volume, then the mass of potassium drawn into the flame with the volatiles per a unit time (Pmass) can be given by the relation;
Pmass¼
Kp:Vf
Vv
kg
ð Þ ð3Þ
where Kp is percentage of potassium in vegetation on dry weight basis while Vf and Vv
represent volatile flux and vertical velocity respectively. The number of potassium atoms (μ) swept into a unit volume V in a unit time is
2¼Pmass:Av
0:03903 ðatomsÞ ð4Þ
where Av=6.02×10²³(Avogadro number).
Flame electron density (Ne) can be estimated to be [19];
Ne¼ K1Np
1=2
1þ K1 4Np
1=2
K1
4Np
1=2
" #
where KIis ionisation equilibrium constant and Npis the total number of ionised potassium
particles given by;
Np¼7:3351027:2=T m3
ð6Þ
The ionisation equilibrium constant for ionisation (KI) is given by Saha equation as;
KI¼
2Pmþint
Pm int
2::MekT
h2
3=2
exp ð ÞEi kT
ð7Þ
where Pmint and Pmþint are internal partition function of particles; Ei, Me, k and h are
ionization energy, mass of an electron, Boltzmann and Plank constants respectively.
3.1.1 Typical calculation of electron density in a pine fire
Consider a high efficiency pine needle fire (99% combustion efficiency). Also consider the needles to have average potassium content (Kp) of 1.0% of their dry weight. Vertical velocity
and flux of volatiles from combustion pine needles could be taken as 5 ms−1and 0.1 kgms−2 respectively as in Clark et al. [20]. If 5% percent of the inherent potassium species are ionisable atoms and are drawn together with other volatiles into the combustion zone at an average temperature of 1100 K, then the overall percentage of potassium at in the volatiles is 0.05%. Assuming that most of the potassium in the flame is that which is emitted as atoms from radical reduction of K-O-C complex then mass of potassium per unit volume per unit time (Pmass) as calculated from (3) is 1.0×10⁻⁵kg. The number of potassium atoms swept into the
unit volume (μ) is calculated from Equation (4) as 1.542×10²⁰atoms. The partition function of potassium ion and atom at the temperature is 1 and 2 respectively. The mass of electron and ionisation potential of potassium are 9.1×10⁻³¹kg and 4.34 eV respectively. Plank and Boltzmann’s constants are 6.64×10⁻³⁴Js and 8.617×10⁻⁵eVK−1. Substituting the parameters into (7) gives KI. The value of KI is then used with the value of Np to calculate electron
density according to (5). In this case, electron density is calculated to be 1.32×10¹⁶m−3.
3.2 Estimation of flame electron-neutral collision frequency
The momentum transfer collision frequency (υ) of the fire plume could be estimated from the expression [12]:
υ¼P:d2: : 2:k:MeT
1=2
ð8Þ
where P and d are pressure and air molecule diameter respectively. Other parameters are as defined earlier. Diameter of air molecules varies from 0.2–0.3 nm. Using Equation (8) for a fire which is at atmospheric pressure, flame collision frequency is estimated to range from 4.26–9.59×10¹⁰s−1.
4 Flame propagation constant
Propagation constant (+) of a dielectric medium such as the weakly ionised flame is given by the following relation:
whereαfandβfare attenuation and phase constants. When x-band microwaves illuminate
weakly ionised, highly collisional atmospheric pressure flame plasma,!fandβfare related
to electron-neutral collision frequency (ϕeff) and ionisation by the expressions:
!f ffiϕeff
2c
52 p 52þϕ2
eff
" #
ð10Þ
and
"f ffi5
c 1þ
54 p
8 52þϕ2 eff
2
ϕ2 eff 52
" #
ð11Þ
where5and c are propagation cyclic frequency and speed of light in vacuum respectively.
5 Experimental set up
5.1 VNA system and combustion fuel
The equipment used to measure the microwave absorption by the flames consists of a hexagonally shaped burner with an insulated wooden casing, a Hewlett-Packard 8577 C VNA with x-band horns and a computer. To the inside of the burner, a thick (8 cm wide) thermally insulating material known as Fiberflex® was used to protect wood from the fire and heat. The material was lined to form a combustion area that is circular in base cross section. Two vent holes of 25 mm diameter were drilled on each of the sides, except the ones with horn inlets, to allow air to enter and mix with fuel during combustion. Two holes of horn dimensions were also cut out from the burner casing directly opposite to each other and wooden supports were provided to secure the horns firmly to the wooden casing. The internal diameter of the burner was lined up with Fiberflex® was set to 50 cm. Adding to or slightly reducing the insulating material varied the propagation path length. Two x-band transmit-receive horns were used in the experiment. They were connected to VNA through the two-port s-parameter test set by coaxial cables. High quality mode transition adapters were used to make the connections between coaxial cables and the horns. The set up is shown in Fig.1.
A pine litter of bulk density of 4.92 kgm−3 was collected ten (10) days before the experiment and left to dry in a laboratory to maximise combustion efficiency during burning.
5.2 Flame temperature measurement
5.3 S-parameter measurements
The 8577C VNA set is designed to sweep from 50 MHz to 40 GHz and logging in 601 s-parameter data points in each and every sweep. The data can then be uploaded and analysed by the computer. The analyzer takes 2 s to sample over one sweep, and then there is a latency of about 50 s before the next sweep can be initiated. Before the VNA was used it was calibrated first. The calibration method used in the experiment was the Transmit-Reflect-Line (TRL). Varadanet al.[8] give a full account of calibrating a network analyser using TRL method. However, for the experiment, the frequency range of interest was between 8 and 10.5 GHz. Several sweeps and logging of s-parameters were carried, but those for which flames filled the entire internal hollow space of the burner were chosen for s-parameter analysis. The selected logged in s-parameters were those at AS1, AS2, AS3 and AS4, which corresponded to the times 72, 135, 217 and 274 s since ignition.
5.4 Determination of propagation constant from s-parameter
The VNA measures the scattering parameters (s-parameters) from which the propagation constant can be calculated. From the s-parameters analysis, propagation constant is related to the propagation factor (T) by the relation:
+¼½ln 1ð =TÞ=d ð12Þ
where d is the length of the path traversed by the electromagnetic beam through the flame. S-parameters (S11 and S21) determined from the VNA are then used to calculate
propagation factor using the relation;
T¼ S11þS21* 1ðS11þS21Þ*
ð13Þ
[image:6.439.163.392.55.273.2]whereΓis reflection coefficient , which is given by the relation:
*¼4pffiffiffiffiffiffiffiffiffiffiffiffiffiffi421 ð14Þ
where 4¼ S211S 2 21þ1
2S11
. The sign in (14) is chosen so that |Γ|<1. With T determined from s-parameter using the network analyser, the propagation constant+can be worked out from (12). Then!fandβfare determined from (12) as they are real and the imaginary parts
of propagation constant (+).
5.5 Determination of collision frequency and electron density
The inverse of the real part of propagation constant determined from s-parameters is used graphically to determine collision frequency and electron density of the pine flame between the times AS1 and AS4 since ignition.
5.5.1 Collision frequency
Inverting equation (10) gives;
1
!f ¼
ς 52þϕ2 eff
ϕeff ð15Þ
Where; ς¼2c w2
p; 5
2 p¼ Ne
2
me0 and e0 are the plasma collision frequency and free space
permittivity. A plot of 1
af versus5
2 gives a linear function where (ς/ϕeff) is the gradient
(grad.) and ςϕeff is the ordinate (ord.) at zero abscissa of the graph. Electron-neutral collision frequency (ϕeff) is calculated from grad. and ord. as:
ϕeff ¼ ord:
grad:
1=2
ð16Þ
5.5.2 Electron density
Electron density in the flame is calculated from the relation:
N¼ 2cm:e0 q2
e
1
ffiffiffiffiffiffiffiffiffiffiffiffiffiffiffiffiffiffiffiffiffiffiffiffi
grad:ord:
p ð17Þ
6 Experimental results and discussions
6.1 Flame temperatures
temperatures during the experiment are shown in Fig.2. The litter surface temperature rose rapidly to reach a maximum of 1081 K in 76 s. This was 4 s after the first set s-parameters (AS1) were logged in. At AS1, the temperature of the litter surface was 1075 K. After reaching the climax, the surface temperature dropped steeply, though not as quickly as it raised from ignition, to AS2, a second log in point where the pine litter flame filled the inner hollow of the burner. AS2 is at 135 s from ignition. At AS2, the pine litter surface temperature was observed to be 878 K.
Several s-parameter were logged in since AS2, but those selected for analysis were logged in at AS3 and AS4 corresponding to 217 and 274 s since ignition respectively. Surface temperature at AS3 and AS4 are 728 and 646 K respectively.
6.2 Microwave attenuation
Microwave propagation through the hottest part of the flames suffered a significant signal intensity loss. Before the fuel in the burner was set alight (no flame condition), VNA-burner system was checked for a systematic signal loss. An average systematic loss of the VNA-burner system was found to be 7.2 dB. Attenuation measurements at AS1 to AS3 for microwave frequencies (8–10.5 GHz) are shown in Fig.3. The flame at AS1 was the most intense and it caused a signal loss of 5.68–3.70 dB for frequency range respectively. At AS2, 8–10 GHz microwaves incurred a signal loss of 3.17-1.94 dB respectively while the cooler flame at AS3 imposed signal intensity loss of 2.38-1.64 dB for the frequency range respectively. As it can be observed from Fig.3, flame temperature plays a significant role in microwave absorption in the burner. A very hot flame imposes strong microwave absorption. High temperatures cause a significant ionization of incumbent flame particles. The effect could be amplified by the presence of alkali species in the flame, which is true for the combustion of vegetative matter. Plant matter contains up to 3.4% element potassium on dry weight basis. During combustion of plant matter, potassium species are released from a thermally crumbling plant structure and convectively drawn into the combustion zone of the fire. High temperature cause thermal dissociation of potassium
[image:8.439.164.392.424.609.2]species as they have low dissociation energies. Vodaceket al.[9] estimate that 10–20% of potassium in vegetation is ionized in fires. This makes vegetation fires a weakly ionized environment with the capability of causing significant microwave absorption at the most intense regions of the fire.
6.3 Electron density and collision frequency during flaming
At AS1, the gradient of the plot was 4.09×10⁻²²(see Fig.4) and the ordinate was observed to be 4.81×10⁻¹. The gradient and ordinate values gave electron density and collision frequency for the pine litter flame to be 1.35×10¹⁶m−3and 3.43×10¹⁰s−1.
At AS2, the gradient and the ordinate for the pine litter flame was 7.25×10⁻²²and 9.20× 10⁻¹. The gradients and ordinate gave calculated electron density and collision frequency as 7.33×10¹⁵m−3and 3.56×10¹⁰s−1. The gradient and ordinate for cooler flames at AS3 and AS4 gave electron density and collision frequency as: 5.41×10¹⁵m−3and 5.75×10¹⁰s−1; and 5.13×10¹⁵m−3and 5.97×10¹⁰s−1respectively.
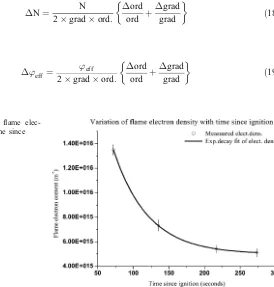
The general behaviour of electron density in the combustion of pine litter, thus from AS1 to AS4, was that it decayed exponentially with time from a near maximum to a low value of 5.13× 10¹⁵m−3(see Fig.5). The measured data fitted exponential decay function of the first-order in the form: N¼N0þA exp tx , where No is near maximum electron concentration, A and ×
are flame dependent parameters. The variable t is time.
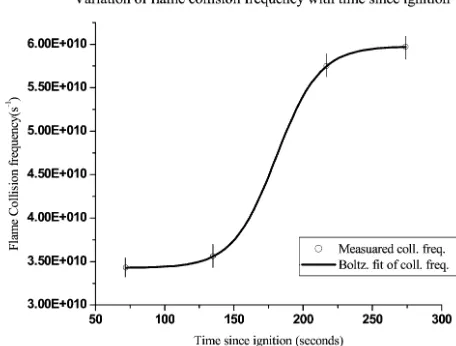
Electron-neutral collision frequency was observed to increase rapidly with the decrease in flame temperature (see Fig. 6). The influx of cool ambient air nitrogen dilutes combustion gas, which in effect increases neutral gas concentration in flame. This increases the rate of neutral collision with available electrons in the flame.
6.3.1 Errors in electron density and collision frequency estimation
The electron density and collision frequency were determined by a graphical method. One of ways to determine the errors in the parameters is to use the gradient and ordinate values
[image:9.439.165.389.412.607.2]and their associated errors e.g., in [21]. When using this method, error in the electron density (ΔN) is given by the expression:
ΔN¼ N
2gradord:
Δord ord þ
Δgrad grad
ð18Þ
Similarly,
Δϕeff ¼ ϕeff
2gradord:
Δord ord þ
Δgrad grad
ð19Þ
Fig. 5 Variation of flame elec-tron density with time since ignition.
[image:10.439.167.388.52.247.2] [image:10.439.115.389.327.614.2]whereΔgrad. is the difference between best and worst fits slopes andΔord. is the difference in the ordinate intercepts of the best and the worst fits. The errors are shown as error bars in Figs.5and6. The errors for the time coordinates in figures are too small to show.
7 Conclusions
The electron density for the pine fire with maximum radiant heat up to about 62 kWm−2 was in the range from 0.51–1.35×10¹⁶m−3. The electron densities were lower than those produced from non vegetation fuel flames with much higher temperatures e.g. Belcheret al.
[2] and Koretzkyet al.[1]. Electron concentration in the flame depends on the type of fuel as well as its temperature because it is this combination that produces ionisable particles.
The collision frequency of the flames was in the range of 3.43–5.97×10¹⁰s−1. The range is lower than electron-neutral collision frequency at normal air temperature. The collision frequency is directly related to the neutral gas density and medium temperature. At ambient air temperatures (288 K) electron-neutral collision frequency is about 2.3×10¹²s−1(see e.g., in *[10]). In a constant air pressure environment, temperature influences number density of air *molecules. An increase in flame temperature results in a decrease in air density in the *combustion zone. It is for this reason that collision frequency has been observed to decrease *with the increase in fire temperature (see Fig. 6). For the pine litter fire, attenuation is however related in a complex way with both electron density and collision frequency, which are both related to electron content and flame temperature. From the experiment, 8–10.5 GHz microwaves experienced relative attenuation in the range 1.64– 5.68 dB when propagating in a line-of-sight mode through flame.
Acknowledgement We would like gratefully to acknowledge the Department of Electrical Engineering of JCU for providing the equipment for S-parameter measurement. The work is supported by the Staff Development Office of the University of Botswana. It is partly supported by Emergency Management Australia under project no. 60/2001.
[image:11.439.164.392.58.231.2]References
1. E. Koretzsky and S. P. Kuo, Characterization of an atmospheric pressure plasma generated by a plasma torch array, Phys. Plasmas5(10), 3774–3780 (1998)
2. H. Belcher and T. M. Sudden, Studies on the ionisation produced by metallic salts in flames II. Reactions governed by ionic equillibriua in coal-gas/air flames containg alkali metal salts, Proc. R. Soc. Lond. Series A202(10), 17–39 (1950)
3. D. W. Williams, J. S. Adams, J. J. Batten, G. F. Whitty, and G. T. Richardson, Operation Euroka: An Australian Mass Fire Experiment, Report 386, Defense Standards Laboratory, Maribyrnor, Victoria Australia, 1970.
4. M. Hata and D. Shigeyuki, Propagation tests for 23 GHz and 40 GHz, IEEE J. Sel. Areas Comm.1(4), 658–673 (1983)
5. A, Sorokin, X. Vancassel, and P. Mirabel, Emission of ions and charged soot particle by aircraft engines, Atmos. Chem. Phys. Discuss2, 2045–2074 (2002)
6. D. Latham, Space charge generated by wind tunnel fires, Atmos. Res.51, 267–278 (1999)
7. C. J. Butler and A. N. Hayhurst, Kinetics of gas-phase ionization of an alkali metal, A, by the electron and proton transfer reactions: A + H3O+→A +.H20 +H; AOH + AOH2+ H20 in fuel-rich flames at 1800–2250 K, J. Chem. Soc. Faraday Trans.98, 2729–2734 (1998)
8. V. V. Varadan, K. A. Jose, and V. K. Varadan, In situ Microwave Characterization of Nonplanar Dielectric Objects, IEEE Trans. Microwave Theor. Tech.48(3), 388–394 (2000)
9. A. Vodacek, R. L. Kremens, S. C. Fordham, S. C. VanGorden, D. Luisi, J. R. Schott, and D. J., Latham, Remote optical detection of biomass burning using potassium emission signature, Int. J. Remote Sens.
23, 2721–2726 (2002)
10. K. Akhtar, E. J. Scharer, S. M. Tysk, and E. Kho, Plasma interferometry at high pressures, Rev. Sci. Instrum.74(2), 996–1001 (2003)
11. H. Smith and T. M. Sudden, Studies on ionisation produced by metallic salts in flames III. Ionic equilibria in hydrogen/air flames containing alkali metal salts, Proc. R. Soc. A211(1104), 31–54 (1952) 12. H. Belcher and T. M. Sudden, Studies on ionisation produced by metallic salts in flames I. Determination of collision frequency of electrons in coal gas-air flame, Proc. R. Soc. A201(1067), 480–488 (1950) 13. K. E. Shuler and J. Weber, A microwave investigation of the ionization of hydrogen-oxygen and
acetylene-oxygen flames, J. Chem. Physi.22(3), 491–502 (1954)
14. R. E. Sturgeon, S. S. Berman, and S. Kashyaps, Microwave attenuation determination Of electron concentration in graphite and tantalum tube electrothermal atomizers, Anal. Chem. 52, 1049–1053 (1980)
15. F. P. Adler, Measurement of conductivity of a jet flame, J. Appl. Phys.25(7), 903–908 (1954) 16. P. K. Gangopadhyay, K. Lahiri-Dutt, and K. Saha, Application of remote sensing to identify coal fires in
Raniganj Coalbelt, India, Int. J. Applied Earth Observ. and Geoinformation8, 188–195 (2006) 17. N. Sifakis, D. Paronis, and I. Keramitsoglou, Combining AVHRR imagery with CORINE land cover
data to observe forest fires and asses their consequence, Int. J. Applied Earth Observ. and Geoinformation5, 263–274 (2004)
18. T. Okuno, N. Sonoyama, J. Hayashi, C. Li, C. Sathe, and T. Chiba, Primary release of Alkali and Alkaline Earth metallic species during pyrolysis of pulverized biomass, Energy Fuels19, 2164–2171 (2005)
19. L. S. Frost, Conductivity of seeded atmospheric pressure plasmas, J. Appl. Phys.32, 2029–2036 (1961) 20. T. L. Clark, M. Griffiths, M. J. Reeder, and D. Latham, Numerical simulations of grassland fires in the Northern Territory, Australia: a new subgrid-scale fire Parameterization, J. Geophys. Res.108(D18), 4589 ACL 14-1—14–15 (2003)