University of Southern Queensland
Faculty of Engineering and Surveying
Synthesis of Modified Phenolic Resins using Renewable
Materials for Advanced Composites in Civil Engineering
Structures.
A dissertation submitted by
Nigel Peter Pola
in fulfilment of the requirements of
Courses ENG4111 and 4112 Research Project
Bachelor of Civil Engineering
October, 2010
Abstract
In this project the synthesis and characterisation of Phenolic formaldehyde resins (PF) and Phenolic formaldehyde resins modified with Cardanol (CPF) resin and natural renewable materials as thermoset fillers is investigated. The project also investigates the effect of percentage of filler by weight of renewable materials (Sawdust fibres) on the ultimate mechanical and thermal properties of the composites with PF and CPF resins.
Phenol Formaldehyde (PF) resins are made from Benzene a petroleum product. Petrochemical supplies are finite and the economics of their use by enhancing and extending their use is of considerable interest from both an economic and resource basis. PF resins are among the most widely used thermosets because of their economics on a cost-per-volume basis. Environmental and cost concerns have lead to the search for alternative chemicals obtained from renewable raw materials to complement and /or replace PF resins.
The natural substitute for PF resins used in this study is Cardanol, a natural Phenolic resin distilled from cashew nut shell liquid (CNSL). CNSL itself is derived from waste cashew nut shell. Cardanol can be blended with PF resins to make Cardanol Phenolic Formaldehyde (CPF) resins, extending and complementing the PF resins. In this study fillers in the form of Sawdust are also added to extend these PF and CPF resins as they are characterised or formed.
University of Southern Queensland
Faculty of Engineering and Surveying
ENG4111 & ENG4112 Research Project
Limitations of Use
The Council of the University of Southern Queensland, its Faculty of Engineering and Surveying, and the staff of the University of Southern Queensland, do not accept any responsibility for the truth, accuracy or completeness of material contained within or associated with this dissertation.
Persons using all or any part of this material do so at their own risk, and not at the risk of the Council of the University of Southern Queensland, its Faculty of Engineering and Surveying or the staff of the University of Southern Queensland.
This dissertation reports an educational exercise and has no purpose or validity beyond this exercise. The sole purpose of the course pair entitled "Research Project" is to contribute to the overall education within the student’s chosen degree program. This document, the associated hardware, software, drawings, and other material set out in the associated appendices should not be used for any other purpose: if they are so used, it is entirely at the risk of the user.
Professor Frank Bullen Dean
Certification
I certify that the ideas, designs and experimental work, results, analysis and conclusions set out in this dissertation are entirely my own efforts, except where otherwise indicated and acknowledged.
I further certify that the work is original and has not been previously submitted for assessment in any other course or institution, except where specifically stated.
Nigel Peter Pola
Student Number: 00311115728
___________________________
Signature
28/ 10 / 2010 .
Acknowledgements
I would like to recognise the assistance of those who contributed to the completion of this dissertation. In particular Dr Francisco Cardona who provided useful discussions on the intricate details of this project and gave very helpful suggestions when tests went not as planned.
Also a thank you to Nathan Manthey for having the bad luck to share an office with me and my questions, but was able to point me in the right direction as to where to start.
I would also like to recognise the staff at the Centre for Excellence in Engineering Fibre Composites (CEEFC), even Wayne who accidently broke one of my samples.
Table of Contents
Abstract ... ii
Limitations of Use ... iii
Certification ... iv
Acknowledgements ... v
Table of Contents ... vi
List of Figures... ix
List of Tables ... xiv
Appendices ... xv
Nomenclature ... xv
Glossary of terms ... xvii
1 Introduction ... 18
1.1 Project Topic ... 18
1.2 Project Background ... 18
1.3 The Research Project Aims and Objectives ... 19
1.4 Justification ... 19
1.5 Scope ... 20
1.6 Conclusion ... 20
2 Literature Review ... 21
2.1 Introduction ... 21
2.2 Definition of composite materials ... 21
2.3 Background of Composite Building Materials ... 22
2.4 Background of Phenolic Resin and its Composites ... 22
2.5 Phenolic Resin derived from renewable materials ... 24
2.5.1 Cashew Nut Shell Liquid ... 24
2.5.2 Cardanol ... 25
2.6 Thermoset Resins ... 26
2.6.1 Types of Phenolic Thermoset Resin ... 26
2.7 Synthesis of Phenolic Formaldehyde resin ... 26
2.8 Synthesis of Cardanol Phenolic Formaldehyde resin ... 27
2.8.1 Bonding of Cardanol and Phenolic Formaldehyde ... 28
2.8.2 Synthesis of CPF resins ... 29
2.9 Phenolic Resin Characteristics ... 29
2.10 Cardanol Phenolic Formaldehyde Resin Characteristics ... 30
2.11 Phenolic Resin uses ... 31
2.12 Cardanol Phenolic Composite Resin Uses ... 32
2.13 Development of other resins and composites ... 32
2.14 Thermoset Resin Fillers and Reinforcement ... 33
2.14.1 Introduction ... 33
2.14.2 Lignocellulosic Thermoset Resin Fillers ... 34
2.14.3 Inorganic Thermoset Resin Fillers ... 35
2.14.4 Synthetic Waste Material Thermoset Resin Fillers ... 36
2.14.5 Synthetic Man Made thermoset resin fillers ... 37
2.15 Testing of Modified Phenolic Resin Samples ... 38
2.15.2 Flexural Testing ... 38
2.15.3 DMA Testing ... 38
2.16 Risk Management of Modified Phenolic Resin Composites ... 40
2.16.1 Introduction ... 40
2.16.2 Safety Induction ... 40
2.16.3 Risk Assessment ... 41
2.16.4 Actions against Risk ... 41
2.16.5 Monitoring and review of Risk ... 41
2.17 Consequential Effects ... 42
2.17.1 Introduction ... 42
2.17.2 Consequences ... 42
2.18 Ethical responsibility ... 42
2.19 Timelines ... 43
3 Research & Methodology ... 44
3.1 Introduction ... 44
3.2 Materials ... 44
3.2.1 Phenolic Resin Used in Synthesis ... 44
3.2.2 Catalyst Used in Synthesis ... 44
3.2.3 Cardanol used in Synthesis ... 44
3.2.4 Thermoset Resin Filler Used in Synthesis ... 45
3.3 Preparation and Synthesis of Test Samples ... 45
3.3.1 Preparation for Synthesis of Test Samples ... 45
3.3.2 Equipment for Synthesis of Test Samples ... 45
3.3.3 Determination of PF and CPF Composite Sample Composition ... 46
3.3.4 Steps in Sample Preparation for synthesis ... 46
3.3.5 Curing of Test Samples... 48
3.4 The Cutting and Shaping of Test Samples ... 49
3.4.1 Flexural Testing Sample Production ... 49
3.4.2 DMA Testing Sample Production ... 49
3.4.3 Tensile Testing Sample Production ... 50
3.4.4 Costs of Materials ... 51
3.5 Concluding Remarks ... 51
4 Characterisation and Testing of Modified Composite Resins ... 52
4.1 Introduction ... 52
4.2 Testing ... 52
4.2.1 Flexural testing ... 53
4.2.2 DMA Testing ... 53
4.3 Flexural Testing Results ... 54
4.3.1 Flexural Modulus results ... 54
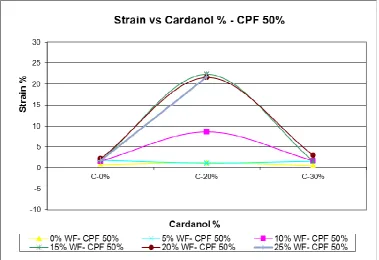
4.3.2 Flexural Strain results ... 57
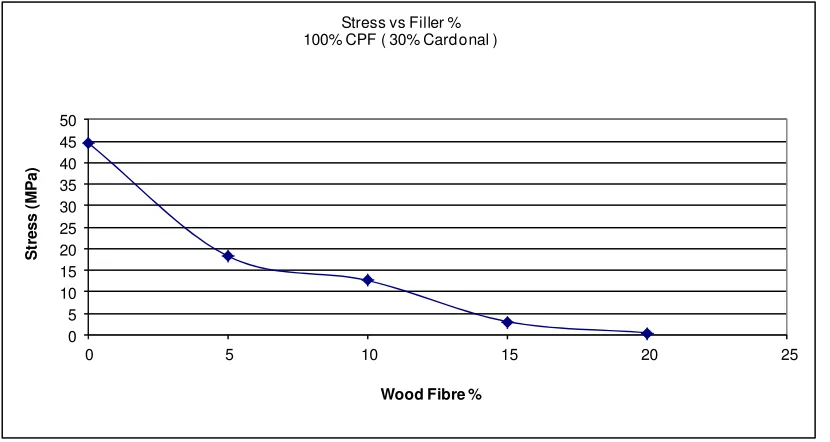
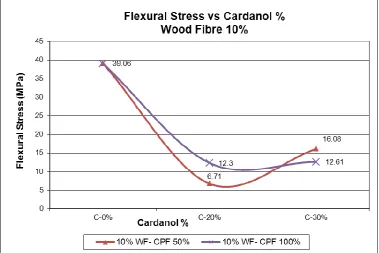
4.3.3 Flexural Stress Results ... 60
4.4 Dynamic Mechanical Analysis (DMA) Test Results ... 64
4.4.1 Storage Modulus ... 64
4.4.2 Glass Transition Temperature (Tg) ... 68
4.5 Discussion of Testing Results ... 72
4.5.1 Flexural Modulus Result Discussion ... 72
4.5.2 Flexural Strain Result Discussion ... 73
4.5.3 Flexural Stress Result Discussion ... 73
4.6.1 Wood Fibre effects on composite samples ... 74
4.6.2 Cardanol effects on composite samples ... 74
4.6.3 External Comparison to Results ... 75
5 Conclusions ... 76
5.1 Introduction ... 76
5.1.1 Objective 1: Literature review... 76
5.1.2 Objectives 2 and 3 ... 77
5.1.3 Objective 4: The Testing and Characterisation of the Synthesised CPF Resins 77 5.2 Conclusion ... 78
6 Recommendations... 79
6.1 Introduction ... 79
6.2 Restrictions and Challenges ... 79
6.3 Recommendations for Future Work ... 79
List of Figures
Figure 1: Mud Brick; a simple composite material ... 21
Figure 2: Bakelite radio (tuberadioland) and Bakelite billiard balls (flickr 2010) ... 23
Figure 3:The 1941 Ford which was made from Phenolic resin and hemp fibre ... 23
Figure 4: Cashew nut (seaexport 2009) ... 24
Figure 5: Constituents of crude CNSL (Chuayjuljit et al, 2006, p.2) ... 24
Figure 6: Conversion of Anacardic acid into anacardol and then cardanol (Chuayjuljit, Rattanametangkool & Potiyaraj, 2006, p.2) ... 25
Figure 7: Synthesis pathway of Resol and Novolac (Adapted from Painter and Coleman 2000, p.1)... 26
Figure 8: Reaction of phenol with formaldehyde (Adapted from Tyberg 2000, p.4) .... 27
Figure 9: Resol prepolymer formation (Adapted from Tyberg 2000, p.4) ... 27
Figure 10: Phenol and Cardanol Bonding to create CPF resin (Cardona 2009) ... 28
Figure 11: Bonded Liquid Cardanol Resole Phenolic Resin (Cardona 2009) ... 28
Figure 12: Cardanol Phenolic Formaldehyde Thermoset (Cardona 2009) ... 29
Figure 13: Cardanol; n = 0, 2, 4 & 6 (Mwaikambo 2009, p.51) ... 30
Figure 14: Applications of Phenolic resin (Value to Wood 2009) ... 31
Figure 15: NEC mobile phone made from CPF resin and cellulose fibre ... 32
Figure 16: Fly ash particles LHS (US department of Transportation 2006) and glass microspheres RHS (concrete canoe 2010) ... 36
Figure 17: Dynamic Oscillatory test details (TA Instruments 2008) ... 38
Figure 18: An example of the attributes measurable using DMA testing ... 39
Figure 19: DMA test machine with sample for testing ... 40
Figure 20: Safety signage in the CEEFC workshop ... 41
Figure 21: Phenolic resin samples with the different volumes of wood fibre ... 45
Figure 23: PF resin sample produced during study showing excessive voids from excess catalyst in reaction. ... 47
Figure 24: Oil bath in a fume cupboard (LHS) and the CEEFC laboratory RHS. ... 48
Figure 25: Machinery for cutting and shaping of samples; LHS tile cutter and RHS face grinder. ... 49
Figure 26: Sample ready for testing in the DMA machine ... 50
Figure 29: Graph of all Flexural Modulus vs. Filler % Results ... 55
Figure 30: Graph of Flexural Modulus vs Cardanol % - CPF 100% ... 55
Figure 31: Graph of Flexural Modulus vs Cardanol % - CPF 50% ... 56
Figure 32: Graph of Flexural Modulus vs Cardanol % - Wood Fibre 10% Result Comparison ... 57
Figure 33: Graph of all Strain vs Filler % Results ... 58
Figure 34: Graph of Flexural Strain vs Cardanol % - CPF 100% ... 59
Figure 35: Graph of Flexural Strain vs Cardanol % - CPF 50% ... 60
Figure 36: Flexural Strain vs Cardanol % - Wood Fibre 10% Result Comparison ... 60
Figure 37: Graph of all Stress vs Filler Results ... 61
Figure 38: Graph of Flexural stress vs Cardanol % - CPF 100% ... 62
Figure 39: Graph of Flexural stress vs Cardanol % - CPF 50%... 63
Figure 40: Graph of Flexural Stress vs Cardanol % Wood Fibre 10% for Comparison 64 Figure 41: Graph of all DMA Storage Modulus (MPa) results for all resin types ... 65
Figure 42: Graph of DMA results of Storage modulus vs Cardanol% - CPF 100% ... 66
Figure 43: Graph of DMA results of Storage modulus vs Cardanol% - CPF 50% ... 67
Figure 44: DMA Results - Cardanol comparison 5% WF - CPF 100% & CPF 50% .... 68
Figure 45: DMA Glass Transition Temperature (Tg) results for all resin types ... 69
Figure 46: DMA - CPF 100% Tg vs Cardanol percentage ... 70
Figure 47: DMA - CPF 50% Tg vs Cardanol percentage ... 71
Figure 48: DMA Results: Comparison of CPF 100% and CPF 50% highest values ... 72
Figure 49: Flexural Modulus vs Filler – All results ... 86
Figure 50: Flexural modulus vs wood fibre filler - 100% PF ... 86
Figure 51: Flexural modulus vs wood fibre filler - 50% PF - 50% CPF (C - 20%) ... 87
Figure 52: Flexural modulus vs wood fibre filler - 50% PF - 50% CPF (C - 30%) ... 87
Figure 53: Flexural modulus vs wood fibre filler - 100% CPF (C - 20%) ... 87
Figure 54: Flexural modulus vs wood fibre filler - 100% CPF (C - 30%) ... 88
Figure 55: Graph of Flexural Modulus vs Cardanol (CPF 100%) ... 88
Figure 56: Graph of Flexural Modulus vs Cardanol (CPF 50%) ... 89
Figure 57: Graph of Flexural Modulus vs Cardanol % - Wood Fibre 0% Result Comparison ... 89
Figure 58: Graph of Flexural Modulus vs Cardanol % - Wood Fibre 5% Result Comparison ... 90
Figure 60: Graph of Flexural Modulus vs Cardanol % - Wood Fibre 15% Result
Comparison ... 91
Figure 61: Graph of Flexural Modulus vs Cardanol % - Wood Fibre 20% Result Comparison ... 91
Figure 62: Graph of Flexural Stress vs Filler % - All Results ... 92
Figure 63: Stress vs wood fibre filler - 100% PF ... 92
Figure 64: Stress vs wood fibre filler - 50% PF - 50% CPF (C- 20%) ... 93
Figure 65: Stress vs wood fibre filler - 50% PF - 50% CPF (C - 30%) ... 93
Figure 66: Stress vs wood fibre filler - 100% CPF (C - 20%) ... 93
Figure 67: Stress vs wood fibre filler - 100% CPF (C - 30%) ... 94
Figure 68: Stress vs Cardanol % All CPF 100% Results ... 94
Figure 69: Stress vs Cardanol % All CPF 50% Results... 95
Figure 70: Graph of Flexural Stress vs Cardanol % Wood Fibre 0% for Comparison .. 95
Figure 71: Graph of Flexural Stress vs Cardanol % Wood Fibre 5% for Comparison .. 96
Figure 72: Graph of Flexural Stress vs Cardanol % Wood Fibre 10% for Comparison 96 Figure 73: Graph of Flexural Stress vs Cardanol % Wood Fibre 15% for Comparison 97 Figure 74: Graph of Flexural Stress vs Cardanol % Wood Fibre 20% for Comparison 97 Figure 75: Flexural Strain vs Filler % - All Results ... 98
Figure 76: Strain vs wood fibre filler - 100% PF ... 98
Figure 77: Strain vs wood fibre filler - 50% PF - 50% CPF (C - 20%) ... 99
Figure 78: Strain vs wood fibre filler - 50% PF - 50% CPF (C - 30%) ... 99
Figure 79: Strain vs wood fibre filler - 100% CPF (C - 20%) ... 99
Figure 80: Strain vs wood fibre filler - 100% CPF (C - 30%) ... 100
Figure 81: Flexural Strain vs Cardanol % - All CPF 100% Results ... 100
Figure 82: Flexural Strain vs Cardanol % - All CPF 50% Results... 101
Figure 83: Graph of Flexural Strain vs Cardanol % - Wood Fibre 0% Result Comparison ... 101
Figure 84: Flexural Strain vs Cardanol % - Wood Fibre 5% Result Comparison ... 102
Figure 85: Flexural Strain vs Cardanol % - Wood Fibre 10% Result Comparison ... 102
Figure 86: Graph of Flexural Strain vs Cardanol % - Wood Fibre 15% Result Comparison ... 103
Figure 87: Graph of Flexural Strain vs Cardanol % - Wood Fibre 20% Result Comparison ... 103
Figure 89: Graph of DMA - Tg vs. Filler % All CPF 100% comparison with PF resin
... 105
Figure 90: Graph of DMA - Tg vs. Filler % All CPF 50% comparison with PF resin 106 Figure 91: Comparison of highest and lowest values of Tg results... 106
Figure 92: DMA Glass Transition Temperature vs Cardanol %, CPF 100% ... 107
Figure 93: DMA Glass Transition Temperature vs Cardanol %, CPF 50% ... 107
Figure 94: DMA result Tg vs. Cardanol % - 0% Wood Fibre ... 108
Figure 95: DMA result Tg vs. Cardanol % - 5% wood fibre ... 108
Figure 96: DMA Glass transition Temperature vs Cardanol %, - 10% Wood Fibre ... 109
Figure 97: DMA Glass transition Temperature vs Cardanol %,- 15% Wood Fibre .... 109
Figure 98: DMA Glass transition Temperature vs Cardanol % - 20% Wood Fibre .... 110
Figure 99: DMA Glass transition Temperature vs Cardanol % - 25% Wood Fibre .... 110
Figure 100: Graph of DMA – Storage Modulus vs. Filler % All CPF 100% comparison with PF resin ... 111
Figure 101: Graph of DMA – Storage Modulus vs Filler % All CPF 50% comparison with PF resin ... 111
Figure 102: DMA result CPF-100%; Storage Modulus vs. Cardanol % ... 112
Figure 103: DMA result CPF-50%; Storage Modulus vs. Cardanol % ... 113
Figure 104: Graph of Storage Modulus vs Cardanol % - Wood Fibre 0% Result Comparison ... 113
Figure 105: Graph of Storage Modulus vs Cardanol % - Wood Fibre 5% Result Comparison ... 114
Figure 106: Graph of Storage Modulus vs Cardanol % - Wood Fibre 10% Result Comparison ... 114
Figure 107: Graph of Storage Modulus vs Cardanol % - Wood Fibre 15% Result Comparison ... 115
Figure 108: Graph of Storage Modulus vs Cardanol % - Wood Fibre 20% Result Comparison ... 115
Figure 109: 100% PF resin - Wood fibre 0% ... 116
Figure 110: 100% PF resin - Wood fibre 5% ... 116
Figure 111: 100% PF resin - Wood fibre 10% ... 117
Figure 112: 100% PF resin - Wood fibre 15% ... 117
Figure 113: 100% PF resin - Wood fibre 20% ... 118
Figure 114: 100% PF resin - Wood fibre 25% ... 118
Figure 116: PF 50% CPF 50% resin - (Cardanol 20% of CPF) Wood fibre 5% ... 119
Figure 117: PF 50% CPF 50% resin - (Cardanol 20% of CPF) Wood fibre 10% ... 120
Figure 118: PF 50% CPF 50% resin - (Cardanol 20% of CPF) Wood fibre 15% ... 120
Figure 119: PF 50% CPF 50% resin - (Cardanol 20% of CPF) Wood fibre 25% ... 121
Figure 120: CPF 100% resin - (Cardanol 20% of CPF) Wood fibre 0% ... 122
Figure 121: CPF 100% resin - (Cardanol 20% of CPF) Wood fibre 5% ... 122
Figure 122: CPF 100% resin - (Cardanol 20% of CPF) Wood fibre 10% ... 123
Figure 123: CPF 100% resin - (Cardanol 20% of CPF) Wood fibre 15% ... 123
Figure 124: CPF 100% resin - (Cardanol 20% of CPF) Wood fibre 20% ... 124
Figure 125: CPF 100% resin - (Cardanol 30% of CPF) Wood fibre 0% ... 125
Figure 126: CPF 100% resin - (Cardanol 30% of CPF) Wood fibre 5% ... 125
Figure 127: CPF 100% resin - (Cardanol 30% of CPF) Wood fibre 10% ... 126
Figure 128: CPF 100% resin - (Cardanol 30% of CPF) Wood fibre 15% ... 126
Figure 129: CPF 100% resin - (Cardanol 30% of CPF) Wood fibre 20% ... 127
Figure 130: PF 50% CPF 50% resin - (Cardanol 30% of CPF) Wood fibre 0% ... 128
Figure 131: PF 50% CPF 50% resin - (Cardanol 30% of CPF) Wood fibre 5% ... 128
Figure 132: PF 50% CPF 50% resin - (Cardanol 30% of CPF) Wood fibre 10% ... 129
Figure 133: PF 50% CPF 50% resin - (Cardanol 30% of CPF) Wood fibre 15% ... 129
Figure 134: Hafco Tile cutting machine used for cutting of samples ... 130
Figure 135: Surface Grinder for shaping samples ... 130
Figure 136: Fume cabinet holding oil bath for bonding Phenol and Cardanol ... 131
Figure 137: Measuring Scales (LHS) and Flexural Test moulds (RHS) ... 131
List of Tables
Table 1: Composition of Phenolic components in natural and technical CNSL
(Mwaikambo 2009, p.50, Menon et al, 1985, Gedam and Sampathkumaran, 1986) ... 25
Table 2: Phenolic Resin Characteristics... 29
Table 3: Table of Phenolic resin uses ... 31
Table 4: Renewable polymers (Vilapana et al 2010, p.4) , (Bicerano & Associates Consulting Inc 2009) & (Raquez et al 2010) ... 33
Table 5: Timelines for project completion ... 43
Table 6: Catalyst proportions ... 44
Table 7: Naming of samples against composition ... 52
Table 8: All Flexural Modulus results (Pa) against wood fibre percentage ... 55
Table 9: All Strain results (%) against wood fibre percentage... 58
Table 10: All stress results (MPa) against wood fibre percentage ... 61
Table 11: All DMA Storage Modulus (MPa) results for all resin types ... 65
Table 12: DMA results of Storage modulus vs Cardanol% - CPF 100% ... 66
Table 13: DMA results of Storage modulus vs Cardanol% - CPF 50% ... 67
Table 14: Glass Transition Temperature results against wood fibre percentage ... 69
Table 15: DMA result - CPF 100% Tg vs Cardanol percentage ... 70
Table 16: DMA result - CPF 50% Tg vs Cardanol percentage ... 71
Table 17: Properties of natural fibre reinforced Phenolics ... 75
Table 18: Table of flexural test results ... 85
Table 19: DMA Test Results ... 104
Table 20: Storage Modulus vs. Cardanol % ... 112
Appendices
Appendix A: Project Specification ... 84
Appendix B: Flexural Test results ... 85
Flexural Modulus vs Wood Fibre Filler ... 86
Flexural Modulus vs Cardanol %... 88
Flexural Stress vs Wood Fibre Filler ... 92
Flexural Stress vs Cardanol % ... 94
Flexural Strain vs Wood Fibre Filler % ... 98
Flexural Strain vs Cardanol % ... 100
Appendix C: Dynamic Mechanical Analysis Test Results ... 104
Tg vs Wood Fibre % ... 105
Tg vs Cardanol %... 106
Storage Modulus vs Wood Fibre % Results ... 111
Storage Modulus vs Cardanol % Results ... 112
Appendix D: DMA Machine Graphed Results ... 116
Appendix E: Preparation, Shaping and Cutting Equipment ... 130
Appendix F: Risk Assessment Table ... 133
Appendix G: Aspects of Sustainability ... 135
Nomenclature
CEEFC - Centre of Excellence in Engineering Fibre Composites DMA - Dynamic Mechanical Analysis
CPF - Cardanol Phenolic Formaldehyde Resin NaOH - Sodium Hydroxide
Glossary of terms
Feedstock - Raw material required for an industrial process.
1
Introduction
In this project the synthesis and characterisation of Phenolic formaldehyde resins (PF) and Phenolic formaldehyde resins modified with Cardanol (CPF) resin and natural renewable materials as thermoset fillers is investigated. The project also investigates the effect of percentage of filler by weight of renewable materials (Sawdust fibres) on the ultimate mechanical and thermal properties of the composites with PF and CPF resins.
This chapter describes the project topic, the project background, the research aims and objectives, the justification for the project, its scope and conclusions gained from the project.
1.1
Project Topic
Synthesis of Modified Phenolic Resins using Renewable Materials for Advanced
Composites in Civil Engineering Structures.
1.2
Project Background
Phenol Formaldehyde (PF) resins are made from Benzene a petroleum product. Petrochemical supplies are finite and the economics of their use by enhancing and extending their use is of considerable interest from both an economic and resource basis. ‘The synthesis of polymers starting from renewable resources is object of significant research efforts due to the increasing prices of petro chemical products associated with growing environmental concerns’ (Maffezzoli et al 2004, p.1).
PF resins are among the most widely used thermosets because of their economics on a cost-per-volume basis (Ku et al 2008, p 2). Phenol Formaldehyde thermosetting resins (or cross-linked polymers) are made from petrochemicals in the form of Benzene. ‘Environmental concerns and cost have lead to the search for alternative chemicals from renewable raw materials’ (Mwaikambo 2009, p.3).
complement PF resins. Fillers in the form of sawdust are also added to extend and/ or complement these PF and CPF resins.
In this project the synthesis and characterisation of modified Phenolic formaldehyde PF and CPF resins and the use of natural renewable materials as thermoset fillers is presented. The project investigates the effect of different percentages of Cardanol and sawdust fibres as thermoset filler by weight mixed with Phenolic resin.
The Tests completed to assess the samples properties were: • Flexural (Three point bending),
• Dynamic Mechanical Analysis (DMA)
Tensile tests were to be carried out but the properties of the resin samples from the enclosed condensation reaction made the samples defective, therefore these tests were not carried out.
1.3
The Research Project Aims and Objectives
The projects aims and objectives are taken from the Project Specification (Appendix A), where the research project is in four parts:
- Literature review of Phenolic resins and modifying mechanisms and techniques
- Synthesis of PF resins modified with different amounts of Cardanol (CPF) - Testing and characterisation of the synthesised CPF resins
- Preparation and testing of composites using the modified CPF resins and different amounts of the renewable materials (sawdust).
1.4
Justification
1.5
Scope
The scope of the project is taken from the Project Specifications aims and objectives (Appendix A). To complete this aim a literature review was completed to give an outline of previous work and these used as a background to the project. This information then was used to complement the research and methodology and the characterisation and testing of the Phenolic formaldehyde (PF) resins and Cardanol Phenolic formaldehyde (CPF) resins modified with sawdust fibres. The results have been compiled with conclusions drawn from the results and recommendations made as to further work.
1.6
Conclusion
Cardanol can effectively substitute commercial phenol in the synthesis of Phenolic resins. The Cardanol in the Synthesised CPF resins has had a positive effect where the samples have been found to be less brittle and more flexible than PF resins. The PF samples have generally an overall higher flexural modulus, stress values and Glass transition temperature.
The sawdust fibres have also been found to be suitable fillers for composites with CPF and CPF/PF resins. Effects due to wood fibre have been generally that Storage modulus, Flexural modulus, Stress and Glass Transition Temperature for all Composite blends fall with the increase of wood fibre percentage. Wood fibre at a filler percentage of 5% gives in most samples the highest modulus showing Sawdust fibres are suitable fillers for composites with CPF and CPF/PF resins. There is no percentage of wood fibre with better strain qualities than any other.
The CPF 50%– PF 50% resin mix was the most successful as it gave stable results with the brittleness decreasing in a linear manner with the higher percentage of filler.
2
Literature Review
2.1
Introduction
This chapter will give the background of Phenolic composite resins, thermoset fillers/or reinforcement and resins made from renewably derived materials. The synthesis, curing and characterisation of Phenolic Formaldehyde (PF) and Cardanol Phenolic Formaldehyde (CPF) resins with the thermoset fillers is discussed. The testing equipment used and the results obtained are outlined, as well as safety and social effects of this research project.
2.2
Definition of composite materials
A composite material according to Mwaikambo (2009, p.1) is a solid material consisting of two or more materials, in which the individual components retain their separate identities. An example of this is the mud brick (Figure 1) which was used in the time of the Pharaoh (Mwaikambo 2009, p.1) and is still used as a building material today. A mud brick is a simple structural material made of a clay/silt matrix with reinforcement from a cellulose fibre such as grass or straw.
Figure 1: Mud Brick; a simple composite material
2.3
Background of Composite Building Materials
Material compositions of building materials changed as better materials were found from trial and error. The composite material components dependent on the available materials. Some ancient mortars and concretes were made from natural or artificial aggregates and with organic and pozzolanic additives in the matrix with vegetable and/or animal materials as reinforcement (Moropoulou et al, 2005, p.296 -7).
Today composites are made for the same reasons as ancient people; the sourcing of economic materials to create building structures. The composite resin composite is essentially similar to the mud brick composite with a matrix and reinforcement with only the properties of the materials differing.
Currently the use of polymer matrix composites containing fibres is increasing at 10% per year Mwaikambo (2009, p.1). The main driving forces are the continuing high prices for petroleum-based raw materials and the potential environmental advantages of using renewable resources (Bicerano & Associates Consulting Inc 2009).
2.4
Background of Phenolic Resin and its Composites
Pira was the first to use Phenolic resin in 1843, but it was not until 1907 that Dr Leo Baekeland registered a patent for producing a synthetic resin he called Bakelite (Painter, Coleman 2000, p.1). Bakelite was created by reacting phenol and formaldehyde under heat and pressure (Simpson 1995, p.74). This new product was originally extracted from coal tar and came to be called the material of a thousand uses (EngineersHandbook.com).
Figure 2: Bakelite radio (tuberadioland) and Bakelite billiard balls (flickr 2010)
Henry Ford produced a Phenolic resin car in 1941 (Figure 3). The car was a Phenolic composite with 70 percent cellulose hemp fibre with soybean meal as an extender. The composite car was put aside with the mechanisation for WW2 and largely forgotten. With oil’s abundance, low price and good chemistries, petrochemicals were a less expensive feedstock than the renewable alternatives (Composites Technology 2008).
Figure 3: The 1941 Ford which was made from Phenolic resin and hemp fibre
2.5
Phenolic Resin derived from renewable materials
There are a number of polymer resins being developed from renewable materials. This project has used Cardanol but there are a large number of other types covered in Section 2.13.
2.5.1
Cashew Nut Shell Liquid
Cashew Nut Shell Liquid (CNSL) is an alkylphenolic oil by-product made from the mesocarp of the cashew nut (Anacardium occidentalis) waste shell (Maffezzolia et al 2004) . Yadav & Srivastava (2007) found it to be one of the few major and economic sources of naturally occurring phenols and regarded CNSL as a versatile and valuable raw material for polymer production.
Figure 4: Cashew nut (seaexport 2009)
The produced alkylphelonic oil is mainly composed of anacardic acid and lesser amounts of Cardanol and Cardol. The structure of the CNSL constituents is in Figure 5.
The makeup of these constituents is dependent on the extraction process used, there are two main processes:
• The cold -solvent process CNSL → Natural CNSL
• The hot-oil and/or roasting process CNSL → Technical CNSL
The varied composition of the two types of CNSL is given in Table 1:
Table 1: Composition of Phenolic components in natural and technical CNSL (Mwaikambo 2009, p.50, Menon et al, 1985, Gedam and Sampathkumaran, 1986)
Components Natural CNSL %
Technical CNSL %
Anacardic acid 77.02 -
Cardanol 2.37 82.15
Cardol 16.77 13.71
2-Methyl cardol 2.83 4.1
Polymers by difference 1.01 0.04
The Anacardic acid in natural CNSL is further decarboxylated to produce anacardol and then with hydrogenation yields cardanol (Mwaikambo 2009, p.50, Pansare, 1964). The diagram of this process is in Figure 6.
Figure 6: Conversion of Anacardic acid into anacardol and then cardanol (Chuayjuljit, Rattanametangkool & Potiyaraj, 2006, p.2)
2.5.2
Cardanol
Cardanol is distilled from CNSL and its chemistry is unusual, as Attanasi et al (2009, p.71) noted, that it is difficult to make phenols with a long unsaturated chain such as the cardanol fifteen carbon atom chain. Additionally it was found to be a ‘peculiar, simple and easily available starting material for the synthesis of various derivatives’.
formaldehyde in the same way as oil based Phenolics. This reaction through condensation polymerisation produces Cardanol-Phenol Formaldehyde (CPF) resins (Chuayjuljit et al 2006, p.1).
2.6
Thermoset Resins
All synthetic plastics are divided into two groups; thermoplastics and thermosets, these are dependent on the chemical bonding (Cecil 2008, p.15). PF and CPF resins are thermosets meaning they cannot be reshaped when reheated. The resin types are determined by the makeup of the catalyst during the synthesis of the resin.
2.6.1
Types of Phenolic Thermoset Resin
The two types of Phenolic resins are Resol and Novolac. The type being made is dependent on the pH of the catalyst and the ratio of phenol to formaldehyde. Resols are made under alkaline conditions with a ratio of phenol to formaldehyde from 1:1 to 1:3 (Tyberg 2000, p.1). An outline is given in Figure 7.
Figure 7: Synthesis pathway of Resol and Novolac (Adapted from Painter and Coleman 2000, p.1).
2.7
Synthesis of Phenolic Formaldehyde resin
Figure 8: Reaction of phenol with formaldehyde (Adapted from Tyberg 2000, p.4)
The hydroxymethylphenols form the prepolymers and depending on pH and temperature lead to dihydroxydibenzylether or dihydroxydiphenylmethane (Tyberg 2000, p.5). These are in Figure 9.
Figure 9: Resol prepolymer formation (Adapted from Tyberg 2000, p.4)
The reactive methylol groups in the resols molecules condense when heated, forming a fused-larger molecule or crosslinked resin (Painter and Coleman 2000, p.1). The prepolymers are heated to promote crosslinking of the resin from further reaction of hydroxymethylphenols. Water and formaldehyde are produced and volatilize during curing. This release of volatiles results in networks with a significant amount of voids that can detract from the mechanical properties (Tyberg 2000, p.5).
2.8
Synthesis of Cardanol Phenolic Formaldehyde resin
2.8.1
Bonding of Cardanol and Phenolic Formaldehyde
CPF resins are prepared from the reactions between formaldehyde and cardanol. They are dependent on the formaldehyde-to-cardanol ratio and the reaction conditions employed (Chuayjuljit et al, 2006, p.2).
The chemicals Phenol, Cardanol and Formaldehyde are reacted together in the presence of Sodium Hydroxide (NaOH) Catalyst, this solution is then put into a glass flask and then rotated in an oil bath within a fume cupboard (see Appendix E for apparatus). The diagram of this process is in Figure 10.
Figure 10: Phenol and Cardanol Bonding to create CPF resin (Cardona 2009)
The solution is in the oil bath at:
• 60°C for 1 hour, • 80°C 1 hour and • Then 60°C 1 hour.
From this a new modified Phenolic resin (CPF) with two types of bonds is created in Figure 11.
2.8.2
Synthesis of CPF resins
The CPF resins and their composites are then reacted in the presence of an acid catalyst using the same method as for PF resin. The samples are cured at room temperature for 24 hours, followed by post-curing at 80°C for 4 hours. The completed CPF thermoset matrix is outline in Figure 12.
Figure 12: Cardanol Phenolic Formaldehyde Thermoset (Cardona 2009)
2.9
Phenolic Resin Characteristics
The cured Phenolic polymer resin is a giant single molecule whose shape cannot be changed except by breaking bonds between atoms (Bédard and Riedl, 1990, p1). On being heated a thermosetting plastic first flows and then becomes crosslinked (cured) and will not soften significantly if reheated. Scrap from the process cannot be reused (Simpson 1995, p.27). Phenolics can be moulded by compression, transfer, and injection mould to close tolerances (ASM International 2003, p.27). Thermosetting matrix materials such as Phenolics are brittle due to the high crosslink densities (Tyberg 2000, p. 55). The main characteristics of Phenolic resin are summed in Table 2.
Table 2: Phenolic Resin Characteristics
Advantages Source
Range of use at approximately 120° to 260° C (ASM International 2003, p.25) Good chemical resistance (ASM International 2003, p.25) Low water absorption (ASM International 2003, p.25) Good electric strength (ASM International 2003, p.25) High char yield, low smoke volume and low smoke
toxicity (Simpson 1995, p.65) Superior oxidative resistance relative to steel (Tyberg 2000, p.1) Better freeze-thaw durability relative to concrete (Tyberg 2000, p.1) High chemical resistance, hard facing and are relatively
low cost (Bédard and Riedl, 1990, p1). Excellent flame retardance (Tyberg 2000, p.8)
Self-ignition temperature of 482°C (Tyberg 2000, p.8) Superior thermal resistance and chemical resistance as
well as adhesive properties (Sumitomo Bakelite 2009, p.3).
Disadvantages
Fairly good insulation resistance but not as good as other
resins (Simpson 1995, p.65)
They can be fairly brittle (Simpson 1995, p.65) Use of organic materials in construction is limited by their
high combustibility (Tyberg 2000, p.1)
2.10
Cardanol Phenolic Formaldehyde Resin Characteristics
Cardanol has a Phenolic structure substituted in meta position (Figure 13) with a long alkyl chain not easily obtainable by synthetic routes (Attanasi et al 2009, p.76). The long side chains impart flexibility because of internal plasticizing resulting in the formation of soft resins at elevated temperatures. This is unlike PF resins, which are hard and brittle (Chuayjuljit et al 2006, p.2). The side chain also imparts a hydrophobic nature making the resin water repellent and resistant to weathering (Raquez et al 2010, p.3).
Chuayjuljit et al (2006, p.1) note that ‘CPF resins are special Phenolic materials having properties such as high-temperature resistance, modulus retention at elevated temperatures, resistance to chemicals and detergents, high surface hardness, and low cost’. NEC has found CPF resin composites have high durability and malleability with characteristics better than other natural polymers such as Polylactic Acid (PLA) and Cellulose Acetate (CA) resin (ringier plastics, 2010).
2.11
Phenolic Resin uses
Phenolics low smoke volume and low smoke toxicity has had them specified in applications where escape from fire may be restricted, such as passenger transport applications and public buildings (Simpson 1995, p.65).
Figure 14: Applications of Phenolic resin (Value to Wood 2009)
Applications include:
• Impregnation of timber under pressure to increase hardness; I beam LHS of Figure
14.
• As a water and insect proof coating; centre of Figure 14, and
• As an adhesive to make laminates; RHS of Figure 14. (Value to Wood 2009)
Phenolic resin has a very broad number of uses, some of these uses are in Table 3.
Table 3: Table of Phenolic resin uses
Phenolic resin uses Source
nylon and polyester fibres (Bédard and Riedl, 1990, p1)
rubbers “ “
polyethylene “ “
Since Phenolic products cannot be melted by heating once they have been cured, they can be reused as fuel (thermal recycling) or reused as filler after being crushed into fine particles (material recycling) (Sumitomo Bakelite 2009, p.3).
2.12
Cardanol Phenolic Composite Resin Uses
Cardanol uses have been generally in industrial applications such as brake pads due to high wear resistance. But now more high end electronic equipment such as Laptops, computer accessories, and mobile phones are being manufactured using CPF composites. This is in part for marketing a green product (see Figure 15) but also for production economics and the plastics unique characteristics.
Figure 15: NEC mobile phone made from CPF resin and cellulose fibre
2.13
Development of other resins and composites
Renewable resin polymer development in the United States has been largely focused on the use of soybean oil and corn oil, mainly due to the facilities and equipment being in place to produce oil from these feedstock (Composites Technology 2008).
polymerizing bio-basedmonomers e.g. polylactic acid or PLA (Bicerano & Associates Consulting Inc 2009). Plant oil (triglycerides) resins are obtained by thermal or cationic copolymerization, and lignin a Phenolic has been considered as a promising substitute for phenol in phenol–formaldehyde-based resins (Raquez et al 2010, p.2)
A list of renewable polymers is in Table 4.
Table 4: Renewable polymers (Vilapana et al 2010, p.4) , (Bicerano & Associates Consulting Inc 2009) & (Raquez et al 2010)
Renewable polymers
Chitin Lignin
Cellulose Non Starch Polysaccharides Hemicellulose Proteins
Starch Polyhydroxyalkanoates triglycerides Tannin compounds
There is concern that renewable sources such as plant resources from feed grain that is used in plastics such as PLA, may lead to the possibility of future food shortages. This has emphasized the importance of using non-edible plant resources (ringier blog spot 2010).
2.14
Thermoset Resin Fillers and Reinforcement
2.14.1
Introduction
The main advantage to using renewable or waste materials as fillers is economics; industry is starting to look seriously at using renewable or waste materials in their products. This is in part to community expectations, government regulation, economics and marketing. ‘In recent years, (bio) plastics composed from plant resources attracted much attention as an effective measure to reduce the depletion of petroleum resources and alleviate global warming’ (ringier, 2010).
(Marcovich et al 2000, p.1) and secondly fillers are used for reasons of economy as an extender making a greater volume and therefore lowering the cost of production.
Vilaplana et al (2010, p.4) propose that as fillers /reinforcements, a wide range of materials from various origins can be used in the manufacture of sustainable biocomposites. Rowell et al (1997, p.3) proposed that the use of waste materials from agriculture could have a tremendous impact in lowering the usage of petroleum based plastics.
Vilaplana et al (2010, p.4) have grouped the fillers /reinforcements as follows: (i) Lignocellulosic materials, including wood flour, natural fibres.
(ii) Inorganic nano-fillers/ reinforcements that may contribute to the enhanced biodegradability of the resulting nano- biocomposites.
(iii) Different synthetic waste materials that can be recycled and incorporated into new products as fillers/ reinforcements.
Because this list was to discuss bio-composites it does not include synthetic materials that are manufactured to purpose as fillers. These are added to the list for this study of thermoset fillers. Synthetic fillers are still an option where a particular characteristic is required in a composite resin. This gives a fourth origin of materials for thermoset resins: (iv) Man made synthetic materials
2.14.2
Lignocellulosic Thermoset Resin Fillers
Lignocellulosic products need to be processed to extract them from their natural origin and modified to achieve the required characteristics (Vilapana et al 2010, p.4). Some newer examples of these products are cellulose whiskers and starch nanocrystals. 2.14.2.1 Lignocellulosic Filler Advantages
Rowell et al (1997, p.49) found Cellulose fibres to be soft and non-abrasive with high possible filling levels. The reduced equipment abrasion reduced re-tooling costs through the use of agricultural based fibres.
2.14.2.2 Lignocellulosic Filler Disadvantages
The use of natural fibres is complicated as fibres can vary in chemical composition and physical properties, generic characteristics, place of growth and preparation conditions (Mwaikambo 2009, p.3, Gassan et al, 1996).
The presence of hydroxyl groups in plant fibres also cause reactivity with water, causing a lack of adhesion between the hydrophilic cellulose fibres and the hydrophobic synthetic resins due to their incompatibility (Mwaikambo 2009, p.3 & 4). It is difficult to entirely eliminate the absorption of moisture without using expensive surface barriers created from chemical modification of some of the hydroxyl groups present (Rowell et al 1997, p.4, Rowell et al, 1986).
Dispersion levels of the fibres in the resin matrix are also negatives. Manthey (2009, p.49) using hemp fibres found difficulty in achieving uniform fibre dispersion in the resin matrix and that this could cause variations of strength in the composite.
Rowell et al (1997, p.4) found the primary drawback of the use of lignocellulosic fibres was found by to be the lower processing temperatures required in manufacture (about 200°C), this was due to the possibility of degradation of the fibres and/or the possibility of volatile emissions effecting composite properties.
Vilaplana et al (2010, p.4) have expressed concern that production of Biomass feedstock must be suitably selected so that the food supply availability and food costs are not interfered by the production of biomass.
2.14.3
Inorganic Thermoset Resin Fillers
2.14.3.1 Inorganic Filler Advantages
Talcum is used as it imparts even texture and softness. This is used in automotive body applications as it is able to be sanded after curing.
2.14.3.2 Inorganic Filler Disadvantages
The main disadvantage with inorganic fillers, is that as they are sourced from mining their resources are finite.
2.14.4
Synthetic Waste Material Thermoset Resin Fillers
Fillers made from by-products of industry are at the present moment highly desirable as the use of waste materials as filler has both an economic and an environmental benefit. An example is fly ash which is used as filler in resin, fly ash is a finely divided residue that resulting from the combustion of pulverized coal. Fly ash consists of silt-sized particles which are generally spherical, typically ranging in size between 10 and 100 micron (US department of Transportation 2006). Other recently developed synthetic fillers are glass microspheres RHS of Figure 16. These small discrete particles of Fly ash and glass microspheres are called Nanofillers.
Figure 16: Fly ash particles LHS (US department of Transportation 2006) and glass microspheres RHS (concrete canoe 2010)
Some other products are made from rubber tyres, recycled polyethylene terephthalate (PET) and post-industrial polystyrene (McConnell 2009).
2.14.4.1 Synthetic Waste Material Filler Advantages
and are chemically inert. Gurney (2006, p.1) found a cost reduction in using microspheres as fillers as weight is reduced and cost is reduced because fillers are cheaper than the resin that they replace.
2.14.4.2 Synthetic Waste Material Filler Disadvantages
Degradation of the resin matrix or polymer involves several physical and/or chemical processes which lead to significant deterioration of the quality of the polymeric materials. However, the environmental and toxicological implications of such nano-sized fillers and the derived nanocomposites are not fully understood yet (Vilaplana et al 2010 p.7). There is also the possibility of mercury off-gassing from fly ash (Ecological Building Network 2010).
2.14.5
Synthetic Man Made thermoset resin fillers
Some of the most common synthetic man made thermoset resin fillers are glass fibres, carbon fibres, boron fibres, and aramid fibres (Mwaikambo 2009, p.1). Phenolic resin matrix systems such as prepregs are used with these type of fibres. When the themoset resin is cured the prepreg ‘transforms into a solid structural material that is highly durable, temperature resistant, exceptionally stiff and lightweight’ (Hexcel 2010).
E-glass reinforced Phenolic prepregs have also been used in interior and exterior components aboard high speed trains such as the AVE S103 in Spain and the Combino Plus in Portugal (McConnell 2008).
2.14.5.1 Synthetic Man Made Filler advantages
Synthetic fibres can be produced with properties engineered for particular applications, (Mwaikambo 2009, p.1), this means that the integrity and quality of the filler can be rigidly controlled resulting in uniform products. The Phenolics have a good surface finish, curing is in short cycles, 10 minutes at 160° C.
2.14.5.2 Synthetic Man Made Filler disadvantages
2.15
Testing of Modified Phenolic Resin Samples
2.15.1
Introduction
This section outlines the methods of testing, the requirements for each method and the testing machinery required.
2.15.2
Flexural Testing
The flexural test results are in three parts:
• Flexural modulus (Youngs Modulus) in MPa • Strain as a percentage
• Stress in MPa
2.15.3
DMA Testing
Dynamic Mechanical Analysis (DMA) is a testing technique used to measure the mechanical properties of materials. DMA measures the viscoelastic properties using either transient or dynamic oscillatory tests. Dynamic oscillatory tests have been carried out on these samples. The dynamic oscillatory test is where a stress or strain is applied to the material and the resultant strain or stress is measured (see LHS of Figure 17).
Figure 17: Dynamic Oscillatory test details (TA Instruments 2008)
Also measured is the phase difference (δ) between the two sine waves.
From RHS of Figure 17:
The storage modulus, E’ = E*cos δ
The loss modulus, E’’ = E*sin δ
Tan delta (δ) = loss modulus/ storage modulus = E’’/ E’
The storage modulus is the elastic component and related to the sample’s stiffness. The loss modulus is the viscous component and is related to the sample’s ability to dissipate mechanical energy through molecular motion. Tan delta (δ) or tangent of phase
difference provides information on the relationship between the elastic and inelastic components. Glass transition temperature (Tg) is also measured using DMA testing (Figure 18).
Figure 18: An example of the attributes measurable using DMA testing
Figure 19: DMA test machine with sample for testing
2.16
Risk Management of Modified Phenolic Resin
Composites
2.16.1
Introduction
The risk management process should be an integral part of management (AS/NZS ISO 31000 2009, p.13). The need for risk management is backed by legislative requirements of the Qld Workplace Health and Safety Act 1995. The risk management process at the Centre of Excellence in Engineered Fibre Composites (CEEFC) begins with an on-site safety induction.
2.16.2
Safety Induction
Figure 20: Safety signage in the CEEFC workshop
2.16.3
Risk Assessment
Risk assessment is the overall process of risk identification, risk analysis and risk evaluation (AS/NZS ISO 31000 2009, p.17). The on-site induction has carried out this process for the workplace at the CEEFC. A risk assessment is now completed for each task that I will perform in carrying out my project.
Project tasks are:
• Preparation of composite resin samples
• Preparation and shaping of composite resin samples for testing • Testing of composite resin samples
• Disposal of composite resin samples
These tasks are put into a risk assessment table (Appendix F: Risk Assessment Table) and these tasks and related subtasks are rated against risk identification, risk analysis and risk evaluation.
2.16.4
Actions against Risk
The actions against the identified risks have resulted in all final risks having a low to very low likelihood of incidence. These actions are in the table of Risk Assessment (Appendix F).
2.16.5
Monitoring and review of Risk
2.17
Consequential Effects
2.17.1
Introduction
The intended effect of my research is to contribute to existing knowledge on using renewable products to extend and eventually replace Phenolic resins made from petrochemicals. Using the Institution of Engineers initiative; Towards Sustainable Engineering Practice: Engineering Frameworks for Sustainability, I have created an analysis of aspects of sustainability of my project as a Table (Appendix G). This Table has been used to rate possible implications and effects due to my project work.
2.17.2
Consequences
I have compared my project work against the criteria of ten aspects of sustainability (Appendix G) and have given a rating of sustainability of 78%. The objectives of my project are broad but from this research it may be possible to partially or fully replace of petrochemical products with renewable products. It is difficult to see a difference being made to part 8 and part 10 of aspects of sustainability. These are:
• The identifying a potential impact of my project work on eradication of poverty,
the reduction in differences in living standards and the full participation of women, youth and indigenous people.
• How my project work, and/or its outcomes, contribute to international
understanding.
The main detraction is that it is difficult to see a difference made to these problems by shifting the focus of Phenolic thermoset production from petrochemicals to renewable feedstock.
2.18
Ethical responsibility
The ethical responsibilities of this project have been compared to the Engineers Australia 2000 Code of Ethics. The project has been compared against the criteria of the nine tenets under this code in Appendix H.
2.19
Timelines
The timelines for the various aspects of the Research Project are in Table 5 below, the final date for submission is October 28th 2010.
3
Research & Methodology
3.1
Introduction
In this chapter the research and methodology are applied to synthesise the PF and CPF composite resin samples for characterisation and testing. The results will then be compared to results obtained in this project and others identified in the literature review. The synthesis, testing and characterisation of the PF and CPF composite resins is to be carried out in the laboratory at the Centre of Excellence in Engineering Fibre Composites (CEEFC) at the University of Southern Queensland.
3.2
Materials
3.2.1
Phenolic Resin Used in Synthesis
The Phenolic resin used is J2027L (Hexion Cellobond) a commercial resin manufactured by Hexion Specialty Chemicals Pty Ltd.
3.2.2
Catalyst Used in Synthesis
The catalyst was manufactured in the lab at the Centre of Excellence in Engineering Fibre Composites (CEEFC) at the University of Southern Queensland (USQ) and is of similar makeup to the commercial catalyst Phencat 10 also manufactured by Hexion Specialty Chemicals Pty Ltd. The proportions of the catalyst were:
Table 6: Catalyst proportions
Chemical Name Composition by Weight
P-Toluene sulfonic Acid (PTSA) 50%
Water 30%
Phosphoric Acid 20%
Total 100%
3.2.3
Cardanol used in Synthesis
3.2.4
Thermoset Resin Filler Used in Synthesis
The Thermoset resin filler was sawdust sourced from a local sawmill. The sawdust was passed through a sieve to 300 micron. These fibres were chosen for the lost cost, ease of repeatability of the tests and the fact that sawdust is a waste material. It was anticipated that the modulus of the fibres due to their small size would not have a large effect on the overall modulus of the sample and may only act as filler.
3.3
Preparation and Synthesis of Test Samples
Figure 21: Phenolic resin samples with the different volumes of wood fibre
Figure 21 above shows the variation in the synthesised samples. From left to right the samples are 25% and down to 5% wood fibre.
3.3.1
Preparation for Synthesis of Test Samples
During the preparation stage the chemicals for use in the project are sourced, the inductions to use the testing machinery are carried out, and sample moulds prepared. The samples are manufactured according to the type of test required.
3.3.2
Equipment for Synthesis of Test Samples
3.3.3
Determination of PF and CPF Composite Sample Composition
Early in the project it was determined that the samples would follow from a pattern of synthesis and characterisation of samples and then study these results to meet the requirements of the project.
• Synthesis of PF resins modified with different amounts of Cardanol (CPF) • Preparation and testing of composites using the modified CPF resins and
different amounts of the renewable materials (sawdust).
To meet these requirements these steps were indentified to begin sample preparation for testing, in summary these are:
• Part 1; preparation of sawdust wood fibre • Part 2; preparation of a suitable catalyst
• Part 3; preparation of a trial 100% Phenolic Formaldehyde (PF) resin sample • Part 4; preparation of CPF resin
• Part 5; preparation of PF and CPF samples with varying amounts of wood fibre • Part 6; preparation of CPF samples with varying amounts of blended CPF resin
and unblended PF resin and wood fibre
3.3.4
Steps in Sample Preparation for synthesis
The steps are outlined here for the PF and CPF composite sample preparation. 3.3.4.1 Part 1; preparation of sawdust wood fibre
The wood fibres were produced from sieving sawdust passing 300 micron and strored in a dry container.
3.3.4.2 Part 2; preparation of a suitable catalyst
From research a catalyst was determined for Phenolic resins, this is similar to the commercial product Phencat 10. The initial amount of catalyst trialled with the 100 gram sample of PF resin was 6% (6 g).
3.3.4.3 Part 3; preparation of a trial 100% Phenolic Formaldehyde (PF) resin
sample.
container and the catalyst added. Within half an hour the sample was extremely hot due to the rapidity of the reaction. The cured sample is in Figure 22. It was determined the amount of catalyst should be reduced to 5% and a fresh batch of PTSA used in the preparation of more catalyst. This new supply of catalyst was trialled again and found to produce a stable reaction.
Figure 23: PF resin sample produced during study showing excessive voids from excess catalyst in reaction.
3.3.4.4 Part 4; preparation of CPF resin
CPF resin is prepared by bonding the resin at elevated temperatures. The chemicals Phenol, Cardanol and Formaldehyde are reacted together in the presence of Sodium Hydroxide (NaOH) Catalyst in the CEEFC laboratory. This solution is then put into a glass flask and then rotated in an oil bath within a fume cupboard, see Figure 24.
The solution is in the oil bath at:
• 60°C for 1 hour, • 80°C 1 hour and • Then 60°C 1 hour.
Figure 24: Oil bath in a fume cupboard (LHS) and the CEEFC laboratory RHS.
3.3.4.5 Part 5; preparation of PF and CPF samples with varying amounts of wood
fibre
The PF and CPF resin samples were mixed with sawdust wood fibre in a range from 0% to 25% by weight. The steps were:
Step 1. Mix the 100g of resin thoroughly with the 5g of catalyst for the PF samples and 6% for the CPF samples
Step 2. Mix in the sawdust wood fibre at 0% to 25% by weight. Step 3. Let stand to cure for 24 hours
Step 4. Into the oven at 80° for 4 hours for post curing
Note. In step 1 the CPF resin sample had a much lower viscosity and an increase of 1% was used to enable the resin to react and crosslink adequately.
3.3.4.6 Part 6; preparation of CPF samples with varying amounts of blended
Cardanol and PF resin and unblended PF resin and wood fibre
Two different blends were used, these were:
1. Cardanol blended at 20% with PF resin and added 50-50 to make a Phenolic mix. 2. Cardanol blended at 30% with PF resin and added 50-50 to make a Phenolic mix. To both of these mixes were added sawdust wood fibre at 0% to 25% by weight.
3.3.5
Curing of Test Samples
The test samples are cured in their plastic containers at:
• Room temperature for 24 hours,
3.4
The Cutting and Shaping of Test Samples
Both the flexural test samples and the Dynamic Mechanical Analysis (DMA) samples were cut from the same 90mm diameter cured resin samples. This is for efficiency in production of the samples, but more importantly allows for comparison between the two different types of testing.
Figure 25: Machinery for cutting and shaping of samples; LHS tile cutter and RHS face grinder.
3.4.1
Flexural Testing Sample Production
Test pieces are cut with a tile cutter (Figure 25) from each of the 90mm diameter cured resin samples into three test samples 10mm thick, these are ground into shape with a surface grinder (Figure 25) until of uniform thickness and width. Exact measurements are taken before testing for entry into the computer. The samples are now ready for testing. The machine used is a MTS Alliance RT/10 universal testing machine.
3.4.2
DMA Testing Sample Production
Figure 26: Sample ready for testing in the DMA machine
3.4.3
Tensile Testing Sample Production
The moulds were cleaned and waxed and the prepared 100% PF resins were poured into the mould and left to cure. The samples unfortunately were not successful, Figure 27 has the image of the sample after curing. None of the samples were able to be removed from the mould without breakage along the stem of the samples.
Figure 27: Tensile samples after curing
not expected that the CPF composites would be any better so these were not trialled. Therefore there are no tensile samples to test.
3.4.4
Costs of Materials
There were 6 batches with 28 samples produced. Each sample was 100g and is rounded off for the purpose of simplifying the cost as it is low.
The cost of materials is summarised in the following table:
Material Cost per L Amount (L) Total
Phenol Formaldehyde $6.00 2.80 (28 x 100 ml) $16.80 Cardanol $2.50 0.840 (28 x 30 ml) $ 2.10 PTSA $15.00 0.140 (28 x 5ml) $ 2.10 Sawdust $0.00 28 x 75g $ 0
$21.00
3.5
Concluding Remarks
This chapter has demonstrated the methodology to prepare and synthesise the PF and CPF composite resin samples for characterisation and testing. There are no tensile test results due to the tensile samples poor integrity.
4
Characterisation and Testing of Modified Composite
Resins
4.1
Introduction
This chapter provides the characterisation and testing of modified PF and CPF resins. The characterisation includes the identification of the composites characteristics and discussion of the testing results using flexural tests and DMA tests. Characterisation will include:
• Graphing of the test results to clarify the variations within the samples and
the different composite blends.
• Comparison to the stated objectives of the project
4.2
Testing
The test samples are named from their composition, some sample names may have an suffix on the end of the names such as S1or S8. This means sample 1 or sample 8. These are:
Table 7: Naming of samples against composition
PF - 100 100% Phenolic formaldehyde resin matrix
CPF - 100 - C - 20 Cardanol Phenolic formaldehyde resin matrix with 20% Cardanol in mix.
CPF - 50 - C - 20 Cardanol Phenolic formaldehyde resin matrix with 20% Cardanol in mix is 50% of resin with the balance (the other 50%) being Phenolic formaldehyde resin.
CPF - 100 - C - 30 Cardanol Phenolic formaldehyde resin matrix with 30% Cardanol in mix.
4.2.1
Flexural testing
The flexural testing or three point bending test (Figure 28) is carried out using the MTS Alliance RT/10 with the flexural testing attachments. A gap of 64mm is required between the two lower points with the weight descending at 2mm per minute on to the sample.
The flexural test results are in three parts:
• Flexural modulus (Youngs Modulus) in MPa • Strain as a percentage
• Stress in MPa
Figure 28: Flexural testing of CPF resin sample
4.2.2
DMA Testing
4.3
Flexural Testing Results
The full tables and graphs are in Appendix B Flexural test results and Appendix C DMA test results. There are no results for tensile testing due to the poor integrity of the produced samples (see tensile sample production, page 50).
4.3.1
Flexural Modulus results
4.3.1.1 Wood Fibre flexural results
The wood fibre results in the graph in Figure 29 are taken from Table 8. Observations of the effect of Flexural modulus from filler percentage are:
• The 100% Phenolic formaldehyde sample (PF - 100%) demonstrates the stiffness of
PF resin. It has an overall higher flexural modulus than the other tested samples, except for CPF 50 C-20 at 0% wood fibre.
• Wood fibre at 5% gives PF 100% gives the peak value at 2590 Pa.
• The other CPF samples have had a lessening of flexural modulus with the increasing
percentage of wood fibre.
• The CPF sample with CPF -50% - C- 30% (50% PF + 50% CPF with 30%
Cardanol) appears to be the most stable over all of the wood fibre percentages. This blend and mix has had a more linear result with the lessening flexural modulus.
• Wood fibre at a filler percentage of 5% gives in most samples (3 of the 5) the
highest modulus.
Flexural Modulus vs Filler %
0 500 1000 1500 2000 2500 3000
0 5 10 15 20 25
Wood Fibre %
F le x u ra l M o d u lu s ( M p a )
Figure 29: Graph of all Flexural Modulus vs. Filler % Results
Table 8: All Flexural Modulus results (Pa) against wood fibre percentage Wood
Fibre %
PF - 100% CPF - 50% - C - 20%
CPF - 100% - C - 20%
CPF - 100% - C - 30%
CPF-50% - C-30%
WF - 0 1768 2112 698 1383 1413
WF - 5 2590 1633 889 813 1499
WF - 10 2339 227 800 331 972
WF - 15 1845 6 697 56 591
WF - 20 626 - 127 - 424
WF - 25 601 -8 - -
-4.3.1.2 Cardanol Flexural Modulus Results - CPF 100%
The effects on flexural modulus by Cardanol percentage for CPF 100% are:
• The increase in the percentage of Cardanol results in the decrease of flexural
modulus.
• Wood fibre in the range 5%, 10% and 15% gives a higher flexural modulus than
0% wood fibre for C-0% and C-20%.
• Within the samples, the flexural modulus falls with the increase of Cardanol
percentage.
• The modulus across all samples falls with the increase in wood fibre.
4.3.1.3 Cardanol Flexural Modulus Results- CPF 50%
The effects on flexural modulus by Cardanol percentage for CPF 50% are:
• An increase in the percentage of Cardanol results in a decrease of flexural modulus
for 0% and 5% wood fibre.
• The i