Parental Involvement in
Education
Bridget Williams, Joel Williams & Anna Ullman
BMRB Social Research
Research Report No 332
Parental Involvement in Education
Bridget Williams, Joel Williams & Anna Ullman BMRB Social Research
The views expressed in this report are the authors' and do not necessarily reflect those of the Department for Education and Skills.
Table of Contents
Executive summary ... 1
1 Introduction ... 7
1.1 Study aims... 8
1.2 Research Method ... 8
1.3 Arrangement of this report ... 9
2 Sample demographics... 10
2.1 Respondent selection and the weighted sample... 10
2.2 The weighted sample profile... 10
2.2.1 Marital status... 10
2.2.2 Respondent age... 10
2.2.3 Ethnicity... 11
2.2.4 Respondent working status... 11
2.2.5 Parents’ education... 11
2.3 Children in the household... 12
2.4 Special educational needs ... 12
2.5 Summary... 13
3 General involvement... 14
3.1 The subjective measure: how involved do parents feel? ... 14
3.2 Whether parents would like more involvement ... 16
3.3 Responsibility for education... 17
3.4 Practical involvement in child’s school... 18
3.5 Barriers to involvement... 21
3.6 Homework... 22
3.7 How often the parent helps with homework... 24
3.8 Confidence when helping with homework ... 25
3.9 Relationships with teachers ... 26
3.9.1 What parents talk about with teachers ... 27
3.9.2 Parents’ confidence when talking to teachers... 28
3.10 Attendance ... 30
3.11 School’s attitude to parents ... 31
3.12 Summary ... 33
4 Awareness and understanding of education initiatives... 34
4.1 Home School Agreement ... 34
4.3 Knowledge of school life... 39
4.4 Summary... 40
5 Communication... 42
5.1 How parents find out how child is getting on at school... 42
5.2 Quality of school’s information ... 43
5.3 How often receive written communication from school ... 44
5.4 Quality of written information... 45
5.5 Ways in which written communication could be improved... 45
5.6 External information sources ... 46
5.7 Whether found DfES sources useful... 47
5.8 Whether done anything different as a result of advice in DfES source... 47
5.9 How to get parents more involved ... 48
5.10 Summary ... 50
6 Literature review ... 51
6.1 Method ... 51
6.2 General studies on parental involvement in education ... 51
6.3 Summary... 54
6.4 References... 54
APPENDICES
Executive summary
Introduction
The Department for Education and Skills (DfES) commissioned BMRB Social Research to conduct a telephone survey of households containing children of primary or secondary school age (5-16) attending maintained schools. The survey was designed to investigate the level of involvement parents have in their children’s education and general school life.
Key findings
• Around one in three (29%) parents felt “very involved” in their child’s school life. Primary school parents were more likely to feel this way than secondary school parents. Mums were also more likely to say that they are ‘very involved’ than dads.
• Around three quarters (72%) of all parents agreed that they wanted more involvement, and a third (35%) definitely agreed. When asked about the barriers to becoming more involved parents cited the competing demands in their lives such as work commitments, demands of other children, childcare difficulties and lack of time generally.
• Almost all parents were happy with the school’s attitude towards them, with a large majority finding the school welcoming (94%) and willing to involve them (84%). Parents particularly value face-to-face contact with teachers. However, a significant minority (16%) felt that they would be labelled as ‘trouble makers’ if they talked too much.
• Parents seem largely happy with the quality of written communication coming from schools, although a significant minority (27%) felt the general information – as opposed to child-specific –was spoilt by jargon. Parents who had left school at 16 were most likely to feel this way. However, most parents (85%) were happy with the quality of information provided, saying that the school gives clear information about how their child is getting on.
• Many parents were unaware of the various labels given to recent education initiatives. More than one in three (35%) did not recognise the term ‘Home School Agreement’, despite the fact that all of them should have been invited to sign one.
Aims
The aims of the research were to establish:
• the level of involvement parents have in their children’s education, focusing on:
• practical help in schools • relationship with teachers • involvement with homework
• what parents perceive as barriers to further involvement
• the awareness of Government initiatives and information sources
• how parents find out about their child’s progress at school and what improvements they think could be made to communication with schools
Background
The Government’s strategy for involving parents in their children’s education was first described in the 1997 White Paper ‘Excellence in Schools’, which recognised that pupils need support from parents to ensure they reach their full potential. This strategy had three strands, around which the majority of the Department’s work on parental involvement is based:
• Providing information to parents. • Giving parents a more effective voice. • Encouraging families to learn together.
The Department has introduced a number of initiatives to encourage parents to become more closely involved in schools, including the following:
• Schools are required to produce Home-School Agreements, which are developed in consultation with parents. These Agreements set out the roles and responsibilities of both parents and schools in building up a partnership to raise standards in education.
• Schools are required to publish annual reports and prospectuses to allow parents to make informed decisions about their child’s education.
• Parents are encouraged to have more of a voice in the way schools are run, for instance by taking part in home-school associations, or becoming parent governors. Parent Governor Representatives have also been elected to LEA Education Committees.
• The Department has also increased the amount of information available to parents, and has made this information more easily accessible. Information is available through a special Parents’ Centre Website, as well as through a series of publications.
• There have also been a number of publicity campaigns which aim to involve parents more in their children’s education. These include campaigns encouraging involvement in reading and maths and others supporting the distribution of Parents + Schools magazine and The Learning Journey (a guide to the curriculum designed for parents).
Given that all these initiatives are designed to increase parental involvement, there is a need to measure their involvement over time. To this end, the Department for Education and Skills (DfES) commissioned BMRB to conduct a survey of parents.
Method and sample description
In order to carry out the aims and objectives outlined above, BMRB conducted a telephone survey of parents of children aged 5-16 attending state schools (England only). This survey achieved a representative sample of 2019 households containing children of primary and secondary school age (5-16). The fieldwork was carried out from 21st of November to 19th of December 2001. The survey was carried out using a probability sampling technique devised by SSI, a commercial specialist.
A screening question was used to establish household eligibility and the computer programme made a random selection among those parents (or guardians) eligible for interview. Interviewers called back a minimum of ten times in order to complete an interview once a respondent had been selected. A ‘refusals’ survey was also conducted, in which senior interviewers followed up ‘soft’ refusals and tried to convert these into interviews. In total, interviews were achieved in 56% of all identified eligible households.
Where more than one child was aged between 5 and 16 in the household, the interviewer randomly selected one as the subject of the survey where an aggregation of parental behaviour across children of different ages would have been meaningless.
Dads were much more likely than Mums to be working full time, regardless of their marital status, but seven in ten mums had paid work of some description. Just over half (54%) of parents surveyed left full time education aged 16 or younger and these parents were less likely to work full time than those who left education at a later date. A significant minority (12%) reported that their child had special educational needs, but only 1% overall said he/she attended a special school.
Other findings
Parents describing themselves as ‘very involved’ tended to provide more practical help to schools than other parents, and to be keenest on increasing their involvement. This suggests that those with the most experience of such involvement are enjoying it.
The majority (58%) of parents believed they had at least equal responsibility with the school for their child’s education. Only one in fifty (2%) felt that the responsibility belonged wholly to the school.
One in five (21%) parents claimed to have helped out in class at some point, including one in ten (9%) who claimed to do so whenever there was an opportunity. This was more common among primary school parents than among secondary school parents (28% have helped at least once, compared to 12%). Other practical involvement included helping out elsewhere in school, with fund raising, with the PTA, or with special interest groups such as sports and drama clubs. Only a tiny minority (3%) said they had never been to a parents’ evening.
Parents were much more likely to help with homework in the early years, especially as such homework may have explicitly involved them. Seven in ten (71%) parents of children in Year 1 claimed to help with every bit of homework. Understandably this decreases over time (to 5% in Year 11) but so does confidence that the parent can help. A typical reason associated with not helping with homework was that ‘teaching methods are different today’, and some parents fear they would help in the ‘wrong way’.
Six in ten (58%) parents claimed to speak ‘regularly’ to their child’s teacher(s) about at least one issue, usually the child’s progress, but a significant proportion (27%) also regularly discussed behaviour. Parents who left school at the end of compulsory education were less confident than other parents when talking to teachers, although only one in ten (9%) said they were not very / not at all confident.
However, those parents with experience of DfES information sources were significantly better informed about every term, suggesting the various ‘glossaries’ available have had some impact.
The vast majority of parents knew at least something about what to do if their child is affected by bullying (92%) or if they suspect he/she has a learning difficulty (85%). However, considerably fewer knew how to switch schools (if necessary) or what they would do if their child didn’t get the secondary school place they wanted. Even those with experience of DfES materials – while better informed than others – were unlikely to feel they ‘know a lot’ about these issues.
Parents’ evenings and written communication via pupil post are still the most common ways for parents to find out about their child’s progress at school. Test results also play a part, especially with older children, and nine in ten parents ask the child for information. Just over half (54%) claimed to have had meetings with teachers outside of the standard parents’ evening structure and many primary school parents (59%) cited informal meetings in the playground and so on. This was less common among secondary school parents (23%).
Around one in two (55%) parents were aware of at least one DfES-produced source but only half of these had actually looked at one. Parents were most likely to have looked through Parents + Schools magazine (12%), the only source with a balanced ‘user profile’. All the other sources had comparatively upmarket user profiles. Parents + Schools is also generally well received, with four fifths (80%) of parents finding it useful.
Conclusions
At the moment, only a minority of parents feel fully involved in their child’s school life. For some this is acceptable, but others want to increase their involvement substantially. However, few parents believe this can be achieved easily. Most of them are resigned to the fact that competing demands on their time will always restrict their involvement.
There is strong support for extra-curricular initiatives that enable parents to help out but there is also recognition that these kinds of projects place extra demands upon schools. Many parents have also concluded that this would require a fundamental shift in public priorities from work to home life.
welcoming, though there is little evidence of dissatisfaction with the way these schools communicate.
1 Introduction
The Government’s strategy for involving parents in their children’s education was first described in the 1997 White Paper ‘Excellence in Schools’, which recognised that pupils need support from parents to ensure they reach their full potential. This strategy had three strands, around which the majority of the Department’s work on parental involvement is based:
• Providing information to parents.
• Giving parents a more effective voice.
• Encouraging families to learn together.
The Department has introduced a number of initiatives to encourage parents to become more closely involved in schools, including the following:
• Schools are required to produce Home-School Agreements, which are developed in consultation with parents. These Agreements set out the roles and responsibilities of both parents and schools in building up a partnership to raise standards in education. They are likely to include such areas as expectations about the standards of education, the school ethos, attendance requirements, discipline, homework and the information parents and schools will give each other. These Agreements aim to engage parents in combating problems of truancy, bullying and unacceptable behaviour.
• Schools are required to publish annual reports and prospectuses to allow parents to make informed decisions about their child’s education.
• Schools are also required to make at least one report per year to parents on their child’s performance.
• Parents are encouraged to have more of a voice in the way schools are run, for instance by taking part in home-school associations, or becoming parent governors.
• The Department has also increased the amount of information available to parents, and has made this information more easily accessible. Information is available through a special Parents’ Centre Website, as well as through a number of publications. Parents +
Schools is a once-a-term magazine which provides parents with information about
ages. In addition, there are a number of topic information sheets which give parents some details about what their children are learning on a range of subjects such as science and history. The sheets offer suggestions for home-based projects which parents and children can do together.
• There have also been a number of publicity campaigns which aim to involve parents more in their children’s education. These include campaigns encouraging involvement in reading and maths and others supporting the distribution of Parents + Schools and ‘The Learning Journey’ (a guide to the National Curriculum designed for parents).
1.1 Study aims
Given that all these initiatives are designed to increase parental involvement, there is a need
to measure their involvement over time. To this end, the Department for Education and
Skills (DfES) commissioned BMRB to conduct a telephone survey of households containing children of primary or secondary school age (5-16) attending maintained schools. A similar survey was carried out in 1999 with parents of 5-11 year olds (primary school age). The new survey contained some common questions but was largely new.
The survey addressed the following areas:
• How has parents’ understanding of educational terms changed since 1999? As well as being aware of these terms, do they fully understand what the terms mean and how they apply to them and their children?
• Are parents aware of the initiatives and campaigns introduced by DfEE/DfES, and to what extent are these understood and seen as relevant to them? How important are different sources of information to parents (e.g. the child’s school, other parents, friends and family, mass media campaigns, magazines, newspapers, etc). Which are seen as most credible and which are the preferred sources of information about the child’s school? What are their views on the way in which the information was delivered, both in terms of medium and content?
• How have these initiatives impacted on parental involvement in education? Have attitudes changed since the 1999 survey, and if so, have there been changes in parental behaviour? What reasons are there for these changes in behaviour, and what can be done to further stimulate parents to become more involved in their child’s education?
1.2 Research Method
sample of telephone numbers for households in England was sourced, and households were called to screen for the presence of eligible parents. Eligible parents had at least one child aged 5-16 who attended a state school in England – just under a fifth (18%) of households where screening questions were answered were classified as containing at least one eligible parent.
Once eligibility had been established, interviewers collected details on the make-up of the household, including the number of parents1 present, and the number of children. The
computer programme then made a random selection of which parent was to be interviewed, and interviewers called back a minimum of ten times, at different times of the day and different days of the week, in order to complete an interview with that selected parent.
When answering questions about their child’s education, parents were asked to answer in the context of just one child, rather than giving views ‘on average’, perhaps thinking of children of different ages and at different stages of their school life. The computer programme made a selection of one child, and that child’s name was entered into the programme to be referred to throughout the questionnaire. For example, a parent may be asked ‘How involved do you personally feel in John’s school life’, rather than simply asking how involved they feel in their children’s school life in general.
This survey achieved a representative sample of 2019 households containing children of primary and secondary school age (5-16). The fieldwork was carried out from 21st of November to 19th of December 2001. The average interview length was 21 minutes. Full details of the sampling method, fieldwork outcomes and estimates of bias are shown in the technical appendix to this report.
1.3 Arrangement of this report
This report summarises the findings of the project. Following a chapter on sample demographics, we detail the main findings. These are divided into three chapters: 1) active involvement, 2) awareness of initiatives, and 3) communication issues. The questionnaire is appended alongside a technical appendix, which gives full methodological details. Full computer tabulations have been supplied separately.
1 For the purposes of this research, we classify step-parents or guardians as ‘parents’. However,
2 Sample
demographics
2.1 Respondent selection and the weighted sample
As far as is possible, the sample achieved in this survey is a representative sample of households containing children of primary and secondary school age (5-16) and, within each of these, one parent was randomly selected to take part in the interview. Some weights were applied to the data to correct for the greater non-response among dads.
All the findings presented in this report are based on weighted data. The total unweighted number of respondents was 2,019.
2.2 The weighted sample profile
For a household to be eligible, at least one child aged between 5 and 16 and attending state school had to be resident in the household. For a respondent to be eligible, he/she needed to have a parental or guardian’s relationship towards at least one of these children.
2.2.1 Marital status
In total, one in four (24%) of the households surveyed contained only one parent eligible for interview. The vast majority (89%) of these households were headed by women. Because of this bias, 59% of the final weighted sample is female2.
Table 2.1 Marital status
% of sample
Parents from single parent households 24% Single dads 3% Single mums 21% Parents from two parent households 76% Partnered dads 38% Partnered mums 38%
All mums 59%
All dads 41%
Base: all (2019)
2.2.2 Respondent age
In terms of age, the sample is fairly homogeneous. This was to be expected, given that children’s ages formed the basis of the eligibility criteria. More than half (55%) of the
2 Clearly, parents who do not live with their children are not represented in this sample. It was felt
parents surveyed were aged between 35 and 44, with 19% older, and 26% younger. Only a tiny minority were under 25 years old (1% of the sample), or over 54 (2% of the sample).
2.2.3 Ethnicity
Eighty six per cent of the sample described themselves as White British but, of the remaining 14%, only 6% specifically described themselves as being from non-white ethnic minorities. These are very similar figures to those collected from the most recent government surveys (e.g. BCS). One in twenty (5%) reported that English was not their first language, including two thirds of Asians surveyed3.
2.2.4 Respondent working status
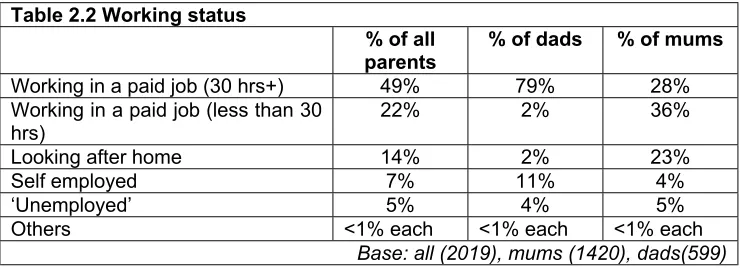
Overall, 49% of parents worked full time (30 hours or more), a further 22% worked part time, and 7% described themselves as self-employed. Only one in four (22%) did not work.
[image:15.595.112.482.442.577.2]Dads were much more likely than mums to be working full time, regardless of whether they are single parents or part of a two parent household. Eighty per cent of partnered dads worked full time and two thirds (68%) of single dads did the same. In contrast, only 28% of partnered mums worked full time and a similar proportion of single mums (29%) did the same. However, seven in ten (69%) mums did some work, though mostly part time.
Table 2.2 Working status
% of all
parents % of dads % of mums
Working in a paid job (30 hrs+) 49% 79% 28% Working in a paid job (less than 30
hrs) 22% 2% 36%
Looking after home 14% 2% 23% Self employed 7% 11% 4%
‘Unemployed’ 5% 4% 5% Others <1% each <1% each <1% each
Base: all (2019), mums (1420), dads(599)
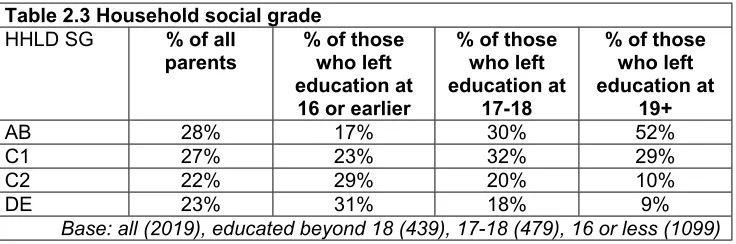
2.2.5 Parents’ education
Just over half (54%) of this sample of parents left full time education aged 16 or younger, and only one in four (23%) stayed in education beyond 18. The later the parent left education, the more likely he/she was working full time. Six in ten (61%) parents who left
3 There was no translation provision for parents who lacked sufficient English to complete the
education aged 19 or older worked in full time employment, compared to just 45% of parents who left aged 18 or younger. There is a similar pattern with household social grade – a variable derived from the economic status of the chief income earner in the household – with better educated parents living in households with higher social grades. Overall 28% of parents were classified AB but this goes up to 52% of those who left education aged 19 or older.
Table 2.3 Household social grade
HHLD SG % of all
parents % of those who left education at 16 or earlier
% of those who left education at
17-18
% of those who left education at
19+
AB 28% 17% 30% 52%
C1 27% 23% 32% 29%
C2 22% 29% 20% 10%
DE 23% 31% 18% 9%
Base: all (2019), educated beyond 18 (439), 17-18 (479), 16 or less (1099)
2.3 Children in the household
As well as randomly selecting the respondent, the interviewer performed a random selection of all children resident in the household attending state school in Years 1-11. This child was then used as the subject of the survey where an aggregation of behaviour across children of different ages would have been meaningless. This produced a very balanced sample, with a minimum of 150 interviews focused on children from each School Year, and these evenly balanced between boys and girls.
In nearly half of households (47%), there was only one eligible child, in 40% there were two, and in a small minority of households (13%) there were three or more eligible children. In addition, just over one in four (27%) households contained children younger than the minimum eligible age, and one in six (16%) contained children older than the minimum age, though this included some who are technically adults (aged 18+).
2.4 Special educational needs
Twelve per cent of parents reported that the child selected as the subject of the interview had special educational needs (SEN), although this rose to 17% among parents living in households graded DE. It is also notable that, where the selected child was a boy, 15% of parents reported SEN, compared to only 8% when the selected child was a girl4.
Less than half (45%) of parents who reported their child as having SEN said their child had a ‘statement’ of special needs. One in ten (11%) did not know if the child had such a statement but nearly half (44%) were sure the child did not. Again, just as parents were more likely to say that their son had special educational needs, they were also more likely to say he had a statement. In total, when boys were the subject of discussion, 8% of parents reported that their child had a statement of SEN. The relevant figure for girls was only 3%. The vast majority (91%) of children with SEN attended a mainstream school. In total, only twenty one children attended a special school (1% of the full sample).
2.5 Summary
One quarter of households surveyed contained only one eligible parent, and most of these were headed by women. In total, 59% of the weighted sample of parents is female. The age profile is fairly homogeneous with more than half aged between 35 and 44.
Dads were much more likely than mums to be working full time, regardless of their marital status, but seven in ten mums had paid work of some description. Just over half of parents surveyed left full time education aged 16 or younger and these parents were less likely to work full time.
3
General involvement
At least half of the questionnaire collected information about what parents actually do when they involve themselves in their child’s school life. There are a number of different measures, some subjective, some more objective. These include:
• How involved do parents feel? And do they want more involvement? • What do parents do to help the school?
• How much do parents help with homework?
• What kinds of relationship do parents have with their children’s teachers?
The questionnaire also investigated the perceived barriers to further involvement. This chapter deals with each of these in turn. Before moving on, it is important to note once again that each parent was asked to focus on one child only when considering their answers. This method was adopted because it is difficult for a respondent to answer questions precisely if he/she is forced to ‘average’ across children at very different stages of school life. This child was randomly selected at the start of the interview and referred to by name throughout.
3.1 The subjective measure: how involved do parents feel?
The interviewer asked parents how involved they feel before asking what he/she actually does to get involved. Respondents answered the question without having been subjected to a series of prompts about the kinds of thing we considered to be ‘involvement’.
The question was:
“How involved do you personally feel in your child’s school life?”
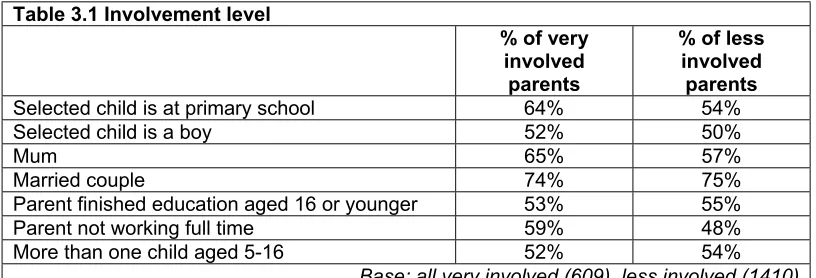
Just under one in three parents (29%) claimed to be ‘very involved’ but most (56%) opted for the middle ground and claimed to be ‘fairly involved’. Only 13% described themselves as ‘not very involved’, and only 2% said they were ‘not at all involved’.
On most measures of practical involvement there is a noticeable difference in response between those parents claiming to be very involved and those describing themselves as fairly involved. However, there is very little difference in response between those describing themselves as fairly involved and those describing themselves as not very involved. Therefore, it is important to compare the demographic profiles of ‘very involved’ parents with those who are less involved.
However, the number of school-age children in the household, the particular sex of the selected child, and the respondent’s own level of education seem to make little difference to this measure.
Table 3.1 Involvement level
% of very involved
parents
% of less involved parents
Selected child is at primary school 64% 54% Selected child is a boy 52% 50%
Mum 65% 57%
Married couple 74% 75% Parent finished education aged 16 or younger 53% 55% Parent not working full time 59% 48% More than one child aged 5-16 52% 54%
Base: all very involved (609), less involved (1410)
Parents’ feeling of greater involvement with primary school children is, to some extent, perfectly reasonable. ‘Involvement’ may encompass simple interest in the child’s progress, actual help given to the child (specifically with homework), or involvement with school activities. While the parent’s interest is unlikely to decline as the child progresses through school, the increasing complexity of the school work will limit the practical help a parent can give their child. Furthermore, older children tend to want less involvement from their parents in any aspect of their lives, including school. They may actively shut the parent(s) out.
However, it is difficult to draw conclusions about which demographic factors – if any – have a direct influence on involvement. For instance, it is not clear whether mums are intrinsically more involved than dads, or simply more involved because they are less likely to be working full time.
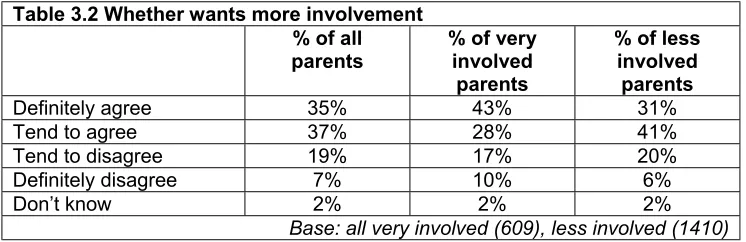
3.2 Whether parents would like more involvement
Parents were also asked to agree or disagree with this statement:
“I would like to be more involved in my child’s school life”
In total, nearly three quarters (72%) of parents agreed that they would like more involvement, but only a third (35%) ‘definitely’ agreed. One quarter (26%) did not want any more involvement, including 7% who definitely disagreed with the statement. However, this does not mean they wanted less involvement, only that their current involvement level is sufficient.
[image:20.595.111.484.395.516.2]The 37% who ‘tend to agree’ with the statement are unlikely to push for more involvement. Interestingly, those parents who were already ‘very involved’ were those who most firmly wanted more involvement. More than four in ten (43%) definitely wanted more involvement compared to just 31% of less involved parents. This suggests that those with most experience of involvement are enjoying it. As noted earlier, fairly involved parents were no more committed than not very / not at all involved parents (31% of the former definitely wanted more involvement, compared to 33%of the latter).
Table 3.2 Whether wants more involvement % of all
parents % of very involved parents
% of less involved parents
Definitely agree 35% 43% 31% Tend to agree 37% 28% 41%
Tend to disagree 19% 17% 20% Definitely disagree 7% 10% 6%
Don’t know 2% 2% 2%
Base: all very involved (609), less involved (1410)
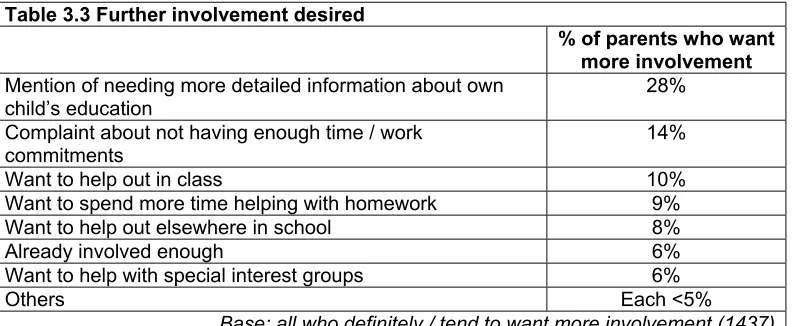
A small proportion of parents expressed an interest in some specific forms of further involvement, including 10% who wanted to help out in class, 9% who specifically mentioned that they would like to spend more time helping with homework, 8% who wanted to help out elsewhere in school, and 6% who wanted to help with special interest groups (like sports or drama clubs). Most of these parents had never done these things before. Small minorities were even more specific, wanting to help children with special educational needs or with literacy problems.
Table 3.3 Further involvement desired
% of parents who want more involvement
Mention of needing more detailed information about own child’s education
28% Complaint about not having enough time / work
commitments 14%
Want to help out in class 10% Want to spend more time helping with homework 9% Want to help out elsewhere in school 8% Already involved enough 6% Want to help with special interest groups 6%
Others Each <5%
Base: all who definitely / tend to want more involvement (1437)
As with most open-ended questions, it is difficult to draw conclusions about the problems and needs of different sub-groups of parents. Predictably, parents in full time employment were more likely to mention time constraints or work commitments (20% compared to 10% of non-full time workers) and very involved parents were less likely to require information than less involved parents (22% compared to 30%). However, although interviewers probe as far as possible, he/she can only record what the respondent chooses to say, rather than prompting with specific issues. This means that the figures probably under-represent the total number of parents concerned with each issue, while giving a good picture of what concerns them most.
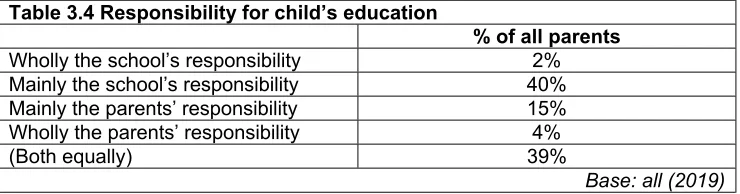
3.3 Responsibility for education
Before moving on to what parents currently do to help with their child’s education, it is worth pausing a moment to bring in the results from one of the attitude statements presented to parents near the beginning of the questionnaire.
“Thinking in general about children and education, would you say that a child’s education is… [wholly the school’s responsibility, mainly the school’s responsibility, mainly the parents’ responsibility, or wholly the parents’ responsibility]?”
other. Despite this approach, nearly four in ten (39%) of parents refused to pick one or the other and insisted that responsibility was equal. Those who did take one of the presented positions tended to believe a child’s education was more the school’s responsibility than theirs. However, very few picked an extreme position. Only 2% believed it was wholly the school’s responsibility, and 4% wholly the parents’. In total, three in five (58%) parents believed they have at least equal responsibility for their child’s education5.
Table 3.4 Responsibility for child’s education
% of all parents
Wholly the school’s responsibility 2% Mainly the school’s responsibility 40% Mainly the parents’ responsibility 15% Wholly the parents’ responsibility 4% (Both equally) 39%
Base: all (2019)
Interestingly, the percentage who believe a child’s education is wholly or mainly the parents’ responsibility varies only slightly between sub-groups. However, when the percentage claiming equal responsibility is added, some differences can be discerned. Mums were more likely than dads to ascribe equal or greater responsibility to parents (60% compared to 54%), and there are similar skews in the data from very involved parents and those with experience of recent DfES materials. However, the response from AB parents is anomalous. They were less likely than other parents to ascribe this responsibility to parents (52% compared to 60%) despite tending to be slightly more involved with both their child’s school and with homework (despite being more likely to work full time), and having more experience of DfES materials.
3.4 Practical involvement in child’s school
Parents were also presented with a series of specific practical activities and asked which they do ‘whenever there is an opportunity’, which they do ‘sometimes’ and which they never do. This scale was adopted because of the activities’ different frequencies of opportunity. The aim was to find out how far parents’ perception of their own involvement is linked to practical activity helping the school (as opposed to just their own child). This is an objective measure of involvement, but not the only one.
5 A similar question was included in the 1999 survey but the statement was worded differently: “It is
The practical activities were:
• Going to parents’ evenings • Helping out in class
• Helping out elsewhere in school (for example in the library, dinner duties, school trips and so on)
• Helping with fund-raising activities
• Helping with special interest groups like sports or drama clubs • Involvement in PTA
Clearly, these activities demand different amounts of commitment. For instance, almost everybody (84%) claimed to go to parents’ evenings whenever there is an opportunity, and two thirds (70%) had been involved in fund-raising activities at some point. Other activities may require more of an effort on the part of parents.
[image:23.595.111.484.429.561.2]One fifth (21%) had helped in the classroom itself, including a core 9% who do so whenever they can. A slightly larger percentage (33%) had helped out elsewhere on the school premises (e.g. in the library, dinner duties etc.). There is quite a lot of crossover between these two activities. Seventy per cent of those who had helped out in class had also helped out elsewhere in the school, and 46% vice versa.
Table 3.5 Practical involvement
% whenever there is an
opportunity % sometimes
% never / don’t know
Parents’ evenings 84% 13% 3% Fund-raising activities 30% 39% 31% Help in school outside of class 15% 18% 67% PTA 13% 16% 71% Special interest groups 10% 12% 78% Help in class 9% 12% 79%
Base: all (2019)
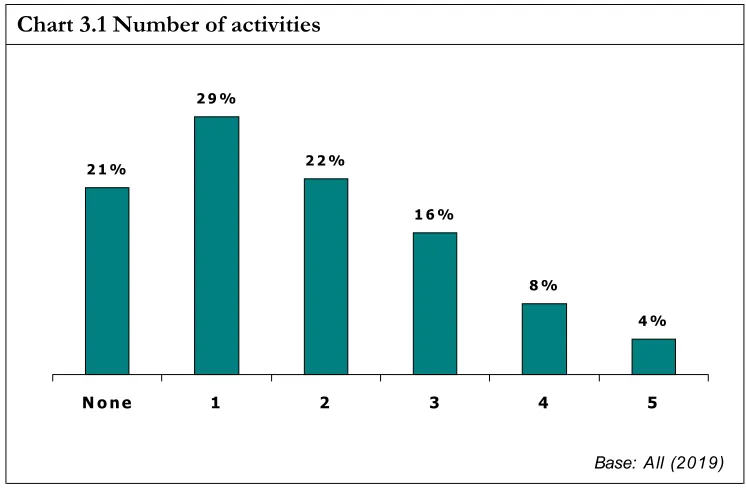
Given the high probability that many parents do more than one activity, a numeric variable has been created to give a rough segmentation in terms of parents’ activity within school6.
Excluding parents’ evenings – attendance at which is routine – we find that one in five (21%) parents had never done any of the other five activities. At the other extreme, 4% of parents claimed to have taken part in all five!
6 Each parent was given a number equal to the number of activities which he/she does ‘whenever
Chart 3.1 Number of activities
2 1 %
2 9 %
2 2 %
1 6 %
8 %
4 %
N o n e 1 2 3 4 5
Base: All (2019)
[image:24.595.109.482.70.314.2]It is interesting to further cross this variable with the subjective measures of involvement dealt with earlier. Table 3.6 shows that, on average, very involved parents had taken part in 2.3 types of activity but, while this declines with involvement level, we still find that 60% of those parents who described themselves as not very or not at all involved had taken part in at least one activity.
Table 3.6 Practical activities and self-assessed involvement level Number of activities
ever taken part in % of very involved parents
% of fairly involved
parents
% of less involved parents
0 11% 21% 40%
1 22% 31% 34%
2 23% 23% 15%
3 21% 16% 7%
4 14% 7% 1%
5 9% 2% 2%
mean 2.3 1.6 1.0
Base: all very involved parents (609), fairly involved (1115), less involved (295)
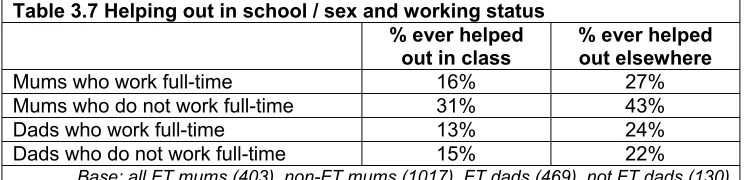
Table 3.7 Helping out in school / sex and working status % ever helped
out in class % ever helped out elsewhere
Mums who work full-time 16% 27% Mums who do not work full-time 31% 43% Dads who work full-time 13% 24% Dads who do not work full-time 15% 22%
Base: all FT mums (403), non-FT mums (1017), FT dads (469), not FT dads (130)
Another factor that may affect a parent’s involvement in school activities is his/her own experience of school. Although no qualitative data was collected, it is notable that those who stayed in education beyond the statutory minimum of 16 were more likely to have been involved. This may well reflect a more positive experience of their own school days. Parents who stayed in education were more likely to be in full-time work so it is best to compare non-full time workers together. One third (33%) of those staying on beyond 16 had helped out in class, and half (49%) had helped out elsewhere. This compares with 24% and 33% respectively among parents who left at 16. This last group make up 54% of the full sample but this will reduce over time as more people stay in education beyond 16. However, they are not necessarily staying on at school so it is not possible to infer that involvement in school activities will increase naturally in response to longer periods spent in education.
A final factor is the school year of the child. It has already been noted that parents feel less involved when the child is at secondary school. This is matched here as well: just over a quarter (28%) had helped out in a primary school classroom (including 12% who claimed to take every opportunity), compared to 12% who had helped out in a secondary school classroom. However, given the increased complexity of the work, this still seems high, especially as 5% claimed to help whenever there is an opportunity. It is possible that a minority answered hypothetically – i.e. they would take every opportunity if offered – but the question is not especially ambiguous, so we can only assume this data is correct. It is, however, worth noting that the frequency of opportunity in secondary schools is probably lower than in primary schools, so the percentages saying they help ‘whenever there is an opportunity’ are not directly comparable.
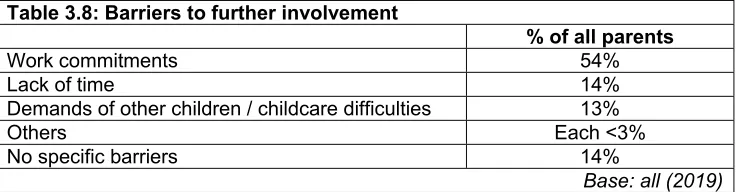
3.5 Barriers to involvement
Respondents were asked what prevented their further involvement. The precise question wording was:
“Is there anything that stops you getting involved with <child>’s school life?”
child’s school, or difficulties with the style of education. Most parents focused exclusively on the competing demands in their own lives. Three quarters (75%) of full time workers explicitly mentioned work commitments, and 14% of parents simply cited ‘lack of time’. It is also noticeable that the demands of other children or problems with childcare impact heavily on those with very young children. This was mentioned by a third (34%) of parents with children under 5. Other factors may well prove to be barriers to further involvement - there is no reason why parents should recognise them all – but the response to this question gives a good indication of what is ‘top of mind’. The main problem, as far as parents were concerned, is one of time.
Table 3.8: Barriers to further involvement
% of all parents
Work commitments 54% Lack of time 14% Demands of other children / childcare difficulties 13%
Others Each <3%
No specific barriers 14%
Base: all (2019)
3.6 Homework
Two other elements of parental involvement were also included in the questionnaire: helping with homework and the relationship parents have with teachers. These are probably the key elements of involvement since only a minority were closely involved in activities within the school itself.
The first question was:
“How often does <child> get homework?”
Chart 3.2: Amount of Homework
28% 26% 31%
20% 19% 16%
57% 54%
47% 52% 53%
Y 1 Y 2 Y 3 Y 4 Y 5 Y 6 Y 7 Y 8 Y 9 Y 1 0 Y 1 1
% e v e ry d a y % m o s t d a y s
Base: All w here selected child in School Year (n varies - 157 to 229) (43%)
(50%) (56%) (47%)
(61%) (63%)
(92%) (90%)
(85%) (88%) (87%)
The most noticeable aspect of the chart is the absence of a smooth curve showing more homework as a child gets older. There is a gentle increase in regular homework between Years 1 and 6 (covering Key Stages 1 and 2), followed by a sudden leap between Years 6 and 7 (as Key Stage 3 begins). Thereafter, there is no increase either in the percentage claiming the child has homework ‘every day’ or the overall percentage for ‘regular’ homework. Homework in Years 1 and 2 would mainly consist of reading or sharing a book with a parent or carer and therefore it is important to recognise that these data are dependent upon parents’ awareness of the amount of homework their child gets and on parental perception of what constitutes homework.
Therefore, the overall amount of homework set over a week or a fortnight might be the same, but is distributed differently - Thus, ‘most days’ could be interpreted as ‘regular’ homework.
The same question was asked in the 1999 survey, although only to primary school age children (aged 5-11). A third (31%) of parents believed their child got homework every day, and a similar number (32%) said ‘most days’. This survey found lower figures of 24% and 29% respectively among the same age group. The two samples are not directly comparable because of the different respondent selection procedures (see technical appendix) but is, at least, an indication that parents were not observing more homework in 2001.
3.7 How often the parent helps with homework
A similar chart to chart 3.2 is displayed below, this time showing how often parents help with homework when the child gets it. This time, there is an explicable curve: parents are much more likely to help in the early years than in the later years, and the decline in involvement is steady year-by-year, apart from the very final year when the child will take GCSEs. It also supports the hypothesis that homework in the early years explicitly involves parents (71% help every time in Year 1) while, in later years, ‘help’ may be limited to encouragement. However, helping every time or most times in later years may involve more time because the child gets a greater volume of more complex homework.
Chart 3.3 How often parent helps with Homework
71% 61%
49% 45% 40%
26%
16% 10%
5% 4% 6%
Y 1 Y 2 Y 3 Y 4 Y 5 Y 6 Y 7 Y 8 Y 9 Y 1 0 Y 1 1
% e v e ry t im e % m o s t t im e s
Base: All w here selected child in School Year and gets hw k (n varies - 152 to 217) (86%) (84%)
(79%) (77%) (68%)
(58%)
(41%) (34%)
(21%)
There are a couple of other notable differences that are not linked to the age of the child. Dads help less often than mums, even taking into account their greater likelihood of working full time. Looking only at parents who do not work full time, forty per cent of mums helped said they help ‘every time’ compared to just 25% of dads. As in other measures, we recorded no difference between full time working dads and non-full time working dads but significantly greater activity among non-full time mums than among full time mums (40% help ‘every time’ compared to 31%). It is also notable that parents with experience of DfES materials help more often than those with no experience (37% helped every time compared to 30%).
3.8 Confidence when helping with homework
There are various natural reasons why parents are less likely to help with older children’s homework but chart 3.4 shows that their confidence when helping with homework also declines the older the child gets. This almost certainly reflects the greater complexity of homework. Nonetheless, we still find that more than half (55%) of parents say they are at least confident ‘most of the time’ when helping a child in Year 11.
Chart 3.4 Confidence when helping homework
74%
60% 55%
44% 43% 37%
23% 18% 21% 19% 14%
Y 1 Y 2 Y 3 Y 4 Y 5 Y 6 Y 7 Y 8 Y 9 Y 1 0 Y 1 1
% a lw a y s % m o s t o f t h e t im e
Base: All w here parent helps selected child w ith hw k (n varies - 148 to 216) (96%) (94%) (91%) (89%)
(84%) (79%)
(70%) (69%) (63%)
(54%) (55%)
Table 3.9 Confidence in helping with homework
% dads % mums
Always confident 46% 34% Confident most of the time 39% 39% Confident some of the time 13% 22% Never confident 0% 2% Depends what it is 2% 2%
Base: all who help with homework (1894), dads (559), mums (1335)
Similarly, parents who stayed in education longest were most confident but no more likely to help.
Around one in five (21%) parents were sometimes or never confident helping with homework and they were asked why that is. The interviewers did not prompt them in any way. Most respondents said the same thing: they feel too distant from the kinds of work their children do. Four in ten (41%) said that they didn’t understand modern teaching methods. Others (16%) explained that they weren’t taught certain subjects when they were at school. A surprisingly large number (38%) admitted that they ‘don’t understand’ the work their child does. It should be borne in mind that this group of parents is skewed towards those with older children. The work these children do is more complex and their parents attended school longer ago.
Table 3.10: Reasons for not feeling confident
% of parents who sometimes/never feel confident helping with
homework
Different teaching methods these days 41% Don’t understand the work my child does 38% Wasn’t taught certain subjects at school 16% Might confuse child if do it wrong 8% Mention of particular subject(s) where parent is not
confident
5%
Others Each <3%
Base: all who sometimes / never feel confident helping with homework (437)
3.9 Relationships with teachers
[image:30.595.89.499.415.559.2]3.9.1 What parents talk about with teachers
Early in the interview, all parents were presented with a list of possible discussion subjects and asked how often they talk with their named child’s teacher about each. The subjects were:
• How the child is doing in class • Child’s behaviour at school
• Relationships with other children (perhaps bullying or other issues) • Child’s involvement in sport or other extra-curricular activities
Nearly six in ten (58%) regularly spoke with teachers about at least one subject, with primary school parents more likely to than secondary school parents (62% compared to 53%). Predictably, parents who assessed themselves as ‘very involved’ had significantly more contact with teachers than other parents. Nearly three quarters (74%) of very involved parents claimed to speak to teachers regularly on at least one subject, compared to 55% of ‘fairly involved’ parents and 39% of ‘not very/not at all involved’ parents. Overall responses for each subject are shown in chart 3.5.
Chart 3.5 What parents talk about with teachers
4 6 %
2 7 %
2 1 %
2 0 %
2 9 %
2 9 %
3 0 %
3 2 %
2 2 %
2 6 %
2 2 %
2 2 %
1 9 %
2 7 %
2 6 % 3 % H o w c h ild is
d o in g in c la s s
C h ild ' s b e h a v io u r
Re la tio n s h ip s w / o th e r c h ild re n
In v o lv e m e n t in o th e r a c tiv itie s
% re g u la rly % o c c a s io n a lly % 1 /2 t im e s in 1 2 m t h s % n e v e r/D K
Base: All (2019)
Just under one in two (46%) parents claimed to regularly talk to teachers about how their child is doing in class, with a further three in ten (29%) talking about this occasionally. However, 3% of parents claimed to never talk with their child’s teacher about their child’s progress in class.
children with Special Educational Needs (SEN) most likely to talk about this regularly (44% compared with 24% of parents of other children). Related to this, one in five (21%) parents claimed to regularly talk about their child’s relationships with other children (perhaps bullying or other issues), and parents of children with SEN were again more likely to talk about this regularly (32% compared with 19% of other parents).
One in five (20%) regularly discussed their child’s involvement in sport or other extra-curricular activities. In addition, 15% of parents claimed to regularly speak to parents about other subjects. Subjects mentioned included the child’s personality, homework, health concerns or specific subjects such as maths or literacy. Small numbers of parents said they talk to their child’s teachers about problems at home (2% of the sample).
Although mums who were not working full time were notably more likely to be involved with their child’s school on practical matters (such as helping in class, with fundraising, etc.), they were no more likely to say that they talk regularly with their child’s teachers about any of the subjects shown above
[image:32.595.78.488.424.536.2]It therefore appears that the frequency of communication with the child’s school is largely driven by need to talk with the teacher (in the case of parents of children with SEN), or because opportunities regularly arise (in the case of parents of primary school children).
Table 3.10 What primary and secondary school parents talk to teachers about regularly
% of parents who talk regularly about:
Parents with a selected child in
Primary School
Parents with a selected child in Secondary School How child is doing in class 51% 39% Child’s behaviour 27% 26% Relationships with other children 22% 20% Involvement in other activities 20% 20%
Base: all primary school parents (1158), secondary school parents (861)
3.9.2 Parents’ confidence when talking to teachers
All parents who ever talk to their child’s teachers were asked how confident they feel when talking with the teacher. Chart 3.6 shows that the vast majority of parents felt confident talking to teachers, with over half saying they feel ‘very confident’. However, there is some notable variation in confidence.
school after completing their compulsory education, as these comprise half of the population of parents.
Chart 3.6 Confidence when talking with teachers
5 5 %
4 8 %
5 8 %
6 7 %
3 8 %
4 2 %
3 8 %
2 9 %
6 %
2 % 3 % 9 %
A L L
1 6 o r le s s
1 7 -1 8
1 9 +
V e ry c o n f id e n t F a irly c o n f id e n t N o t v e ry / n o t a t a ll c o n f id e n t
Base: All w ho talk to teachers (1991), w ith TEA 16 or less (1077), 17-18 (476), 19+ (436)
There were few other demographic differences in levels of confidence, although parents of children with SEN were slightly less likely to say that they feel very or fairly confident (89% compared with 94% for other parents).
[image:33.595.110.484.116.319.2]However, such parents comprise half of those describing themselves as ‘very involved’ in their child’s school and these parents were more likely to say they feel confident in talking with their child’s teachers. It may be that they are more likely to get involved because they feel more confident, although it may also be true that their involvement has helped them to feel more confident in communicating about their child’s education. The flipside is that parents who left at 16 and did not describe themselves as very involved are much less confident than other groups: only 41% were ‘very confident’ compared to 57% of those who left later.
Table 3.11 Confidence when talking with teachers
% of very involved
parents
% of fairly involved
parents
% of not very / not at all involved parents
Very confident 71% 50% 44% Fairly confident 25% 44% 41% Not very confident 2% 5% 10%
Not at all confident 1% 1% 2% Depends on teacher 1% 1% 1%
Don’t know 0% 0% 1%
In addition, it is clear that more confident parents tend to talk to teachers more regularly about most aspects of their child’s education, the only exception being their child’s behaviour.
The 1999 study conducted by MORI found that just under a quarter (22%) of parents of primary school children worried that they might be labelled a ‘troublemaker’ if they talked too much to teachers. This question was also asked in 2001, but fewer (14%) parents of children in primary school agreed with this statement, and only 4% definitely agreed. Parents of children in secondary school held similar views, although they were slightly more likely to feel this way (18% agreed, 7% definitely).
[image:34.595.83.512.353.507.2]Less confident parents and parents who were least involved in their child’s education were also more likely to agree that if they talk too often to teachers at their child’s school they will be labelled a troublemaker. It may be that they are less involved and therefore less confident about their child’s education because they are worried about being labelled a troublemaker.
Table 3.12 ‘If I talk too often to teachers at my child’s school, I will be labelled a trouble maker’
% of very confident parents
% of fairly confident parents
% of not very / not at all confident
parents
Definitely agree 6% 4% 14% Tend to agree 8% 12% 20% Tend to disagree 25% 33% 25% Definitely disagree 59% 47% 37% Don’t know 3% 3% 3%
Base: all who talk to teacher – very confident (1072), fairly confident (774), not very/not at all confident (123)
3.10 Attendance
Table 3.13 Importance of making sure child attends school regularly and on time
% of total sample
1 – not at all important 2
3
1%
4 3% 5 – extremely important 96%
Base: all 2019
However, almost immediately afterwards, just under half (49%) of all parents said that they would be happy to take their child out of school during term time, for example for a summer holiday. Parents who left education aged 16 were more likely to agree with this than those who completed their education later (53% compared to 45% of those who left later), although they were no less likely to believe attendance to be extremely important.
[image:35.595.109.449.101.212.2]In addition, parents of children in primary school were more likely to feel that it is acceptable to take their child out of school during term time than parents of children in secondary school (53% compared to 44%).
Table 3.14 Whether would take child out of school during term time % who think it
acceptable
% who do not think it acceptable
% who think it depends on circumstances
ALL 49% 43% 8%
Left education at 16 or younger 53% 40% 8% Left education at 17-18 49% 44% 7% Left education at 19+ 41% 51% 8% Primary school parent 53% 39% 8% Secondary school parent 44% 48% 8%
Base: all (2019), TE:16 or under (1099), 17-18 (479), 19+ (439), primary school parents (1158), secondary school parents (861)
3.11 School’s attitude to parents
As well as discussing parents’ relationships with their child’s school, the interviewer also asked how they see the school’s attitude towards them. The interviewer presented two statements about the school’s attitude and asked parents how far they agreed or disagreed with each one. The statements were:
• ‘I find my child’s school welcoming to parents’
• ‘My child’s school makes it easy for me to be involved in his/her education’
[image:35.595.84.492.403.546.2]Chart 3.7 School’s attitude towards parents
6 7 %
4 8 %
2 6 %
3 8 % 9 % 4 %2 %
5 % I fin d m y c h ild ' s
s c h o o l w e lc o m in g to
p a re n ts
M y c h ild ' s s c h o o l m a ke s it
e a s y fo r m e to b e in v o lv e d in
h is /h e r e d u c a tio n
% d e f in it e ly a g re e % t e n d t o a g re e
% t e n d t o d is a g re e % d e f in it e ly d is a g re e
Base: All (2019)
Most parents were largely happy with the school’s attitude towards them. Two thirds (67%) definitely agreed that they find their child’s school welcoming to parents, with only 6% disagreeing. Similarly, the vast majority (85%) agreed that their child’s school makes it easy for them to be involved in their education, and just under half (48%) ‘definitely’ agreed. However, this time more parents (13%) disagreed with the statement, with 5% definitely disagreeing. These responses chime with those collected when the interviewer asked about the barriers to further involvement. Few explicitly complained about the school then.
Parents of children in secondary school were slightly less positive about the school’s attitude towards them than parents of children in primary school. While 72% of primary school parents definitely agreed that the school was welcoming, only 61% of secondary school parents felt the same. Similarly, only 41% of secondary school parents agreed that their child’s school makes it easy for them to be involved in their education, compared to 53% of primary school parents. In addition, parents who do not feel very involved or confident in communicating with the school’s teachers tended to be much less positive about schools. Parents of children with SEN were also less positive.
3.12 Summary
Around one in three parents felt very involved in their child’s school life, though primary school parents were more likely to feel this way than secondary school parents. Those describing themselves as ‘very involved’ tended to provide more practical help to schools than other parents, and to be keenest on increasing their involvement. Most of those who felt they weren’t involved enough cited time pressures, especially from work.
The majority (58%) of parents believed they had at least equal responsibility with the school for their child’s education, though only one in five felt they had more responsibility than the school.
One in five parents claimed to have helped out in class at some point, including one in ten who claimed to do so whenever there was an opportunity. This was more common among primary school parents than among secondary school parents. Other practical involvement included helping out elsewhere in school, with fund raising, with the PTA, or with special interest groups such as sports and drama clubs. Only a tiny minority (3%) admitted they had never been to a parents’ evening.
Parents were much more likely to help with homework in the early years, especially as such homework may explicitly involve them. Understandably this decreases over time but so does confidence that the parent can help. A typical complaint is that teaching methods are different today, and some parents fear they will help in the ‘wrong way’.
4
Awareness and understanding of education initiatives
The Department has introduced a number of new educational initiatives over recent years, and the 1999 MORI project sought to establish awareness of these initiatives. In 2001, we again asked parents whether they had heard of a number of initiatives, and this chapter reports on their awareness, and what they understand about these initiatives.
4.1 Home School Agreement
The Home School Agreement is a partnership document drawn up by the school - in consultation with parents –which parents and teachers, and in some cases children, are invited to sign. It sets out what is expected of pupils and parents and how the school approaches teaching, learning and behaviour. All parents should be asked to sign one of these.
All parents were asked if they had heard of a Home School Agreement, and just under two thirds (65%) had, although only three in ten (29%) parents said that they knew a lot about it. Over a third (35%) had never heard of the term, which is somewhat concerning given that all parents should have been invited to sign a Home School Agreement in respect of their child. However, it may be the case that the other parent had signed the agreement and, indeed, dads were more likely than mums to say that they had never heard of the agreement (47% compared to 27%). It is also possible that some schools have given their Home School Agreement a different name.
There were no differences in awareness between parents of children of different ages. Parents who had looked at some of the information sources produced by DfES (e.g. Parents
+ Schools Magazine, DfES parents websites) were more likely to say they know a lot about
[image:38.595.109.487.580.689.2]the Home School Agreement (46% knew a lot).
Table 4.1 Awareness of Home School Agreement
% of all parents % seen DfES
information source
Know a lot about it 29% 46% Know a little about it 27% 30% Heard of it only 8% 6% Never heard of it 35% 18%
Base: all (2019), seen DfES sources (529)
Agreement, compared with a third (36%) of their counterparts in 2001 who had never heard of the term. While the samples are not directly comparable, it seems that there have not been any improvements in awareness over the past two years.
All parents who said they had heard of the term were asked to describe what it means. Their responses were recorded verbatim and some are shown below:
“An agreement between the parents, the pupil and the school”
“The parents have to take responsibility for… attendance, homework etc.. The child has to take responsibility for homework and behaviour”
“The child agrees to behave in a way acceptable to the school, and the school agrees to put the child’s education first…”
“All about school rules, uniform and so on. It gives details about how much homework is expected at each level”
“It’s a paper exercise and it serves no purpose”
“Your part of the bargain is to check for head lice and homework”
4.2 Awareness of other terms
Parents were also asked how much they knew about other terms related to their child’s school life. Chart 4.1 shows awareness of terms related to the curriculum.
Chart 4.1 Awareness of curriculum terms
3 8 %
3 6 %
3 4 %
3 3 %
5 1 %
4 9 %
4 5 %
4 6 % 1 0 %
1 4 %
1 1 %
8 % 6 %
7 %
4 %
7 %
N ational C urriculum
S A Ts
S chool Perfor. Tables
Key S tages
% K n o w a lo t % K n o w a lit t le % H eard t erm o n ly % N ev er h eard o f
[image:39.595.110.486.485.736.2]