Training and progression
in the labour market
by
Sin Yi Cheung and Stephen McKay
Research Report
This research reviews recent trends on training, and seeks to uncover the link between training and changes in employment characteristics. Specifically, it looks for a relationship between undertaking training and gaining, retaining and advancing in employment.
The report does find a small effect on wages of undergoing training, and also increases in the rate of retention and moving into paid work. However, the incidence of training appears to be falling (which may be reflecting higher unemployment), except among older workers.
If you would like to know more about DWP research, please contact: Paul Noakes, Commercial Support and Knowledge Management Team, 3rd Floor, Caxton House, Tothill Street, London SW1H 9NA
http://research.dwp.gov.uk/asd/asd5/rrs-index.asp
Research Report No. 680 ISBN 978-1-84712-806-5 D W P R e se a rc h R e p o rt N o . 6 8 0 T r a in in g a n d p ro g re s s io n in t h e la b o u r m a r k e t
Department for Work and Pensions
Research Report No 680
Training and progression in
the labour market
Sin Yi Cheung and Stephen McKay
© Crown Copyright 2010. Published for the Department for Work and Pensions under licence from the Controller of Her Majesty’s Stationery Office.
Application for reproduction should be made in writing to The Copyright Unit,
Her Majesty’s Stationery Office, St Clements House, 2-16 Colegate, Norwich NR3 1BQ.
First Published 2010.
ISBN 978 1 84712 806 5
iii Contents
Contents
Acknowledgements ... v
The Authors ... vi
Summary ...1
1 Introduction ...5
1.1 Background ...5
1.2 Conceptualising training ...5
1.2.1 Conceptualising the outcomes of training ...6
1.2.2 Other issues ...7
1.3 Research questions ...7
1.3.1 The report ...7
1.4 Data ...8
1.4.1 The quarterly Labour Force Survey ...8
1.4.2 The British Household Panel Survey (BHPS) ...8
1.4.3 The Families and Children Study (FACS) ...8
2 Who receives training? A cross-sectional view ...11
2.1 Introduction ...11
2.1.1 Training ...11
2.1.2 Type and Nature of Training ...13
2.1.3 Length and time spent on training ...13
2.2 Analysis by personal characteristics ...15
iv
2.2.2 Ethnicity and religion ...16
2.2.3 Qualifications and occupation ...17
2.2.4 Family Type ...19
2.2.5 Disability ...19
2.2.6 Regional variations ...20
2.2.7 Earnings ...21
2.3 Job and employer characteristics ...25
2.3.1 Length of employment ...25
2.3.2 Full-/part-time status, sector and gender ...29
2.3.3 Sector, size of workplace and gender...30
2.3.4 Industry and type of organisation ...32
2.4 Chapter summary ...33
3 Trends in UK training provision, 1994-2008 ...35
3.1 Introduction ...35
3.2 Training over time ...36
3.2.1 Type of training and time spent on training ...38
3.3 Trends in training by personal characteristics ...38
3.3.1 Trends in training by age group ...38
3.3.2 Training by gender over time ...39
3.3.3 Training and ethnicity 1994-2008 ...40
3.3.4 Training and qualification and occupation 1994-2008 ...41
3.3.5 Training and hourly earnings 1994-2008 ...45
3.3.6 Training and regional variation 1994-2008 ...45
3.4 Trends in training by job and employer characteristics ...46
3.4.1 Training and length of employment 1994-2008 ...46
3.4.2 Training and full-time/part-time employment 1994-2008 ...47
3.4.3 Training and industry and type of organisation 1994-2008 49 3.4.4 Training and size of establishment 1994-2008 ...51
3.5 Who receives training? ...52
v
4 Training and wage progression: descriptive analysis ...63
4.1 Background ...63
4.2 Results for 2007 ...63
4.3 Analysis of changes in hourly wages 2006/07 ...65
4.3.1 Wages in 2006 ...65
4.3.2 Age group ...67
4.3.3 Existing qualifications ...68
4.4 Chapter summary ...69
5 Modelling longitudinal changes in wage progression linked to training ...71
5.1 Introduction ...71
5.2 Linear regression estimates of the training effect on hourly earnings ...72
5.2.1 Regressions looking at the median and higher/lower earnings ...73
5.3 Tackling the selection issue ...74
5.3.1 The fixed-effects model ...75
5.3.2 Other approaches to the selection issue – actual and expected training ...77
5.4 Varying the time period between training and wage effect ...79
5.4.1 Training trajectories ...80
5.5 Earnings and training following the transition from unemployment into work ...81
5.6 Results for families with children ...82
5.7 Chapter summary ...82
6 Training and job advancement and retention ...85
6.1 Job advancement ...85
6.1.1 Movement into paid work ...85
6.1.2 Moving into paid work: families with children ...87
6.1.3 Analysis of satisfaction with job, 2006->07 ...88
6.2 Job retention ...89
6.2.1 Results from the BHPS ...89
vi
6.2.2 Risk of exiting employment for the recently employed ...91
6.2.3 Results for families with children ...91
6.3 Chapter summary ...92
7 Key conclusions ...93
7.1 Who undertakes training and how does progression, retention and advancement differ between and within key groups? ...93
7.2 What are the benefits deriving from government-funded and privately-funded training and lifelong learning? ...94
7.3 Can training improve low-skilled workers’ in-work progression? ...94
7.4 Can we identify the relationship between undertaking training and gaining, retaining and advancing in employment? ...94
7.5 Can we identify the impact of retention and advancement on investment in training? ...94
Appendix A Chapter 2: Detailed tables and question wording ...95
Appendix B Chapter 3: LFS decomposition and comparison with BHPS figures ...105
Appendix C Chapter 5: Key regression results ...141
Appendix D Chapter 6: Key to independent variables used in the XTLOGIT models (BHPS) ...149
References ...157
List of tables
Table 2.1 Length of training ...14Table 2.2 Training by ethnicity and religion...17
Table 2.3 Proportion of employees in training by qualification and occupation ...18
Table 2.4 Training by family type and age group ...19
Table 2.5 Training by current and past disability ...20
Table 2.6 Length of time with current employer and length of course (Row %) ...27
Table 2.7 Length of time with current employer and fees for training (Row %) ...28
Table 2.8 Length of time with current employer and length of training course ...29
Table 3.1 Odds ratios of logistic regression on the receipt of training (1998-2008) ...54
vii
Table 3.3 Training in the public sector (1998-2008) – odds ratios ...58
Table 3.4 Odds ratios of logistic regression on the receipt of training (2001-2008): Size of establishment ...59
Table 3.5 Odds ratios of logistic regression on the receipt of training (2001-2008): Size of establishment (private sector) ...60
Table 3.6 Odds ratios of logistic regression on the receipt of training (2001-2008): Size of establishment (public sector) ...60
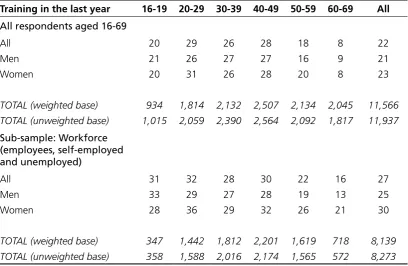
Table 4.1 Participation in training, all aged 16-69, in 2007/08 ...64
Table 4.2 Participation in training, all aged 16-69, in 2007/08 ...65
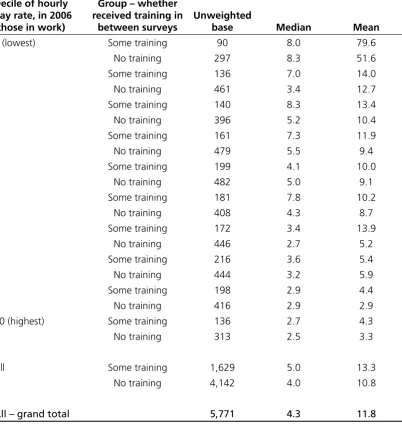
Table 4.3 Changes in hourly money earnings 2006/07, by decile and training received ...66
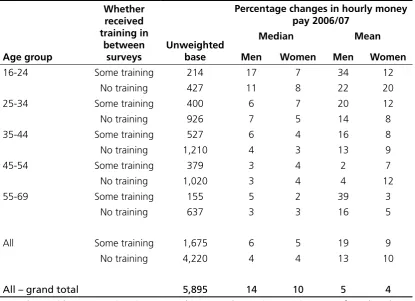
Table 4.4 Changes in hourly money earnings 2006/07, by age, gender and training received ...68
Table 5.1 Effects of training on hourly wage rates – linear regression results ...73
Table 5.2 Effects of training on hourly wage rates – quantile regressions ....74
Table 5.3 Effects of training on hourly wage rates – OLS and fixed-effect estimates ...76
Table 5.4 Effects of training on hourly wage rates – alternative definitions of training, fixed-effects models ...77
Table 5.5 Effects of training on hourly wage rates – fixed-effects models, training defined as employer-paid training only ...79
Table 5.6 Effects of training on hourly wage rates – alternative definitions of timing of training ...80
Table 5.7 Effects of training on hourly wage rates – FACS data (fixed-effects model) ...82
Table 6.1 Rate of movement into paid work, among non-workers ...86
Table 6.2 Effects on moving into paid work, from not-working ...87
Table 6.3 Changes in satisfaction with job (as employee) 2006/07, by training received ...88
Table 6.4 Changes in satisfaction with job (as employee) 2006/07, by type of training received ...89
Table 6.5 Effects of training on the annual risk of exiting employment (for 1997-2008) ...90
Table 6.6 Effects of training on the risk of exiting employment: alternative definitions of training ...90
Table A.1 Proportion of employees in training by region and gender ...95
Table A.2 Training by hourly pay (£), age group and gender ...96
Table A.3 Training by hourly pay (£), qualification and gender ...96
Table A.4 Training by hourly pay (£), occupation and gender ...97
Table A.5 Proportion of employees in training by length of employment, sector and gender ...97
Table A.6 Length of time with current employer and main place of training ...98
viii
Table A.7 Training by industry and gender ...98
Table A.8 Training by type of organisation ...99
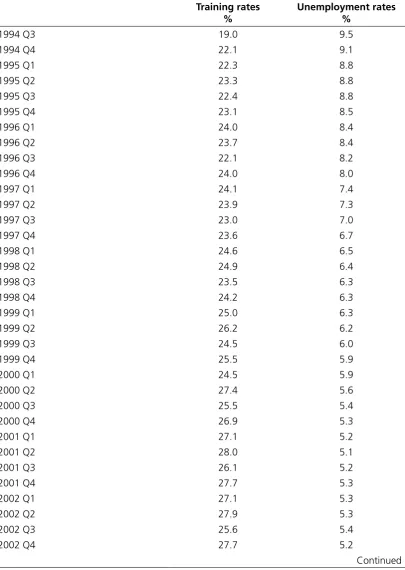
Table B.1 Training rates and unemployment rates 1994-2008 ...108
Table B.2 Job-related training: methods of study 1999-2006 ...110
Table B.3 Trends in training, by gender 1994-2008 (Quarter)...111
Table B.4 Trends in training, by ethnicity 1994-2008 (Year) ...113
Table B.5 Trends in training, by qualification 1994-2008 (Quarter)...114
Table B.6 Trends in training, by occupation (1994-2000 quarters)...116
Table B.7 Trends in training, by occupation (2001-2008 quarters)...117
Table B.8 Trends in training and hourly earnings (£) and gender 1994-2008 (RPI adjusted to 2008 prices)...118
Table B.9 Trends in training, by region 1994-2008 (Year) ...119
Table B.10 Trends in training, by length of employment 1994-2008 ...120
Table B.11 Trends in training, full-time/part-time status, by gender 1994-2008 ...122
Table B.12 Trends in training, by full-time/part-time status, sector and gender 1994-2008 ...124
Table B.13 Trends in training, by industry 1994-2008 ...125
Table B.14 Trends in training, by type of organisation 1994-2008 ...126
Table B.15 Trends in training, by size of establishment 1994-2008 ...127
Table B.16 Full model for Table 3.1 (including year) – Odds ratios of logistic regression on the receipt of training (1998-2008) ...129
Table B.17 Full model for Table 3.2 – Odds ratios of logistic regression on the receipt of training (1998-2008) in the private sector ...131
Table B.18 Full model for Table 3.3 – Odds ratios of logistic regression on the receipt of training (1998-2008) in the public sector ...133
Table B.19 Odds ratios of logistic regression on the receipt of training (1994-2008) ...135
Table B.20 Odds ratios of logistic regression on the receipt of training (1994-2008) in the private sector ...137
Table B.21 Odds ratios of logistic regression on the receipt of training (1994-2008) in the public sector ...139
List of figures
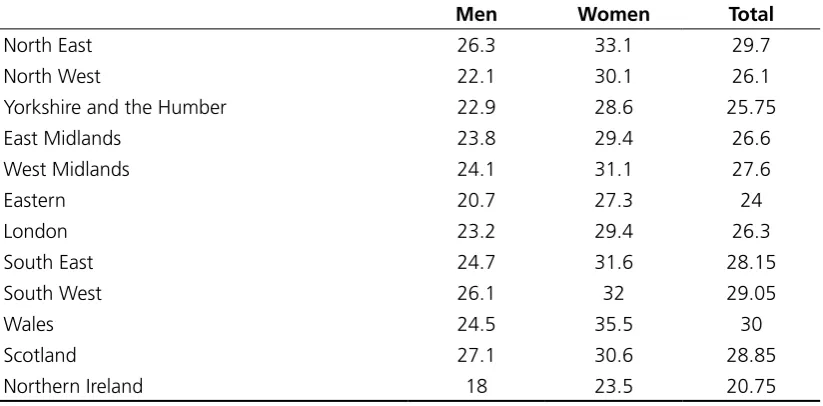
Figure 2.1 Training by gender and age group ...16Figure 2.2 Training (in the last 13 weeks) by geographical region and gender ...21
Figure 2.3 Training (last 13 weeks) by hourly pay, age group and gender ...22
Figure 2.4 Training by hourly pay, qualification and gender ...24
ix
Figure 2.6 Training by full-/part-time status, sector and gender ...30
Figure 2.7 Training by size of workplace, sector and gender ...31
Figure 2.8 Training by industry ...32
Figure 2.9 Training by type of organisation ...33
Figure 3.1 Proportion of employees aged 16-69 in training (with 4-qtr moving average showing trend) and unemployment rates 1994-2008 ...36
Figure 3.2 Percentage of employees aged 16-69 in training, and unemployment rates (%), 1994-2008 [r = -0.85] ...37
Figure 3.3 Proportion of employees aged 16-69 in training, by age group (1994-2008) ...39
Figure 3.4 Proportion of employees aged 16-69 in training, by gender 1994-2008 ...40
Figure 3.5 Proportion of employees aged 16-69 in training, by ethnicity 1994-2008 ...41
Figure 3.6 Proportion of employees aged 16-69 in training, by qualification 1994-2008 ...42
Figure 3.7 Proportion of employees aged 16-69 in training, by occupation 1994-2000...43
Figure 3.8 Proportion of employees aged 16-69 in training, by occupation 2001-2008...44
Figure 3.9 Hourly earnings and gender, by training 1994-2008 ...45
Figure 3.10 Trends in training, by region 1994-2008 ...46
Figure 3.11 Proportion of employees aged 16-69 in training, by length of employment 1994-2008 ...47
Figure 3.12 Proportion of employees aged 16-69 in training, by full-/part-time status and gender 1994-2008 ...48
Figure 3.13 Proportion of employees aged 16-69 in training, by full-time /part-time status, sector and gender 1994-2008 ...49
Figure 3.14 Proportion of employees aged 16-69 in training, by industry 1994-2008 ...50
Figure 3.15 Proportion of employees aged 16-69 in training, by type of organisation 1994-2008 ...51
Figure 3.16 Proportion of employees aged 16-69 in training, by size of establishment 1994-2008 ...52
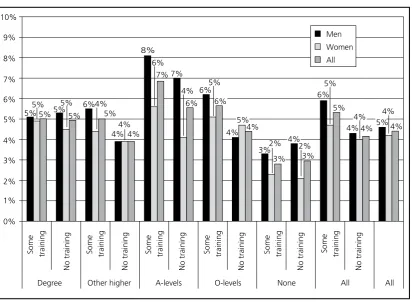
Figure 4.1 Wage change following training, by qualifications and gender ....69
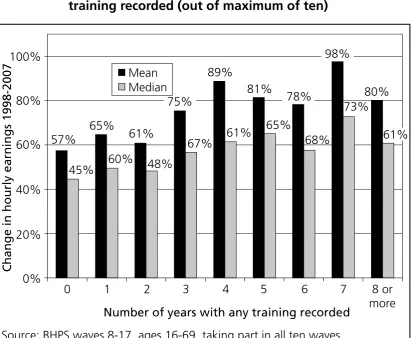
Figure 5.1 Wage changes 1998-2007, by number of years with any training recorded (out of maximum of ten) ...81
Figure B.1 Decomposition of additive time series ...106
xi Acknowledgements
Acknowledgements
We would like to thank the UK Data Archive for granting access to the Families and Children Study, quarterly Labour Force Surveys and the British Household Panel Survey. Neither the data collectors nor the data archive have any responsibility for the analysis and conclusions reported here.
xii The Authors
The Authors
Dr Sin Yi Cheung is senior lecturer in sociology at the University of Birmingham.
Professor Stephen McKay is the chair in social research at the University of
1 Summary
Summary
Who receives training?
This report concerns the training that people receive while in work, or in anticipation of working in the future, and the effects it has on people’s careers. This is training received after the end of education (in most cases). There is a great variety of activities that count as training, and in the statistical analysis we consider how far different kinds of training are associated with different outcomes (hourly wages, in particular).
Data and methods
We draw on three datasets for this study: the Labour Force Surveys (LFS) 1994 to 2008; the Families and Children Study (FACS); and the British Panel Household Survey (BHPS). A range of descriptive statistics were employed to chart the trends over time. Binary logistic regression, ordinary least square (OLS) linear regression, and fixed effects models were used to estimate the effects of training over and above those accounted for by individual traits.
In 2008, training was most commonly received by: • younger people;
• women;
• those working in the public sector (especially in local government, health or the armed forces), or working for non-profits organisations;
• those working in larger organisations; • those with higher qualifications;
2
Trends in training 1994-2008
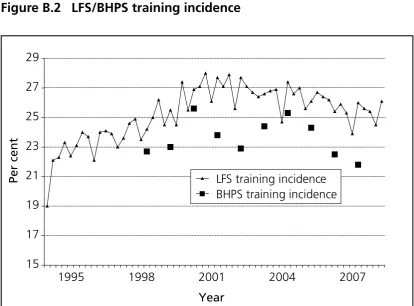
The proportion of workers aged 16-691 in training rose from about 20 per cent in
1994 to reach a high of around 28 per cent in 2003. This trend has been flat or on the decline since then, and particularly from 2005 onwards. Both the LFS and BHPS show this downward trend in the last few years. Training is also seasonal to some extent, with a lower proportion of the workforce in the third quarter (reflecting, perhaps, less training over the summer months).
This recent downward trend is found among virtually all groups. An important exception is older workers, aged 50 or older, who continue to enjoy increasing rates of training provision.
Changes in wages and training, longitudinal description
Hourly wages rates grew by 4.4 per cent between the 2006 and 2007 BHPS interviews, for those respondents working at both waves of interviews. They grew by five per cent where a respondent had received some training, and by four per cent otherwise. The rate of growth was higher where training was received, irrespective of the level of wages in 2006.
The highest increases in hourly earnings between 2006 and 2007 were achieved by young people, those aged between 16 and 34, and especially those at the younger half of this range.
For most age groups, except those under age 20, the rate of wage increase was raised if they had undergone a period of training.
Those who received training, compared to those who had not, showed greater variability in job satisfaction. That is, where a person had received training, they were both more likely to report an increase in job satisfaction, and more likely to report decreased job satisfaction. By contrast, there was greater stability in the reported levels of job satisfaction among those who did not receive training.
Changes in wages and training, longitudinal modelling
1998-2007
We look at the link between higher wages and having undertaken a spell of training in the recent past. This is based on data that tracks people over time. We first use models that control for a wide range of different background information. We then turn to look at statistical models that control for the unmeasured characteristics of people.
1 We used ages 16-69 for most of this report. This takes advantage of the
wider group of people to whom the questions were asked, not just those of pre-pension age, and permits some analysis of the increasing proportion of people who work after the age of 65. See Section 2.1.1 for further discussion of this selection.
3 Summary
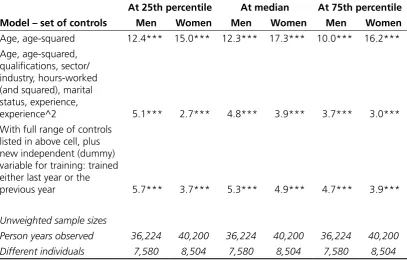
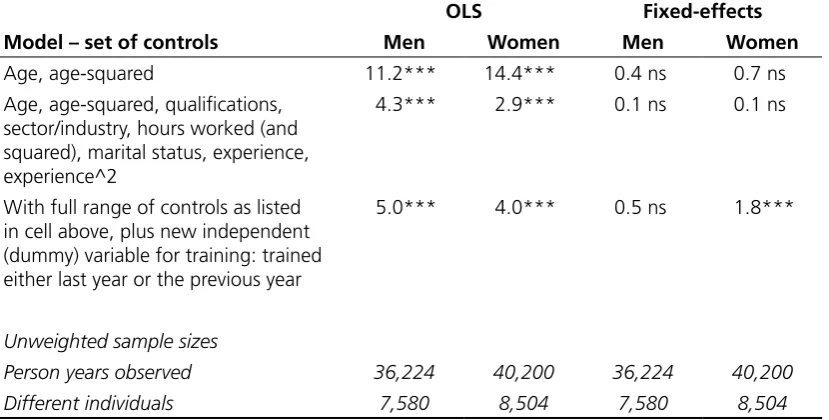
In standard linear regression models, the wage gain (measured by an increase in hourly earnings) to training (where received in the past year) were four per cent for men, and closer to two per cent for women. Modelling the median returns to training by quantile regression, rather than looking at the mean returns to training using the standard approach, produced quite similar results.
When we do not control for differences in individual traits (age, marital status, occupation) the increases in wages associated with past training appear to be much larger. This implies that what might appear to be the effect of training on wages is often largely due to differences in individual traits. Hence, it is important to control for these differences to isolate the specific effect of training on wage progression.
The current ‘state of the art’ within econometrics recommends the application of fixed-effect models to investigate the effect of training on wage returns. The purpose of these models is essentially to use individuals as their own control group in looking at changes in earnings and training. This provides a better estimate of the contribution of training to wage growth, as it controls for unobserved characteristics of individuals.
The estimated effect of training on wages is much reduced in these fixed-effects models. Training is then associated with an increase in wages of about 0.5 per cent, measured over the period from 1998-20072. However, where the training
received was explicitly employer-funded or employer-provided, the size of gain was closer to two per cent.
If we adopt the recent suggestion in the econometric literature and restrict the analysis to only those who anticipated receiving training, the effects of training on wage progression can become statistically insignificant. This is a less tried and tested approach than the above statistical models.
Training does, however, seem to be strongly linked to labour market transitions – that is, undergoing a period of training seems to increase the rate of returning to work, and decreases the likelihood of job exit.
Limitations of the study
One of the difficulties in comparing findings across studies is the different measures and definitions used. They can be different even within the same study such as this one. We rely on existing data sets to provide detailed information on the duration, nature and type of training. The LFS essentially merges training with some aspects of education, while the BHPS does better at keeping them distinct. The degree of detail available in these data sets is also different.
2 In the BHPS, which we use for longitudinal analysis, training is measured by
5 Introduction
1 Introduction
1.1
Background
Training may be a key route towards employment advancement and job retention. The aim of this study is to explore the connections between skills/training, on the one hand, and retention and advancement in employment, on the other. In this report we define the principal key terms in the following way:
• wage progression: the increase in hourly wages (if any) associated with having had training;
• retention: any links between training and remaining in paid employment;
• advancement: discrete changes in employment associated with training, such
as changes in job satisfaction or moving into paid work from unemployment or inactivity. This may also cover career progression, such as promotion.
It is worth noting that most of the past literature has focused on wage progression, taking hourly wage rates as the main (and often the only) dependent variable to analyse. This remains a key focus of this report, and we provide new estimates of the wage gain to training. Normally, advancement can also refer to career progression such as promotion or moving into a higher paid job. However, we do not deal with either outcome in the current study.
Overall, analysis of this set of outcomes requires longitudinal data to examine the consequences of undergoing training of various kinds. Longitudinal data provides the ability to track earnings progression over time, work histories, and to measure levels of, and changes in, education, skill, and training. A feasibility study has established an appropriate method for analysing the effect that training may have on labour market progression (McKay and Sadler, 2009), using longitudinal data.
1.2
Conceptualising training
6
– whether training has been received during a particular time period. The wording of survey questions has, historically, been quite varied with some seeking to merge education and training as is the case with the Labour Force Survey (LFS), whilst others such as the British Household Panel Survey (BHPS) separate them. Here we make a conceptual distinction between education and training. Continuous full-time education until the minimum school leaving age of 16, or the highest level of qualification already held at the time of the survey, is not regarded as training. Any training we refer to in this research is work-related – see later sections for the precise wording of the relevant questions.
It has been less common for studies of the effects of training to discuss and to consider if there are particular effects of the duration of training, the number of courses3, the purpose of training, who paid for it, and where it took place.
These concepts have, however, often been regarded as important in more general discussions about the provision of training.
Additionally, there has also been little attempt to look at the timing of training. Wages are typically regressed on training received in the immediately prior period. Within the economics literature (Leuven, 2004) there has been particular theory-driven interest in the distinction between general and specific training. General training raises a worker’s productivity in all firms, while specific training only raises it in their current firm. Naturally, most training has both types of effects, between these two extremes.
There is also interest in the payment for such training, and the theoretical prediction (apparently contradicted by empirical evidence) that firms will only fund specific training. However, few (if any) surveys are able to adequately capture such distinctions or the relevant details of payment (aside from simple direct fee costs, which are often included). It is difficult to accurately capture information on the actual payments made, from surveys, and perhaps particularly for courses that may have taken place many months before interviews. It is also generally true that those building models of training have been somewhat separate from those designing the questions in such studies.
1.2.1 Conceptualising the outcomes of training
There has also been an emphasis on changes in wages. A more recent stream in the literature has been to analyse increases in productivity (e.g. Dearden, Reed and Van Reenen, 2006). There has been much less attention paid to other labour market issues, including whether a person remains in work, their hours of work, duration in jobs, effect on later spells on unemployment or on job satisfaction – among a range of different labour market outcomes.
3 Arulampalam and Booth (2001) being a key exception.
7 Introduction
1.2.2 Other issues
The first feature worth noting is that empirical studies have paid most attention to the average effect of training, and not the returns accruing to different groups in the population. Indeed, according to Asplund (2004:62): ‘Surprisingly minor attention has been paid to the question whether, and how, the wage effects of investments in company training vary with the characteristics of the trained employees’.
It is fairly clear that those with lower levels of qualifications receive less training from their employers. However, there has been relatively little emphasis on the effects of training such groups. Blundell, Dearden and Meghir (1996) found a higher return to those with at least intermediate level qualifications. It should also be clear that few results, and no clear results for the UK, are based on any time periods since the mid-1990s.
1.3
Research questions
The main aim of our research is to uncover the causal link between training and changes in employment characteristics – especially wages. There are a number of important subsidiary questions, including:
• Who undertakes training and how does progression, retention and advancement differ between and within key groups?
• What are the benefits deriving from government-funded and privately-funded training and lifelong learning?
• Can training improve low-skilled workers’ in-work progression?
• Can we identify the relationship between undertaking training on the one hand and gaining, retaining and advancing in employment on the other?
• Can we identify the impact of retention and advancement on investment in training?
1.3.1 The report
We begin by analysing who received training using the 2008 LFS in Chapter 2, and in Chapter 3 we look at trends in training over time, drawing on data from the LFS from 1994 to 2008. Perhaps surprisingly, the proportion of employees receiving training appears to have been on a slight downward trend in the last few years. It is, however, worth noting that the workforce has continued to grow, until quite recently, so the volume of training provided may not be following any kind of downward trend in aggregate. This is, in addition, the trend in the proportion of people who receive training, rather than the volume of training.
8
market advancement and retention, not limited to rates of hourly earnings. Chapter 7 then summarises the main conclusions in relation to the research questions outlined above.
1.4
Data
This report is based on secondary analysis of high quality and large scale datasets.
1.4.1 The quarterly Labour Force Survey
The LFS is a large cross-sectional survey of the workforce. It has the advantage of a very large sample size (around 160,000 individuals, of all ages, per quarter). It is therefore the best dataset for most purposes in analysing smaller sub-groups, including minority ethnic groups. It also has detailed questions about training and occupation, though more limited information on incomes. One of the main training questions, concerning training received in the three months preceding the interview, has been asked since 1994, permitting a long time-series of results. The survey is also released to the data archive within about three months of the interviews taking place – so that at the time of starting analysis (March 2009) it was possible to analyse data from the quarter ending December 2008. Most other datasets are only accessible after a much longer time lag after fieldwork.
1.4.2 The British Household Panel Survey (BHPS)
The BHPS started in 1991, and has continued annually. The original 5,500 households have been followed up since then, and new households introduced as they formed. In latter years, new samples from Scotland, Wales and Northern Ireland, and earlier the introduction of those who took part in the European Community Household Panel, have helped to boost the unweighted sample numbers.
The BHPS is well-suited to looking at both annual changes and at the longer term effects of earlier changes. In time, it is being superseded by the UK Household Longitudinal Study (UKHLS), or Understanding Society as it is now branded. Questions on additional education and training appear in most of the surveys, with changes from wave 8 onwards to provide additional details on timing and duration. Questions relating to training ask about the location of training, its purpose and duration, payment of fees, and level of qualification.
The BHPS meets most of the key analysis needs, so most of the panel or longitudinal results in this report are based on it.
1.4.3 The Families and Children Study (FACS)
9
children (or move to sampled areas). FACS asks about additional education or training undertaken each year, whether completed and the qualification (if any) being sought. Similar questions are asked of partners. This dataset is analysed on a longitudinal basis in the course of this project and in particular, looks at results for lone parents, and for mothers within couples with children. These are two groups more on the margins of the labour market. The FACS data includes them in far greater numbers than in the BHPS.
11
2 Who receives training?
A cross-sectional view
2.1
Introduction
Before we go on to establish causality between training and labour market progression, it is important to contextualise the factors that may be associated with training, such as personal, family and job characteristics. It may also be relevant to disaggregate results for different occupational and industrial sectors, such as service/manufacturing and public/private. The first step is to provide an accurate description of who receives training and how the experiences of training vary by individual characteristics and those of their employers.
2.1.1 Training
In this chapter, we present a cross-sectional analysis using the latest available data from the Quarterly Labour Force Survey (LFS) in 20084. The key advantage of
the LFS is its large sample size which allows disaggregation of analysis to smaller sub-groups such as those from minority ethnic backgrounds. From summer 1994, respondents aged 16-69 in each quarter of the LFS were asked whether they had received training or education in the preceding three months5:
4 We have included data from all four quarters in 2008, but have restricted
the analysis to respondents in waves 1 and 5 which contain data on income and earnings. This takes into account the rotating panel structure of the LFS sample design and, with respondents included in five consecutive waves in just one year, will not result in any double counting. This is because the wave 1 respondents interviewed in the first quarter of 2008 will not have had their wave 5 interviews in the October to December quarter in the same year. The data are weighted by person weight (PWT07) for all univariate analyses, by average person weight (PWT07/mean(PWT07)) for bivariate analyses and by person income weight (PIWT07) for hourly earnings.
5 This is the variable ED13WK. For all LFS training variables in 2008, please
refer to the annex at the end of this report.
12
In the three months since beginning [date] have you taken part in any education or any training connected with your job, or a job that you might be able to do in the future (including courses that you have told me about already)?
1 yes
2 no
According to the 2008 LFS questionnaire, this applies if the respondent is of working age or just older (16-69), in work or in receipt of education or training6.
It also applies to respondents in employer-based work training, project base work training, or an employee on New Deal in public/private sector, voluntary sector, environmental task force or assisted self-employment, or those working in addition to that done on New Deal Scheme, including those in unpaid work for their own or relative’s business. Additionally, this question also applies to respondents with a job or business who were away in the reference week. This question however, does not apply to those who were still in continuous full-time education or who were at school, unemployed persons or economically inactive respondents such as homemakers and the retired. In 2008, 27 per cent of all respondents in employment reported they had received training in the preceding 13 weeks. In other words, when this question asks about education or training connected with your job, it does not include any continuous full-time education that is usually regarded as formal school or post-school qualifications.
In this study we have chosen to include older workers up to the age of 69, rather than introducing a cut-off at either 65 or the current State Pension ages (60 for women). This is mainly because more people continue to work past State Pension age. According to the LFS, only 24 per cent of those aged 60-69 were economically active in 1994, compared to 34 per cent in 2008. One of our key variables, which relates to the job-related training variable in the LFS (ED13WK), also uses the age range of 16-69 years.
The ‘recently completed training’ questions in the LFS also include respondents not in work or full-time education, but were doing college-based training in the last 13 weeks (Variable FUTUR13). ‘The course is connected to a job that the respondent might be able to do in the future’ (ONS 2008: 329). Unlike those who were in employment, only 11 per cent of these respondents who were ‘not in employment’ reported they had received training or education in the preceding 13 weeks (FUTUR13=1). However, within this group, 78 per cent had done so in the last four weeks (FUTUR4=1).
The pattern is reversed for training received most recently. Most (82 per cent) of the unemployed who had received training in the last four weeks, said they had received it in the last week. This compares with the 51 per cent of those in work who had received training in the last week, if they had received any training in the
6 An undercount of about 2,000 cases was estimated for the spring 1997
13
past four weeks (ED4WK=1). Such differences may be reflecting the longer period of training provided to the unemployed (see next section).
2.1.2 Type and Nature of Training
The majority (80 per cent) who received training in the last 13 weeks (ED13WK=1 or FUTUR13=1) said the course was related to the jobs they had (JOBED). For the unemployed, this proportion increased to 93 per cent. Among all respondents who received training in the last four weeks, 37 per cent of them reported they had ‘on the job training’ and 45 per cent said that training was away from the job, while 18 per cent said they had both. ‘“On the job training” means learning by example and practice while actually doing the job. Any training conducted in a classroom or training session, even if on employers’ premises is not “on the job training”’ (ONS 2008: 337).
Not all training took place at employers’ premises, or was offered and paid for by employers. Just over half (57 per cent) said their training was offered and paid for by their employers; 20 per cent said they, or their family and relative paid for it and 12 per cent of them got funds from government or local authorities. Naturally, training for those not in employment was mostly paid for by ‘themselves, their family or relatives’ (33 per cent); or by the government and local authorities (42 per cent).
Only a third (33 per cent) of those who reported receiving training received it on employers’ premises; 16 per cent did it at colleges of further education, 12 per cent did so at universities and a further 11 per cent at private training centres. For those who were not in employment, training mostly took place at colleges of further education (32 per cent) or universities (43 per cent). It is highly likely that this group may include others than the typically unemployed, such as people who are studying while looking for work when they are about to finish their training.
2.1.3 Length and time spent on training
The length of training courses varies greatly, ranging from less than a week to more than three years. As Table 2.1 shows, respondents who were in work tended to do shorter courses, lasting no longer than one week; while those not in employment appeared to have gone for longer training courses. Among this group, nearly two in five (39 per cent) undertook training lasting three years or more. It could be that the unemployed had to re-train where different skills and knowledge are required for gaining a new job. This could also apply to students who were inactive but pursue longer training courses for prospective jobs. While this could well include respondents (especially those not in employment but who were registered on longer term courses) returning to universities or college of further education, it does not include those who were still at school and those still in continuous full-time education. Moreover, many of those currently not in employment may well have been previously in education or training – the training courses may relate to periods prior to the current spell of unemployment.
14
Table 2.1 Length of training
Column percentages
Length of training course
Percentage of employees in training in the last
13 weeks
Percentage of ‘not in employment’ in training
in the last 13 weeks
Less than 1 week 41 2
1 week but < 1 month 4 2
1 month, < 3 months 3 3
3 months, < 6 months 3 3
6 months, < 1 year 6 9
1 year, < 2 years 7 15
2 years, < 3 years 7 20
3 years or more 9 39
No definite limit, ongoing 20 8
Weighted N 2,922,911 817,172
1 day 69 38
2 days 17 14
3 days 7 0
4 days 5 13
5 days 2 35
6 days 1 0
Weighted N 563,142 4,025
Source: LFS 2008 q1-q4, w1 and w5. Weighted by pwt07.
For those whose training courses lasted for less than a week, 69 per cent of these employees only did a one-day course, compared to 38 per cent of those not in employment. Again, the unemployed appeared to be doing longer courses, over a third of them attended five-day courses, spending an average of 27 hours last week on job-related education and training while the employed only spent 13 hours on training last week. Again, it could be that they need to enrol on more comprehensive courses which teach them new skills and knowledge. It could also simply be because they have more time to attend training courses than those who are in work.
In Section 2.2, we examine the relationship between training and a number of personal and family characteristics such as gender, age, ethnicity, religion, qualification, disability, family type and region. We also explore the association between training, occupation and hourly pay. Section 2.3 turns to job and employer characteristics, which range from full-/part-time status, length of employment, sector, and industry to size of workplace.
15
2.2
Analysis by personal characteristics
2.2.1 Gender and age
Contrary to some previous evidence (Blundell et al., 1996: 9), female (54 per cent) and younger workers (39 per cent for the 16-19 years old) are more likely to have received training in the last 13 weeks (or in the last three months as reported in the tables and figures in this chapter) than men (46 per cent) and older groups (14 per cent for those aged 60-69).
The opposite gender pattern observed by Blundell et al. (1996) is likely to be due to any of three key reasons. First, there is a difference in the source of data being analysed and the definitions used. They used a much narrower definition of training which included only employer-provided training and training leading to a formal vocational qualification. Second, it was necessary to rely on quite a long period of recall between different waves of the National Child Development Study (NCDS), the birth cohort study tracking those born in the same week in 1958. This may mean that some shorter training periods were not included. Third, it is also important that the time reference points are different – the LFS relating to 1998-2007 in this report, while the NCDS data covered 1981-91.
As can be seen in Figure 2.1, this ‘gender gap’ in receiving training appears to be larger among the older groups. The proportions of teenage boys and girls who received training did not differ much, but they declined much more sharply with age for men than for women. Forty per cent of the youngest men (16-19) compared to 12 per cent of men in their 60s received training; whereas the age gap between the youngest and oldest women was only 21 per cent.
For those who were not in employment, over a third of the 16-19 year olds reported receiving training in the last 13 weeks for both sexes, but this proportion dropped drastically to just over ten per cent for those in their 30s, to three per cent for the 50-59 year olds, and to below one per cent for those aged 60 or above.
16
Figure 2.1 Training by gender and age group
2.2.2 Ethnicity and religion
Table 2.2 presents the proportion of workers of each ethnic group and religion in receipt of training. For example, 26 per cent of all Caribbean male workers received training compared to 35 per cent of Caribbean women. In general, higher proportions of women receive training than men among all ethnic groups, except for Africans where the gender gap is smaller. African and Caribbean women are most likely to have received training. The gender gap is the largest among the Pakistani and the mixed minority groups. Interestingly, only one in five Chinese men and one in four Chinese women received any training in the preceding three months, a pattern resembling that of the Pakistanis and Bangladeshi who have the lowest proportions in training. It is widely documented that unemployment is disproportionately high among Pakistani and Bangladeshi men (Heath and Cheung, 2006; Clark and Drinkwater, 2007). Even for those who are in employment, they are least likely to have received training.
Who receives training? A cross-sectional view
40 29
25 22 20 12
38 33
31 31 28 17
0 5 10 15 20 25 30 35 40 45
16-19 20-29 30-39 40-49 50-59 60-69
A
g
e
g
ro
u
p
s
Proportion of employees aged 16-69 in training
Men Women
1 All bivariate analyses with count data are weighted by the adjusted PWT07
(i.e. PWT07/mean (PWT07)). This provides a more realistic chi-square statistic than the initial weights.
Source: LFS 2008 q1-q4, w1 and w5. Weighted by adjusted pwt071.
17
Table 2.2 Training by ethnicity and religion
Cell percentages
Training in the last three months Men Women All
Ethnicity
Caribbean 26 35 31
African 34 37 35
Indian 25 31 27
Pakistani 16 27 19
Bangladeshi 19 27 21
Chinese 19 25 22
Black mixed, other mixed 22 33 28
All other non-mixed groups1 25 32 28
British, other whites 24 30 27
Religion
Christian 24 31 27
Buddhist 24 37 31
Hindu 26 33 29
Jewish 23 31 26
Muslim 19 27 21
Sikh 20 28 24
Any other religion 25 32 29
No religion 25 30 27
Source: LFS 2008 q1-q4, w1 and w5. Weighted by mean pwt07.
Ethnicity: male: χ2 = 62, d.f. = 8, p < .001; female: χ2 = 20, d.f. = 8, p < .01.
Religion: male: χ2 = 30, d.f. = 7, p < .001; female: χ2 = 10, d.f. = 7, p < .19.
1 This group combines black other (non-mixed), other-Asian (non-mixed) and other-other
(non-mixed).
Training also varied by religious identification. Only one in five Muslim and Sikh men received training whereas 37 per cent of female Buddhists did so. The proportions among Jewish and Hindu women are also high (at 31 per cent and 33 per cent respectively). However, the results for women are not statistically significant. Existing literature has not systematically examined the relationship between religion and training. Some argue that firms may discriminate against certain type of workers, e.g. women and non-whites (Arulampalam and Booth, 1997). Our results show that, among men, Muslims and Sikhs (and to a lesser extent those of the Jewish religion) may have lower access to training opportunities than the largest religious groups (that is, Christians, and those with no religion).
2.2.3 Qualifications and occupation
The results confirm previous research that there is a positive relationship between higher levels of prior educational attainment and training (Arulampalam and Booth, 1997). Highly qualified men and women are mostly likely to have received
18
training. Over 40 per cent of women with higher (post-secondary) and degree education had received training in the last three months (Table 2.3). In contrast, less than one in ten among men with no qualifications had access to training. This provides further evidence for the ‘low skill, bad job trap’ (Arulampalam and Booth, 1997: 198). The gender gap is much wider at the top end of the educational hierarchy, which may be a result of more qualified women working in the public sector – something we explore, below.
Perhaps not surprisingly, small employers and own account workers are least likely to have received training in the last three months because they would have to provide it for themselves. Two-fifths of professional and managerial women had undertaken training compared to less than one in six among those in routine occupations. If training proves to be beneficial to wage gain or career advancement, this may suggest that workers in routine occupations are less likely to progress in their job due to limited access to training.
Table 2.3 Proportion of employees in training by qualification and occupation
Cell percentages
Training in the last three months Men Women All
Highest qualification
Degree or equivalent 34 42 37
Higher education 29 41 35
GCSE A level 23 31 26
GCSE Grades A-C or equivalent 23 25 24
Other qualifications 17 21 19
No qualifications 8 11 9
N 46,905 40,292 87,197
Occupation
Higher managerial and professional 31 40 33
Lower managerial and professional 31 39 35
Intermediate occupations 31 24 26
Small employers, own account 8 14 9
Lower supervisory and technical 24 30 26
Semi-routine occupations 18 25 22
Routine occupations 14 13 13
N 45,890 38,716 84,606
Source: LFS 2008 q1-q4, w1 and w5. Weighted by pwt07.
Qualification: male: χ2 = 1445, d.f. = 5, p < .001; female: χ2 = 1748, d.f. = 5, p < .001.
Occupation: male: χ2 = 1945, d.f. = 6, p < .001; female: χ2 = 1531, d.f. = 6, p < .001.
19
2.2.4 Family Type
Examination of training by family type does not show a discernable pattern. While training does vary significantly by family type (χ2 = 96, d.f.= 4, p < .001), lone parents with dependent children, the group that attracts most policy attention, did not have lower than average rate in training. The pattern for families with children is also very similar to that of single-person families, with younger age groups more likely to be in training. Rather unexpectedly, lone parents in their thirties with non-dependent children had one of the lowest proportions in training in the last three months, as do lone parents in their sixties and those in this age group but still with dependent children were not doing any training at all.
Table 2.4 Training by family type and age group
Cell percentages Training in the last three
months 16-19 20-29 30-39 40-49 50-59 60-69 N
Single person 37 35 30 25 27 18 12,983
Couple no or non-dep children 41 34 30 26 23 13 35,583
Couple dependent children 37 24 26 27 25 17 31,640
Lone parent non-dep children 37 29 22 23 23 18 3,248
Lone parent dependent children 41 25 32 31 34 0 4,428
Source: LFS 2008 q1-q4, w1 and w5. Weighted by pwt07.
1-person: (χ2 = 175, d.f. = 5, p < .001); Couple no/ non-dep chd: (χ2 = 901, d.f. = 5, p < .001);
Couple dep chd: (χ2 = 109, d.f. = 5, p < .001); Lone parent non-dep chd: (χ2 = 33, d.f. = 5, p <
.001); Lone parent dep chd: (χ2 = 45, d.f. = 5, p < .001);
2.2.5 Disability
Also of policy interest are disabled people. The pattern shown here is surprisingly similar between the disabled and the non-disabled (Table 2.5). Only men with Disability Discrimination Act (DDA) work-limiting disability and current disability fared worse, fewer than one in five received training in the last three months. However, past disability does not appear to be a barrier to training opportunities and in fact they are the group who have highest rates of training even compared with the non-disabled.
20
Table 2.5 Training by current and past disability
Cell percentages
Training in the last three months Men Women All
Current disability
DDA work-limiting disabled 18 28 23
DDA disabled 23 33 28
Work-limiting disabled only 24 33 28
Not disabled 24 30 27
N 47,323 40,563 87,886
Current and past disability
Current disability only 20 30 25
Current and past disability 22 28 26
Past disability only 33 34 33
Not DDA disabled 24 30 27
N 47,323 40,563 87,886
Source: LFS 2008 q1-q4, w1 and w5. Weighted by pwt07.
Current disability: male: χ2 = 42, d.f. = 3, p < .001; female: χ2 = 17, d.f. = 3, p < .001.
Current and past disability: male: χ2 = 50, d.f. = 7, p < .001; female: χ2 = 5, d.f. = 7, p < .20.
2.2.6 Regional variations
21
Figure 2.2 Training (in the last 13 weeks) by geographical region and gender
2.2.7 Earnings
With cross-sectional data, it would be too hasty to attribute any causal relationship between training and earnings (See also Blundell et al. 1999 for a discussion on the difficulty in estimating the causal effect of training on earnings). Nonetheless, as the feasibility report has found, the most common reason people give for training is to develop skills (McKay and Sadler, 2009). It could be that these people are a more motivated group and it would be interesting to see if training is associated with higher pay7. Our results show that men with training earned £14.20 per 7 The earnings questions were first introduced in 1992 and were only asked in
wave five and the final interviews due to concerns of non-response. As from 1997 these questions were asked in both waves 1 and 5 in order to double the sample size and to reduce sampling errors. For more details see the LFS user guide and documentation (background.pdf). Data for the analysis on earnings are weighted by PIWT07.
Who receives training? A cross-sectional view
Proportion of employees aged 16-69 in training
Source: LFS 2008 q1-q4, w1 and w5. Weighted by pwt07,
male: χ2 = 105, d.f. = 12, p < .001; female: χ2 = 90, d.f. = 12, p < .001.
0 5 10 15 20 25 30 35 40
North East North West Yorkshire and Humberside East Midlands West Midlands Eastern London South East South West
Wales Scotland Northern Ireland
Men Women
23.5 18
30.6 27.1
35.5 24.5
32 26.1
31.6 24.7
29.4 23.2
27.3 20.7
31.1 24.1
29.4 23.8
28.6 22.9
30.1 22.1
22
hour compared to only £12.90 for those without (p < .001). Similarly, significant difference was also found among women whose hourly wage was £10 without training; while those with training enjoy a statistically significant premium of £1.80. It is worth noting that despite the higher rates of training among women, they still earn less than men. However, as is standard for labour market analysis, we generally look separately at men and women.
More interesting results are observed by further disaggregation. Figure 2.3 shows the average hourly pay for men and women by their training status and age group. Training does not appear to be associated with any wage gain for the youngest age group. In fact, both men and women aged 16-19 who undertook training earned significantly less (£5.27 and £5.66 for men and £5.34 and £5.70 for women; p < .001). However, training is indeed associated with significantly higher hourly pay for both men and women from the 20s onwards.8 There may have been some
degree of selection into training as people who choose to undertake training may be more motivated and more experienced, but this was least apparent among those aged under 20. Table A.2 gives the full details.
Figure 2.3 Training (last 13 weeks) by hourly pay, age group and gender
8 The wage difference by training status for all age groups is statistically
significant at p < .001 level.
Who receives training? A cross-sectional view
Has training men Has training women No training men No training women
£0 £2 £4 £6 £8 £10 £12 £14 £16 £18 £20
16-19 20-29 30-39 40-49 50-59 60-69
Respondents in employment aged 16-69
Average hourly pa
y
23
Highest qualification, earnings and gender
Although the relationship between training and labour market progression is not a straightforward one, one of the benefits of training that existing research has documented is wage gain (Booth, 1993, Blundell et al., 1996). However, unlike Arulampalam and Booth (1997) who identified no wage growth for the poorly qualified, we find the opposite: the higher wage associated with training observed here is not significant for respondents with higher levels of qualification. In fact, men with degrees qualifications who undertook training earn marginally less than their peers without training (p < .01). Table A.3 gives actual figures.
Similarly, training makes no difference in wage growth for male respondents with post-secondary qualifications (p <.99) and for females with A-level and GCSE qualifications (p < .30 and p < .21)9; while men with GCSE qualifications actually
earn more without undertaking any recent training. However, training does seem to be associated with higher wages for those with no qualifications and for both men (p < .02) and women (p <.04).
There is only a small apparent uplift in hourly pay for those who have other qualifications and women with higher (post-secondary) and degree qualifications. It is reasonable to expect that the benefits of training only accrue in the long run and may not be visible after 13 weeks, as is measured by this training question. We shall return to this in more details using the BHPS in Chapter 4.
9 For male respondents, the significance levels of the results by training
status are as follows: degree: p < .01; A-level: p < .01; GCSE p < .01; other qualification: p < .001; no qualification: p < .02. For female respondents, all results are significant at p < .001 level unless already stated.
24
Figure 2.4 Training by hourly pay, qualification and gender
Occupations and earnings
Simple regression results on wage difference by training status for different occupational groups are mixed. At the top end, training is associated with a small but statistically significant increase in hourly earnings for women in the higher (six per cent increase, p < .001) and lower professional and managerial (eight per cent increase, p < .001) occupations (results not shown in figure). Similarly, women in lower supervisory and technical positions and semi-routine jobs also have higher wages (nine per cent and three per cent increase, p < .001). However, women in intermediate and routine occupations with training actually earn less (three per cent decrease, p < .01 and nine per cent decrease, p < .001).
The wages for men with training in intermediate jobs were seven per cent higher than those without (p < .001) and for those in lower professional occupations, the difference is two per cent (p < .03). However, hourly wage does not vary significantly by training status for other occupation groups at the conventional 95 per cent significance levels, including those in routine occupations.
Overall, the LFS 2008 findings suggest that the association between training and progression (measured by higher wages) is observed only for those in professional and managerial jobs. The association between training and progression is not observed (or is much weaker) for workers in routine occupations at the bottom end of the labour market. (See Table A.4 for detailed figures).
Who receives training? A cross-sectional view
£0 £4 £10 £15 £20 £25
Respondents in employment aged 16-69
Average hourly pa
y
Source: LFS 2008 q1-q4, w1 and w5. Weighted by piwt07. Degree or
equivalent educationHigher A levelGCE GCSE Grades A-C or equivalent
Other
qualificationsqualificationsNo Has training men Has training women
25
2.3
Job and employer characteristics
In this section, we examine the relationship between various job characteristics and training, ranging from the length of employment, full-time or part-time status. Then we move on to study employer characteristics such as sector, industry, and size of workplace.
2.3.1 Length of employment
Training does not appear to increase with the length of employment with current employer. Evidence in Figure 2.5 suggests that it actually goes the opposite way.
In the 2008 data, only 4.3 per cent (of all 16-69 year-olds in employment) who answered the main training question (ED13WK) were employed for less than three months with their current employer, and 5.2 per cent of them received training as opposed to 3.9 per cent who did not. (See Table A.5 for all percentages). Further analysis excluding these new employees did not produce significantly different results.
One in three men who had been in their jobs for less than three months received training, compared to only one in five among those who had ten to 20 years of job tenure with the same employer. The change for women is less pronounced with length of employment. Even among women in their job for over 20 years, 29 per cent of them were in some form of training in the last 13 weeks. It is possible that some of these new employees were still on induction programmes.
26
Figure 2.5 Training (last 13 weeks) by length of employment, gender and public/private sector status
When it comes to the type of training, whether or not respondents undertake ‘on the job training’ or ‘training away from job’ does not appear to be associated with the length of employment with their current employer. For those who took shorter training courses, the majority (over 65 per cent) took one-day courses and a further 18 to 22 per cent took two-day courses depending on their length of employment but very little variations can be discerned. Nor is the number of days in the last week spent on training.
Who receives training? A cross-sectional view
Length of employment with current employer Source: LFS 2008 q1-q4, and w5. Weighted by pwt07.
Public Sector: male: χ2 =35, d.f. = 7, p < .001; female: χ2 = 37, d.f. = 7,
p < .001
Private Sector: male: χ2 = 384, d.f. = 7, p < .001; female: χ2 = 316, d.f. = 7,
p < .001 0 5 10 15 20 25 30 35 40 45 50 Pr op or tio n of e m pl oy ee s ag ed 1 6-69 in t ra in in g < 3
months months 3 but < 6
6 months but <12
1 year
but < 2 2 years but < 5 5 years but < 10 10 years but < 20 20 years or more Public men Public women
27
Table 2.6 Length of time with current employer and length of course (Row %)
Length of time with current
employer Length of training course in days
1 2 3 4 5 6
Less than 3 months 66 19 6 6 3 0
3 months but less than 6 68 21 7 0 4 0
6 months but less than 12 74 19 2 2 3 0
1 year but less than 2 65 13 5 14 2 0
2 years but less than 5 70 13 10 4 2 1
5 years but less than 10 68 18 6 7 1 1
10 years but less than 20 68 17 9 4 2 1
20 years or more 69 18 7 3 2 1
All 69 17 7 5 2 1
Source: LFS 2008 q1-q4, w1 and w5. Weighted by pwt07. χ2 = 40, d.f. =35, p =.27.
However, loyalty does pay off as 71 per cent of respondents with 20 years or more with their current employers (Table 2.7) had their training paid for whereas only 42 per cent of newer employees (less than three months) had this privilege.
Research has shown that training with the current employer leads to a wage gain (Parent, 1999). It is of course possible that new recruits undertook training prior to gaining employment with their current employers. In fact, it has been demonstrated that employers also reward training acquired with previous employers (Parent, 1999). Furthermore, newer employees’ training also tended to take place in private training centres or colleges of further education rather than on employers’ premises (see Table A.6). They were also likely to undertake longer training courses lasting over a year and up to three years (Table 2.8).
Over half (55 per cent) of respondents with ten years with their current employers were more likely to attend training courses lasting only up to a week. This rose to 61 per cent for those who have 20 years tenure, compared to just 26 per cent for new employees (less than three months in their new jobs).
28
Table 2.7 Length of time with current employer and fees for training (Row %)
Who paid fees for training
Time with current employer
Employer/ potential employer
TEC/ LEC/ YT/ TFW
Other govt/
LA
Self, family,
relative Other No fees knowDon’t
Less than 3 months 41.6 14.9 28.7 2.0 9.9 3.0
3 months but < 6 43.6 21.1 24.8 2.3 8.3
6 months but < 12 55.1 1.1 14.0 20.2 1.7 5.6 2.2
1 year but < 2 53.4 0.8 14.0 22.0 0.8 5.7 3.4
2 years but < 5 54.6 14.1 22.1 1.9 6.6 0.7
5 years but < 10 65.7 5.6 16.7 2.3 8.5 1.3
10 years but < 20 63.9 0.4 9.2 12.2 2.5 10.9 0.8
20 years or more 71.3 5.3 11.1 1.8 9.4 1.2
Total 57.6 0.3 11.7 19.2 1.9 7.8 1.5
Source: LFS 2008 q1-q4, w1 and w5. Weighted by pwt07. χ2 = 110, d.f. = 42, p < .001.
29
Table 2.8 Length of time with current employer and length of training course
Column percentage Length of
Training
Course Length of time with current employer
< 3 months
3 months
< 6
6 months
< 12
1 year
< 2 2 years
< 5 5 years
< 10 10 years
< 20 20 years
+ Total
Less than
1 week 26.4 31.0 31.5 29.0 36.3 46.3 54.5 60.8 41.1
1 week,
< 2 weeks 7.2 1.3 1.4 1.3 1.7 2.7 2.5 2.5 2.3
2 weeks,
< 3 weeks 3.0 1.0 0.5 1.1 0.9 1.1 0.6 0.2 0.9
3 weeks,
< 1 month 2.1 0.7 0.3 0.3 0.7 1.4 1.3 0.8
1 month,
< 2 months 2.7 1.6 1.1 0.8 1.5 1.8 1.0 1.2
2 months,
< 3 months 1.5 2.9 1.7 1.5 1.7 1.4 1.1 1.0 1.5
3 months,
< 6 months 3.9 3.2 2.6 3.5 2.5 2.8 2.5 1.6 2.7
6 months,
< 1 year 3.9 7.0 7.4 8.3 6.4 6.6 3.0 2.5 5.7
1 year, < 2 years 6.3 7.3 9.7 10.6 9.1 5.6 6.0 3.9 7.5
2 years,
< 3 years 9.6 12.5 10.9 11.5 8.3 4.6 2.8 2.0 7.1
3 years + 10.5 12.8 15.0 13.8 11.4 6.3 3.6 1.5 9.0
Ongoing/no
definite limit 22.8 19.5 18.6 18.2 20.7 20.2 20.2 21.8 20.2
Source: LFS 2008 q1-q4, w1 and w5. Weighted by adjusted pwt07. χ2 = 611, d.f. =77, p < .001.
2.3.2 Full-/part-time status, sector and gender
The gender gap in training may be further explained by the sector of employment. It is clear from Figure 2.6 that significantly higher proportions of women in the public sector received training in the preceding 13 weeks compared to all the others.
30
Figure 2.6 Training by full-/part-time status, sector and gender
The proportion of all employees in training in the public sector is 41 per cent, almost double the 22 per cent in the private sector. Overall, a slightly higher proportion of all full-time employees (28 per cent) were in training in 2008 compared to 25 per cent of part-time employees. However, the pattern changes when sector is taken into account. Both men and women in part-time employment in the public sector have higher rates (over 30 per cent) of training than all full-timers in the private sector. Overall, the difference between the private and public sector is larger than the difference between part-time and full-time statuses. It was also apparent that this full-time versus part-time difference was somewhat more pronounced in the public sector.
2.3.3 Sector, size of workplace and gender
Figure 2.7 presents the results by size of the workplace and sector. The size of workplace is defined by the number of employees: small establishments have up to 24 employees; medium-sized establishments have 25-499 workers. Finally, establishments with 500 or more employees are defined as large workplaces.
Further evidence of a ‘public sector effect’ is visible from Figure 2.7. Employees in large establishments with 500 or more employees were more likely to have received training than their counterparts in the private sector. This may be because larger organisations can afford to pay for more training. This is reflected by the fact the majority of training courses in the public sector were paid for by employers Who receives training? A cross-sectional view
Proportion of employees aged 16-69 in training Source: LFS 2008 q1-q4, w1 and w5. Weighted by pwt07.
Male – full-time: χ2 =1181, d.f. = 1, p < .001; Part-time: χ2 = 42, d.f. = 1,
p < .001
Female – full-time: χ2 = 931, d.f. = 1, p < .001; Part-time: χ2 = 344, d.f. = 1,
p < .001
0 5 10 15 20 25 30 35 40 45 50
Full-time Part-time
31.9 34.1 21
20.8
40.2
46.5 20.8
27
Men Women
Men Women
Public sector
Pr
iv
at
e
se
ct
o
31
favouring large organisations: 66 per cent, 69 per cent and 72 per cent for small, medium and large establishments. In contrast, the corresponding figures in the private sector were only 47 per cent, 58 per cent and 69 per cent. However, t