Lone Parents and Work Based
Learning for Adults
Lone Parents and Work Based Learning
for Adults
Draft report
Tracy Anderson and Candice Pires
Prepared for Department for Work and Pensions
List of tables
Acknowledgements Abbreviations and acronyms
Summary i
1 Introduction 1
1.1 Background 1
1.2 Aims of the study 2
1.3 Methodology 2
1.3.1 Sample 2
1.3.2 Data collection 3
1.3.3 Analysis 3
1.4 Structure of report 3
2 Characteristics of lone parent participants 5
2.1 Introduction 5
2.2 Demographic characteristics 5
2.2.1 Gender and age 5
2.2.2 Marital status and parenthood 6
2.2.3 Ethnicity and country of birth 6
2.2.4 Health problems and disabilities 7
2.2.5 Region 7
2.3 Work related characteristics: skills and experience 8
2.3.1 Basic skills 8
2.3.2 IT skills 8
2.3.3 Qualifications 9
2.3.4 Work history 9
2.4 Attitudes to work 10
2.5 Other social indicators 11
2.5.1 Accommodation 11
2.5.2 Access to telephones, transport and financial services 11 2.5.3 Childhood: parental interest in education, employment and financial
situation
13
2.6 Self-identified barriers to unemployment 14
2.7 Comparison with JSA participants 15
2.8 Summary 16
3 Participation in WBLA 17
3.1 Introduction 17
3.2 Identification of participation in WBLA 17
3.3 Entry onto WBLA 18
3.4 Duration and activities undertaken 18
3.5 Leaving the training early 20
3.6 Usefulness of training 20
3.7 Comparison with JSA participants 23
4.3 Occupation and employer characteristics 26
4.4 Applying for the job 27
4.5 Hours, contract type, pay and other compensation 30
4.6 Childcare arrangements 32
4.7 Learning to do the job and training 33
4.8 Comparison with JSA participants 34
4.9 Summary 35
5 Changes in participant characteristics 37
5.1 Introduction 37
5.2 Skills and qualifications 37
5.2.1 Self-reported improvements in basic skills 37
5.2.2 Self-reported improvements in IT skills 37
5.2.3 Qualifications gained 38
5.2.4 Overall acquisition of human capital 39
5.2.5 Comparison with JSA participants 39
5.3 Other characteristics which may affect employability 40
5.4 Summary 40
6 Conclusions 43
Bibliography 45
Table 2.1 Gender and age 5
Table 2.2 Marital status 6
Table 2.3 Length of time in the UK 7
Table 2.4 Region 7
Table 2.5 Self-reported language, reading, writing and numeracy problems 8
Table 2.6 IT skills 8
Table 2.7 Level of highest qualification 9
Table 2.8 When last in paid work prior to January 2002 9
Table 2.9 Pre-1999 Work History 10
Table 2.10 Attitudes to work and success: motivation 11 Table 2.11 Attitudes to work and success: luck 11
Table 2.12 Accommodation 12
Table 2.13 Whether managing financially at beginning of January 2002 13
Table 2.14 Parental interest in education 13
Table 2.15 Parental employment and childhood financial situation 14 Table 2.16 Barriers to employment in November/December 2001 15 Table 2.17 Comparison of lone parent participants and JSA participants 16 Table 3.1 Identification of training starting January-April 2002 17 Table 3.2 Identification of training by duration 18
Table 3.3 How much wanted to get involved 18
Table 3.4 Duration of training 19
Table 3.5 Whether training was what participant wanted to do 19
Table 3.6 Activities undertaken 19
Table 3.7 Whether left training early 20
Table 3.8 Usefulness of training 20
Table 3.9 Usefulness of training by whether completed training and whether gained a qualification
21 Table 3.10 Ways in which the training was useful 21 Table 3.11 Whether training helped participants get a job 21 Table 3.12 Ways in which the training helped the participant to get a job 22 Table 3.13 Usefulness of training and whether training helped participant to
get a job by participant characteristics
22 Table 3.14 Usefulness of training and whether it helped participants to get a
job
23 Table 4.1 Proportion employed since starting WBLA by participant
characteristics
25 Table 4.2 Employment status: most recent post-WBLA employment 26 Table 4.3 Occupation and managerial/supervisory duties 26
Table 4.4 Industry 27
Table 4.5 Number of sites and number of employees 27
Table 4.6 How heard about the job 28
Table 4.7 Whether anyone persuaded the employer to interview/recruit 28 Table 4.8 Whether received help with applying for job 29 Table 4.9 Likelihood of getting same job without help 29
Table 4.14 Relative financial position 32
Table 4.15 Type of childcare used 32
Table 4.16 Weekly cost of childcare 33
Table 4.17 Training received 33
Table 4.18 How long it took to learn the job 34
Table 4.19 Comparison of lone parent participants and JSA participants 34 Table 5.1 Whether improved level of basic skills via attending a course 37
Table 5.2 IT courses attended 38
Table 5.3 IT skills January 2002 and at interview 38
Table 5.4 Whether gained any qualification 38
Table 5.5 Highest qualification at January 2002 and at interview 39 Table 5.6 Comparison of lone parent participants and JSA participants 40 Table 5.7 Change in characteristics which may impact upon employment
chances
Department for Work and Pensions in collaboration with ORC International) and from a survey jointly designed by DWP, National Centre and the Policy Studies Institute. The authors gratefully acknowledge the contributions of Russ Bentley, Gillian Burgess, Mike Daly, Jane Francis, Jon Hales, Jane Hall, Karl Olsen, Peter Weller, colleagues at DWP and to all the interviewees who took the time to respond to the survey.
BET Basic Employability Training DWP Department for Work and Pensions
IS Income Support
Summary
Background
Work Based Learning for Adults (WBLA) is a voluntary training programme which aims to help adults without work, and with poor employability skills, into sustained employment. While WBLA is primarily aimed at JSA claimants, around 15 per cent of participants were claiming other benefits. Of these, the largest group comprised of lone parents in receipt of Income Support, who accounted for almost one half of non-JSA participants. This study focused upon these participants. It provides an insight into their characteristics, experiences of WBLA and views on how helpful they found the programme. In addition to this, the study examined the changes in the skills, qualifications and other characteristics of these lone parent participants, the extent to which they have been in paid work since starting WBLA and the types of work undertaken.
Methodology
The study examined one particular cohort of WBLA participants – those who started their training between 1 January 2002 and 30 April 2002 and who participated in either SJFT, LOT or BET. The sample was drawn from those participants marked as being eligible for New Deal for Lone Parents and claiming Income Support. In total, 474 lone parent participants were interviewed between April and June 2003, giving a response rate of 63 per cent. A face-to-face computer assisted interview was conducted with the respondents. On average, this lasted 54 minutes. The resulting data were weighted to take account of selection and non-response.
Key findings
The vast majority of lone parent participants were women (88 per cent) and had dependent children under the age of 16 (86 per cent). Prior to participating in WBLA, many had no, or low level, skills and qualifications. 42 per cent had either never used a computer or had only done so a few times, 32 per cent had no qualifications and 19 per cent reported having difficulties with reading, writing or numeracy.
There were notable differences between those who participated in the different WBLA opportunities. Those who went on to participate in BET tended to be the most disadvantaged: Compared with SJFT and LOT participants, a greater proportion of BET participants had poor basic skills (49 per cent), poor IT skills (54 per cent) and no qualifications (53 per cent). SJFT and LOT participants were generally more similar to each other, but, even among these groups, there were still sizeable proportions with poor IT skills (31 and 43 per cent respectively) and no qualifications (26 and 28 per cent).
Since starting WBLA, almost one half (48 per cent) of lone parent participants had improved their human capital by either attending a course which had improved their English, reading, writing, numeracy or IT skills, or by gaining a qualification. Those who participated in BET were most likely to have reported such human capital gains, with 59 per cent doing so compared with 37 per cent of SJFT participants and 50 per cent of LOT participants.
Looking at these improvements in more detail, almost one third (32 per cent) of lone parent participants had improved their IT skills via attending courses and three per cent had
In addition to these skill improvements, 27 per cent of the participants had gained a
qualification. This was most common among LOT participants (31 per cent compared with 23 per cent of SJFT participants and 13 per cent of BET participants).
Not only did a substantial proportion of lone parents have low level skills when they started on the programme, the majority had no recent work experience. Seventy per cent had not worked in the two years prior to 2002. Since starting WBLA, however, 48 per cent had been in paid employment (predominantly as employees). This was less common among those who participated in BET (of whom only 28 per cent had done so compared with 53 per cent of SJFT participants and 52 per cent of LOT participants).
The type of work undertaken by these lone parents since participation varied. They were most commonly employed in health and social work (26 per cent), and wholesale and retail
industries (25 per cent). One third were in administrative or secretarial positions. Many others were employed in personal service occupations (14 per cent), sales or customer services (15 per cent) and elementary/unskilled occupations (20 per cent). They primarily had permanent contracts (84 per cent) and were concentrated in the lower end of the pay scale. Fifty-six per cent reported a net hourly rate of less than £5.00, with only eight per cent earning £7.00 or more after tax and other deductions. Fifty-nine per cent of employed lone parent participants worked part-time, most probably due to their caring responsibilities and more limited availability for work.
While these entries into work (and improvements in human capital) are likely to be connected with participation in WBLA, we do not have the means to assess to what extent these changes are attributable to the programme. However, the views of the participants’ themselves provide some support for the role of WBLA. Many thought that the programme had helped them to get paid work, often because it had lead to increased self-confidence or a qualification.
Unfortunately, only 65 per cent of lone parent participants could recall starting any training between January and April 2002. As only the views of these lone parents are known,
1
Introduction
1.1
Background
Work Based Learning for Adults (WBLA) is a voluntary training programme aimed principally at those, aged 25 and over, who have been without work for at least six months and who are currently in receipt of Jobseeker’s Allowance (JSA) or another qualifying benefit.1 There is also provision for other priority groups2 to gain immediate access to the
programme, although they account for a minority of entrants.
Since April 2001, the delivery of WBLA has been the responsibility of Jobcentre Plus (formerly the Employment Service). Prior to this, responsibility lay with the Training and Enterprise Councils (TECs). At the time of transfer to Jobcentre Plus, WBLA was subject to a number of changes to make it more employment focused and to tailor provision to the length of time customers had been without work.
The main objective of the programme is to help adults without work, and with poor employability skills, into sustained employment. The programme includes four types of provision (known as ‘Opportunities’):
• Short Job-Focused Training (SJFT) offers up to six weeks of training for the most job-ready. Via individually tailored packages of training, SJFT aims to address the needs of those people who lack the specific work-related skills required by local employers by building on previous work experience and/or training. It is open to those who have not been in work for at least six months and can include short courses such as fork lift truck driving.
• Longer Occupational Training (LOT) addresses more fundamental training requirements and can last for up to one year. LOT offers training packages tailored to help individuals overcome whatever barriers to work they face. It can include work trials or placements, basic skills training, occupational training and/or soft skills training and is available to people who have already been claiming JSA for at least twelve months.
• Basic Employability Training (BET) is aimed at those with the most acute needs and is usually expected to last for six months. It is designed to help those who have severe basic skills needs (i.e. those with a reading/numeracy assessment under the level of an average seven year old) with the aim of moving them into work. BET also includes language courses in English.
• Self-Employment Provision (SEP) offers help and guidance to those wishing to set up their own business. It also provides the opportunity for individuals to test their business by trading while still receiving financial help. SEP can last up to 18 weeks.
1 These are Income Support, Incapacity Benefit, Severe Disablement Allowance and Maternity Benefit. 2 These include ex-regulars in HM forces, lone parents, returnees to the labour market, people made
In addition to this assistance, Programme Centres (previously known as Job Clubs) are available to provide job search support to those participants who do not find work by the end of their training.
All participants receive an allowance-based payment equivalent to their weekly benefit plus at least ten pounds while they are on the programme.3
There are two possible routes on to Work Based Learning for Adults. The main route is direct referral by Jobcentre Plus staff or New Deal Personal Advisors (including NDLP personal advisors). A small proportion of participants initially discuss participation with the training provider, although their entry onto WBLA is still subject to Jobcentre Plus approval. Since April 2001, there have been 135,600 starts on WBLA, with 74,000 starting in the operational year 2002/2003. Those starting on WBLA were predominantly in receipt of JSA; only around 15 per cent were claiming other benefits. Of these, the largest group comprised of lone parents in receipt of Income Support who account for almost one half of non-JSA participants. This group predominantly participated in LOT, with only around one fifth undertaking SJFT and under ten per cent BET.
1.2
Aims of the study
This study focused upon the largest group of non-JSA WBLA participants, lone parents claiming Income Support (herein referred to as lone parent participants). 4 The aim of the
study was:
• To provide insight into the characteristics of lone parents claiming Income Support who participated in WBLA
• To examine their experiences of WBLA and their views on how helpful participation had been
• To examine the extent to which these participants had been in paid work since WBLA and the types of work undertaken
• To consider other changes in characteristics which had occurred since participating in WBLA.
1.3
Methodology
1.3.1
Sample
The study examined one particular cohort of WBLA participants – those who started their training between 1 January 2002 and 30 April 2002. The period was chosen to ensure that the cohort contained a sufficient number of participants and to ensure that the vast majority would have completed the programme before they were interviewed. Only those participating in SJFT, LOT or BET were considered. Policy interest in SEP was focused on the effect of the test-trading. Unfortunately, very few lone parent participants have ever reached this stage.
The sample was drawn from those participants marked as being eligible for New Deal for Lone Parents and claiming Income Support. The sample was clustered to improve fieldwork.
Full details of the sampling can be found in the accompanying technical report (Taylor and Anderson, 2004) available on request from DWP.
1.3.2
Data collection
The data for this study was collected using CAPI (computer aided personal interviewing). The questionnaire was developed by NatCen and PSI researchers, and officials from the DWP. The development work included a pilot study which provided the opportunity to test the content and length of the questionnaire.
Main stage fieldwork took place between April and June 2003. In total, 474 lone parent participants were interviewed, giving a response rate of 63 per cent. A face-to-face computer assisted interview was conducted with the respondents. On average, this lasted 54 minutes. Further details about the fieldwork and the questionnaire can be found in the accompanying technical report (Taylor and Anderson, 2004) available on request from DWP.
1.3.3
Analysis
The analysis primarily used survey data which have been weighted to take account of selection and non-response.
Due to the concentration of lone parent participants in LOT, it was not always possible to undertake separate analysis for each opportunity. Descriptive statistics are not presented for those groups with an unweighted base of less than 25. For those with an unweighted base between 25 to 50, the statistics are presented within brackets and should be treated with caution.
1.4
Structure of report
The structure of the report is as follows. Chapter Two focuses on the characteristics of lone parent participants prior to participating in WBLA. Chapter Three considers the activities undertaken while on the WBLA programme and participants’ views on their training. Attention is then turned to the types of work undertaken by participants since WBLA in Chapter Four. Chapter Five then examines the changes in participants’ skills, qualifications and other characteristics since the beginning of 2002. And finally, Chapter Six summarises the findings and concludes.
2
Characteristics of lone parent participants
2.1
Introduction
Those lone parents who participate in Work Based Learning for Adults are by no means an homogenous group. Their demographic profile, educational levels and work history vary both between and within opportunity types. This chapter examines the characteristics of these lone parents prior to participating in WBLA (i.e. as at the beginning of January 2002). It initially examines the demographic profile of the cohort of participants who started on the programme between January and April 2002, before looking at more work-related characteristics; namely skills, qualifications and work history. Attention is then turned to other personal and social characteristics before examining the factors which participants themselves identified as barriers to finding work prior to 2002. Finally, the characteristics of these lone parent participants are compared with those of the JSA claimants who started WBLA during the same period.
2.2
Demographic characteristics
2.2.1
Gender and age
Unlike WBLA participants who had been claiming JSA, the majority of lone parent
participants were female, Table 2.1. They were predominantly aged under 45, with an average age of 36 years. However, there were some differences between opportunities, with a greater proportion of LOT participants aged under 35 (50 per cent compared with 39 per cent of SJFT and LOT participants).
Table 2.1 Gender and age
Figures in Percentages
SJFT LOT BET ALL
Gender
- Male 10 12 11 12
- Female 90 88 89 88
Age
- Under 30 14 21 15 19
- 30-34 years 25 29 24 27
- 35-39 years 29 21 27 24
- 40-44 years 18 18 22 18
- 45-49 years 11 8 7 8
- 50-54 years 3 3 5 4
- 55 or more 0 0 0 0
Unweighted Base 101 289 69 459
2.2.2
Marital status and parenthood
As would be expected, the majority of lone parent participants were either single and never married, divorced or separated at the beginning of January 2002, Table 2.2. Only four per cent were partnered at this time. It is assumed that the circumstances of these participants changed soon after this (i.e. before or during their time on WBLA), such that they were recorded as being eligible for New Deal for Lone Parents while on the programme.5
Table 2.2 Marital status
Figures in Percentages
SJFT LOT BET ALL
Marital status
- Single, never married 41 40 49 41
- Married 6 3 2 4
- Living as a couple 0 1 0 0
- Widowed 4 2 5 3
- Divorced 29 38 31 35
- Separated 20 16 13 17
Unweighted Base 99 287 65 451
Parenthood
- Parent to children under 16 83 88 83 86
- No children under 16 17 12 17 14
Unweighted Base 101 289 69 459
Base: All lone parent participants (claiming IS) starting January-April 2002.
The majority of participants also had children under the age of 16 at the beginning of January 2002, Table 2.2. Nearly one half of this group (46 per cent) had just one child aged under 16, but 17 per cent had three or more. In most cases (80 per cent) their youngest child was of school age (i.e. aged five or over), with 39 per cent of the participants only having children aged ten or over.
Obviously, in order to be classified as a ‘lone parent’, an individual must have children. Those ‘lone parent’ participants who did not report having dependent children under the age of 16 may have had children aged 16 or more, or become a parent after the beginning of January (but before/during their time on WBLA).
2.2.3
Ethnicity and country of birth
One quarter of lone parent participants were from non-white ethnic groups, mainly Black-African or Black-Caribbean. As with the main JSA participants, this was more common among BET participants, of whom 46 per cent were non-white compared with 27 per cent of SJFT participants and 19 per cent of LOT participants.
The proportion of participants born outside of the UK also varied widely by WBLA opportunity. Forty-three per cent of BET participants were born outside the UK, compared with less than one in five SJFT and LOT participants. However, many had lived in the UK for 20 years or more, Table 2.3.
5 The survey data does not enable us to test this assumption. The majority of these ‘partnered’
Table 2.3 Length of time in the UK
Figures in percentages
SJFT LOT BET ALL
Less than 5 years 0 1 14 3
5 – 9 years 7 4 9 5
10 – 19 years 5 3 7 4
20 – 29 years 2 3 10 4
30 years or more 2 1 2 2
Born in the UK 85 87 57 82
Unweighted Base 101 289 69 459
Base: All lone parent participants (claiming IS) starting January-April 2002.
2.2.4
Health problems and disabilities
Disabilities and other health problems can prevent individuals from undertaking paid work and/or make it difficult to look for work. Just under one quarter of lone parent participants (23 per cent) reported having had a health problem or disability which affected the work they could do at the beginning of January 2002. A smaller proportion of SJFT participants reported such a problem (18 per cent compared with 23 per cent of LOT participants and 27 per cent of BET participants). As individuals with such problems are likely to have had greater difficulty finding or maintaining paid work, they may have spent a substantial period out of paid employment. Unfortunately, nothing is known about the nature or degree of these self-reported health problems or disabilities. They may be relatively minor and/or short-term. Indeed, only 20 per cent of those who reported having such a problem were recorded as having ever claimed Incapacity Benefit since May 1999 until starting on WBLA.
Furthermore, only 27 per cent were recorded by Jobcentre staff as having a disability. This suggests that the majority of these reported problems were relatively minor.
2.2.5
Region
Lone parent participants, like the main JSA participants, were located across all regions of England, with the largest proportion in London. BET participants were particularly concentrated in this region, Table 2.4.
Table 2.4 Region
Figures in percentages
SJFT LOT BET ALL
North East 2 4 0 3
North West 10 22 16 18
Yorkshire and Humberside 14 10 7 11
West Midlands 16 10 0 10
East Midlands 1 10 2 6
East of England 9 11 1 9
South East 8 9 12 9
London 31 21 58 29
South West 8 4 4 5
Unweighted Base 101 289 69 459
2.3
Work related characteristics: skills and experience
Those individuals who participate in Work Based Learning for Adults may have been out of work for a variety of reasons including low level skills or a lack of qualifications or recent work experience. This section examines the skills and experience of lone parent participants prior to starting on the programme.
2.3.1
Basic skills
Nineteen per cent of lone parent participants had some basic skills needs at the beginning of January 2002. Overall, five per cent reported having difficulties with English. Given the greater proportion of BET participants born outside of the UK and the focus of BET on basic skills, it is not surprising that difficulties with English were significantly more common among this group, with one quarter reporting such problems compared with one or two per cent of SJFT and LOT participants, Table 2.5. This pattern was also evident (although not as marked) for reading, writing and numeracy, with a smaller proportion of SJFT and LOT participants reporting difficulties compared with those who went on to participate in BET.
Table 2.5 Self-reported language, reading, writing and numeracy problems
Figures in percentages
SJFT LOT BET ALL
Difficulties with English 1 2 25 5
Difficulties with reading 2 3 18 5
Difficulties with writing/spelling 7 8 23 10
Difficulties with numbers 4 8 11 8
Any of the above 10 16 49 19
Unweighted Base 101 289 69 459
Base: All lone parent participants (claiming IS) starting January-April 2002.
2.3.2
IT skills
Turning to IT skills, around one quarter of lone parent participants had never used a computer prior to January 2002 and a further 16 per cent had only used one a few times, Table 2.6. Those who participated in BET tended to have lower IT skills compared with other
participants; 54 per cent of BET participants had never used a computer or used one only a few times compared with 31 per cent of SJFT participants and 43 per cent of LOT
participants.
Table 2.6 IT skills
Figures in percentages
SJFT LOT BET ALL
Never used a computer 15 27 35 26
Used a computer a few times 16 16 19 16
Basic computer skills 37 31 34 33
Good computer skills 23 21 11 20
Advanced computer skills 9 6 2 6
Unweighted Base 101 289 69 459
2.3.3
Qualifications
Around one third of all lone parent participants had no qualifications. Once again those who went on to participate in BET were most disadvantaged, with just over one half being without qualifications, Table 2.7. Those who did hold qualifications predominantly had qualifications equivalent to NVQ level two or lower.
Table 2.7 Level of highest qualification
Figures in percentages
SJFT LOT BET ALL
NVQ level 4 or above 13 10 8 11
NVQ level 3 18 11 10 13
NVQ level 2 29 34 12 30
NVQ level 1 11 13 9 12
Level unknown 3 3 8 4
No qualifications 26 28 53 32
Unweighted Base 101 289 68 458
Base: All lone parent participants (claiming IS) starting January-April 2002.
While some of the highly qualified lone parents who participated in BET were from overseas and reported having difficulties with English, it was unclear why others with higher level qualifications entered this opportunity. Unfortunately, the data did not allow this to be examined in greater detail.6
2.3.4
Work history
In addition to a lack of skills and qualifications, the absence of recent work experience can make it difficult for individuals to find work. The majority of lone parent participants had not worked in the two years prior to 2002 or had never had a paid job, Table 2.8. This is likely to be primarily due to these women having taken time out of the labour market in order to care for their children.
Table 2.8 When last in paid work prior to January 2002
Figures in percentages
SJFT LOT BET ALL
Within the 12 months prior 24 25 15 23
Within 13-24 months prior 7 7 8 7
More than 24 months prior 62 56 56 58
Never had a job 8 11 22 12
Unweighted Base 99 279 67 445
Base: All lone parent participants (claiming IS) starting January-April 2002.
Those who had been in paid work within the three years prior to 20027 had been employed
across all occupational groups. Thirty-five per cent were employed in elementary (unskilled) occupations, 17 per cent in sales and customer service occupations, 11 per cent as process, plant and machine operatives and a further 11 per cent in personal service occupations. Just over one half (54 per cent) worked full-time, 30 per cent worked 16 to 29 hours per week and 16 per cent worked fewer than 16 hours per week. In 56 per cent of cases, they had been in
their last job for over 12 months; in 24 per cent of cases, the job had lasted more than two years.
Indeed, a large proportion of the lone parents described themselves as spending ‘most of their time in steady jobs’ prior to 1999. This was more common among SJFT participants than among those participating in LOT or BET. Unsurprisingly, a similarly large proportion described themselves as spending ‘a lot of time looking after the home and family’, Table 2.9.
Table 2.9 Pre-1999 Work History
Figures in percentages (per cent agreeing with statement) SJFT LOT BET ALL I spent a lot of time looking after the home and family 40 46 47 45 I spent most of my time in steady jobs 54 41 41 44 I did mainly casual or short-term work 11 13 10 12 I was in work, then out of work, several times over 11 9 14 10 I spent more time unemployed than in work 8 9 7 9
I was never unemployed 6 8 4 7
I spent most of my time self-employed 1 2 2 2
I spent a lot of time out of work due to sickness/injury 0 1 1 1
Unweighted Base 101 289 69 459
Base: All lone parent participants (claiming IS) starting January-April 2002.
2.4
Attitudes to work
Attitudes to work can also be important in finding employment. However, they are difficult to capture, in addition to being impossible to gauge retrospectively. Participants were asked to what degree they agreed with a number of statements relating to work and success8:
‘Hard work is satisfying’
‘You can do anything if you work hard’ ‘You should be the best at what you do’ ‘Making money is mostly due to luck’ ‘To do well at work you have to be lucky’
‘To make a lot of money you have to know the right people’
These questions are believed to capture more constant attitudes to work and success, that is, attitudes that are unlikely to change in the short-term. As such they are used to provide an indication of participants’ attitudes prior to WBLA (although they equally provide an indication of their attitudes at the time of interview).
The first three statements relate to motivation and, as Table 2.10 shows, the majority of participants agreed or strongly agreed with each of them.
Table 2.10 Attitudes to work and success: motivation
Figures in percentages (per cent agreeing or strongly agreeing)
SJFT LOT BET ALL
Hard work is satisfying 82 86 81 84
You can do anything if you work hard 78 83 81 82 You should be the best at what you do 76 73 69 73
Unweighted Base 100-1 287-8 67-8 454-7
Base: All lone parent participants (claiming IS) starting January-April 2002.
The latter three statements relate to the degree to which individuals believed that success was out of their control and due primarily to luck. A much smaller proportion agreed or strongly agreed with these statements. Furthermore, differences were evident between those who participated in the different opportunities. BET participants were much more likely to agree or strongly agree with these statements than participants in SJFT or LOT (particularly with the first two), Table 2.11.
Table 2.11 Attitudes to work and success: luck
Figures in percentages (per cent agreeing or strongly agreeing)
SJFT LOT BET ALL
Making money is mostly due to luck 13 17 32 18
To do well at work you need to be lucky 12 14 28 15 To make a lot of money you have to know the right
people
28 27 35 29
Unweighted Base 100-1 287-8 67 454-6
Base: All lone parent participants (claiming IS) starting January-April 2002.
This difference may be due to real differences in opinions between BET participants and others, perhaps reflecting their own previous lack of labour market success. Alternatively, given the number of BET participants who were born outside of the UK, it is possible that this reflects cultural differences. Unfortunately, the small number of BET respondents prevent this being examined more closely.
2.5
Other social indicators
The previous sections have looked at the demographic and work-related characteristics of WBLA participants. Attention is now turned to other characteristics which can help to provide some insight into the circumstances of lone parent participants and their labour market
prospects.
2.5.1
Accommodation
Table 2.12 Accommodation
Figures in percentages
SJFT LOT BET ALL
Respondent responsible for accommodation
- Owning/buying 13 8 8 9
- Rented – social landlord 67 68 74 69
- Rented – private landlord 13 19 12 17
Living rent-free/others responsible for rent 1 1 3 2 Residential institution, hostel, B&B, no fixed address 0 0 1 0
Other 5 4 2 4
Unweighted Base 101 289 69 459
Base: All lone parent participants (claiming IS) starting January-April 2002.
2.5.2
Access to telephones, transport and financial services
In addition to accommodation type, access to basic goods and services (such as a telephone, a car and a bank account) can be viewed as indicators of social advantage. A lack of access to such basic goods and services not only suggests disadvantage but can also make finding and keeping a job more difficult.
Not having access to a telephone may make it difficult to contact employers about jobs (in addition to making it difficult for employers to contact job applicants). Ninety-four per cent of lone parent participants had access to a telephone to make and receive calls; however, there were differences between opportunities. BET participants were less likely to have had such access (88 per cent compared with 96 per cent of SJFT participants and 94 per cent of those participating in LOT).
A lack of personal transport may limit the geographical area in which individuals can look for work. Most participants did not have a driving licence (54 per cent). This was the case for over three quarters of BET participants (77 per cent), compared to around one half of SJFT and LOT participants (55 and 48 per cent respectively). Furthermore, not all of those with a driving licence had access to a vehicle. Only 15 per cent of BET participants had both a driving licence and access to a vehicle, as did 36 per cent of SJFT and 38 per cent of LOT participants.
Access to a bank account can also be important if employers will only pay wages directly into a bank. Over three quarters of participants (79 per cent) had a bank account at the beginning of 2002. SJFT participants were most likely to benefit from such services, with 85 per cent having a bank account compared with 77 per cent of those participating in LOT and 75 per cent of those participating in BET.
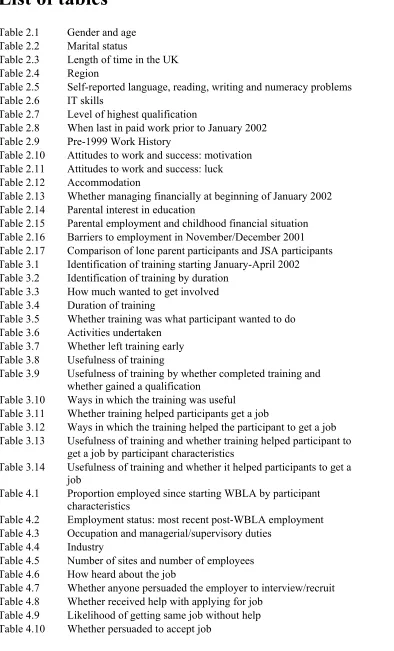
A lack of access to basic banking services can also make it more difficult to manage personal finances. Those without bank accounts cannot make use of cheaper payment methods, such as direct debits, and are likely to find it more difficult to secure credit. The majority of
Table 2.13 Whether managing financially at beginning of January 2002
Figures in percentages
SJFT LOT BET ALL
Able to save or spend money on leisure 5 4 4 4
Just about getting by 60 60 56 60
Getting into difficulty 36 36 40 37
Unweighted Base 99 289 69 457
Base: All lone parent participants (claiming IS) starting January-April 2002.
2.5.3
Childhood experiences: parental interest in education, employment and
financial situation
So far the characteristics examined have related to the position of participants just prior to participating in WBLA. Attitudes to education and work can also be influenced by childhood experiences.
An individual’s attitudes towards education may reflect the amount of encouragement they received as a child from the adults around them. Just under two thirds of participants said that their parent/guardian(s) took a lot or a fair amount of interest in how they were getting on in school, Table 2.14. For less than half of the participants, their parent/guardian(s) gave them a lot or a fair amount of encouragement to go on with their studies beyond earliest school leaving age.
Table 2.14 Parental interest in education
Figures in percentages
SJFT LOT BET ALL
Interest in how getting on at school
- A lot 40 41 35 40
- A fair amount 20 23 25 23
- A little 18 17 14 17
- None 20 13 19 15
Encouragement to continue with education
- A lot 29 31 35 31
- A fair amount 16 14 11 14
- A little 18 19 10 18
- None 34 31 37 33
Lived in care institution 2 5 7 5
Unweighted Base 101 287 67 455
Base: All lone parent participants (claiming IS) starting January-April 2002.
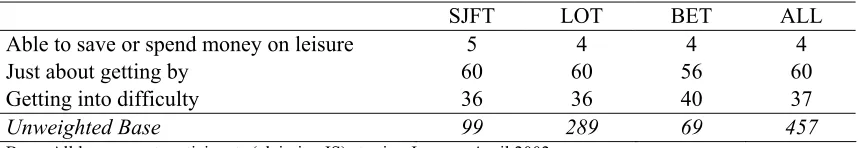
In spite of there being a working adult in the homes of most participants when they were aged 11 to 16, a large proportion of participants in each opportunity type stated that the financial situation during that period was very or quite difficult, Table 2.15.
[image:26.595.87.516.149.361.2]Table 2.15 Parental employment and childhood financial situation
Figures in percentages
SJFT LOT BET ALL
Parental employment when aged 11-16
- Always at least one working parent 81 68 67 71
- Period when no working parent 17 27 25 25
Lived in a care institution 2 5 7 5
Unweighted Base 101 286 66 453
Financial situation when aged 11-16
- Very difficult 22 22 24 22
- Quite difficult 21 30 17 26
- Neither easy nor difficult 26 21 17 21
- Quite easy 22 13 21 16
- Very easy 9 8 14 9
- Unsure 0 2 0 2
Lived in a care institution 2 5 7 5
Unweighted Base 101 288 67 456
Base: All lone parent participants (claiming IS) starting January-April 2002.
2.6
Self-identified barriers to unemployment
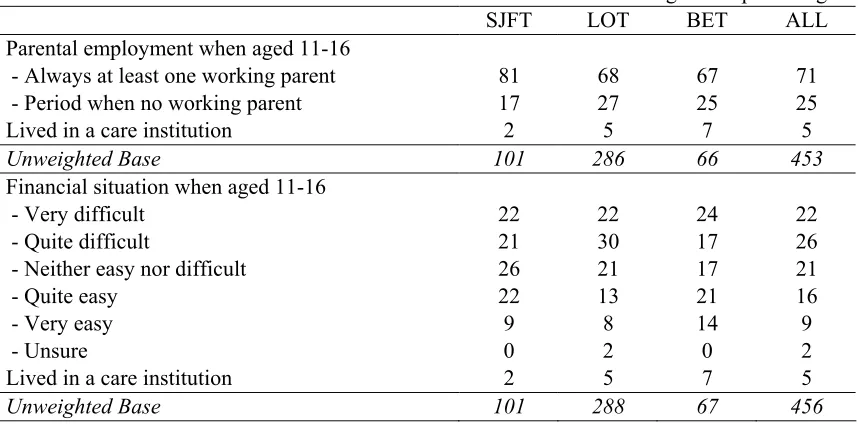
Even if, for example, an individual has low or no qualifications, they may not view this as a disadvantage in finding work if the type of work they are seeking does not require any qualifications. Table 2.16 shows the factors respondents identified as either stopping them or making it difficult for them to look for/start work in November/December 2001 (prior to starting WBLA).
While nine per cent of participants were in paid work or other activities in
November/December 2001, 78 per cent identified one or more factors which prevented them from looking for/starting work at that time. Unsurprisingly, the most common factor
identified by lone parents was their caring responsibilities – citing either a lack of childcare or their wish not to leave their children. A lack of previous work experience was also a
commonly identified type of barrier, identified by 13 per cent of participants. Other factors identified included the individual’s own illness or disability, financial issues and a lack of transport. Given that few lone parent participants lived in temporary accommodation and only seven per cent had ever been convicted of a crime prior to January 2002, it was expected that few would cite these factors as barriers to employment.
Table 2.16 Barriers to employment in November/December 2001
Figures in percentages
SJFT LOT BET ALL
Caring related issues 41 50 49 48
- Lack of childcare 27 28 31 28
- Do not want to leave children 19 22 19 21
- Illness of other family member 3 8 10 7
Lack of skills/experience 14 18 23 18
- Lack of previous work experience 9 14 16 13
- Lack of references from previous employers 5 6 8 6
- Poor literacy 1 1 6 2
- Poor English 0 0 2 0
- Lack of qualifications/education 1 4 3 3
Own illness/disability 10 12 8 11
No jobs available locally 12 9 6 9
Lack of transport 11 6 2 6
Other personal problems 7 13 10 11
- Debt or financial reasons 5 12 7 10
- No permanent place to live 1 0 1 0
- Problems with the police/criminal record 1 0 0 0
- Problems with drugs or alcohol 1 1 0 1
- Family or relationship problems 0 1 1 1
Discrimination 2 3 2 3
Other 9 9 7 8
Any barriers 71 82 75 78
No barriers 16 10 18 13
Working or doing something else at this time 13 8 7 9
Unweighted Base 100 287 69 456
Base: All lone parent participants (claiming IS) starting January-April 2002.
2.7
Comparison with JSA participants
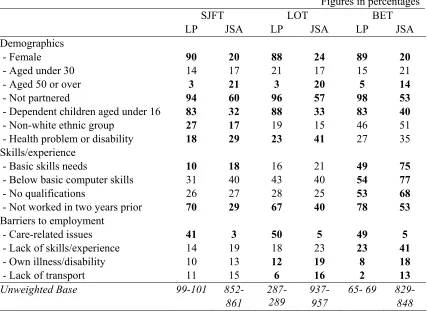
Lone parent participants (who were claiming IS) were qualitatively different to those JSA claimants who participated in WBLA. Unsurprisingly, they were significantly more likely to be female, have dependent children aged under 16 and have been without a partner at the beginning of January 2002, Table 2.17. The lone parents were slightly younger on average and less likely to be aged 50 or more. Those who went on to participate in SJFT and LOT were also less likely to have a disability or health problem which affected the work they could do.
Lone parent participants also differed from JSA participants in terms of skills and
qualifications. Across all opportunities, they were less likely to have basic skills needs. Those who participated in BET were also less likely to have below basic IT skills or to have no qualifications. Lone parent and JSA participants undertaking SJFT and LOT were relatively similar in these respects.
Table 2.17 Comparison of lone parent participants and JSA participants
Figures in percentages
SJFT LOT BET
LP JSA LP JSA LP JSA
Demographics
- Female 90 20 88 24 89 20
- Aged under 30 14 17 21 17 15 21
- Aged 50 or over 3 21 3 20 5 14
- Not partnered 94 60 96 57 98 53
- Dependent children aged under 16 83 32 88 33 83 40
- Non-white ethnic group 27 17 19 15 46 51
- Health problem or disability 18 29 23 41 27 35
Skills/experience
- Basic skills needs 10 18 16 21 49 75
- Below basic computer skills 31 40 43 40 54 77
- No qualifications 26 27 28 25 53 68
- Not worked in two years prior 70 29 67 40 78 53
Barriers to employment
- Care-related issues 41 3 50 5 49 5
- Lack of skills/experience 14 19 18 23 23 41
- Own illness/disability 10 13 12 19 8 18
- Lack of transport 11 15 6 16 2 13
Unweighted Base 99-101 852-
861
287-289
937- 957
65- 69 829- 848 Note: Where the figures are in bold, the difference is significant at five per cent level.
The barriers to employment faced by lone parent and JSA participants also differed. Lone parent participants were more likely to cite childcare related issues as a barrier and less likely to cite a lack of skills/experience, illness/disability or a lack of transport (although not always significantly so).
2.8
Summary
Lone parent participants were predominantly women with dependent children under the age of 16. They were more diverse in other respects, such as in terms of age, ethnicity,
qualifications and skills (in addition to a range of other characteristics). Furthermore, there were notable differences between those who participated in different opportunities.
Unsurprisingly, those lone parents who went on to participate in BET tended to be the most disadvantaged. Compared with SJFT and LOT participants, a greater proportion had poor basic skills, poor IT skills and no qualifications. They also faired poorly in terms of access to basic goods and services. SJFT and LOT participants were generally more similar to each other but even among these groups, there were still sizeable proportions with poor IT skills or no qualifications.
3
Participation in WBLA
3.1
Introduction
Work Based Learning for Adults offers participants a tailor-made package which can include formal training, employer work placements and/or assistance with job search. It is, therefore, of interest to know what the cohort in question actually did while participating in this programme and whether they thought the training was useful or not. Unfortunately, our capacity to do this is limited by the ability of participants to remember their participation. After examining the extent of participant recall, this chapter considers what type of assistance participants received and their views about whether (and how) WBLA helped them.
3.2
Identification of participation in WBLA
While administrative data indicates that all respondents had participated in WBLA, many did not remember participating in any government training schemes, let alone WBLA
specifically. Over one third of all participants did not recall having started to participate in any government training between January and April 2002, Table 3.1. Furthermore, a number of those who did recall participating in training did not identify WBLA as the programme under which they had received training. (In spite of this, it is reasonable to assume that the training they identified was in fact that which they received under WBLA, particularly as the branding of WBLA is relatively low-key compared with New Deal programmes.)
Table 3.1 Identification of training starting January-April 2002
Figures in percentages
SJFT LOT BET ALL
Identified participating in WBLA 25 20 27 22
Identified participating in other government training 30 49 34 43
No training identified 45 31 40 35
Unweighted Base 101 289 69 459
Base: All lone parent participants (claiming IS) starting January-April 2002.
Table 3.2 Identification of training by duration
Figures in percentages Six weeks or less 7-13 weeks More than 13
weeks
Identified participation 52 69 79
No training identified 48 31 21
Unweighted Base 165 134 133
Base: All lone parent participants (claiming IS) starting January-April 2002.
The majority of this chapter focuses upon those participants who did recall participating in training starting between January and April 2002. It therefore must be remembered that much of the following analysis only provides a partial picture.
3.3
Entry onto WBLA
Prior to participating, the vast majority (73 per cent) of self-identified participants discussed the programme with Jobcentre staff. Thirty-six per cent discussed participation with a Personal Adviser and 14 per cent talked to a training provider. The majority of lone parent participants, who identified participating in WBLA, very much wanted to get involved, Table 3.3.
Table 3.3 How much wanted to get involved
Figures in percentages
SJFT LOT BET ALL
Very much (66) 80 - 73
Quite a lot (24) 7 - 14
Not much (10) 12 - 11
Not at all (0) 2 - 2
Unweighted Base 25 59 18 102
Base: All those who identified participating in WBLA.
Individuals may be granted early entry onto WBLA for a number of reasons (see Chapter One). Sixteen per cent of those participants who recalled participating in WBLA said that they were able to join the programme early. The reasons given for their early entry included, unsurprisingly, being on New Deal for Lone Parent or being a woman returner.9
3.4
Duration and activities undertaken
Within WBLA, the training offered under each opportunity is expected to be of different durations. For the majority of participants, their training lasted between five and 26 weeks, Table 3.4. BET and LOT participants generally undertook training for between seven and 26 weeks. SJFT participants’ training tended to be shorter, generally lasting between five and 13 weeks. This is more or less in line with the expected durations of each opportunity, as
outlined in Chapter One, but it should be noted that training can last longer than anticipated. Shorter training periods are also evident, possibly due to participants leaving the programme prior to completion.
9 Due to the small number of lone parent participants who identified entering WBLA early, it was not
Table 3.4 Duration of training
Figures in percentages
SJFT LOT BET ALL
One week or less 2 0 (2) 1
Two week or less (>1) 2 2 (0) 1
Four week or less (>2) 9 6 (5) 6
Six week or less (>4) 47 6 (7) 13
13 week or less (>6) 22 42 (17) 35
26 week or less (>13) 7 35 (65) 34
39 week or less (>26) 4 5 (4) 5
More than 39 weeks 8 6 (0) 5
Unweighted Base 54 199 41 294
Base: All those who identified participating in training starting January-April 2002.
The content of the training also differed between opportunity types. In most cases, the training participants undertook was what they most wanted to do, although a proportion claimed they did not really want to do it, Table 3.5. This was significantly more likely among non-white participants (18 per cent compared with six per cent of white participants).
Table 3.5 Whether training was what participant wanted to do
Figures in percentages
SJFT LOT BET ALL
What most wanted to do – first choice 79 77 (71) 76 What wanted to do but not first choice 14 15 (17) 15 Something did not really want to do 7 8 (12) 8
Unweighted Base 56 198 41 295
Base: All those who identified participating in training starting January-April 2002.
By far the most common activity undertaken while on WBLA was a training course at either an employer’s premises, a college or training provider’s premises, Table 3.6. In 63 per cent of cases, these resulted in the participant gaining a qualification or credits towards a
qualification. Working at an employer’s premises was less common. Just over one third of all self-identified participants did so, although this was more common among LOT participants.
Table 3.6 Activities undertaken
Figures in percentages
SJFT LOT BET ALL
A training course 90 90 (92) 91
Work at an employers 11 43 (28) 35
Job search 14 11 (10) 11
Basic skills training 0 1 (5) 1
IT training 4 5 (6) 5
Home-study 6 9 (2) 8
Unweighted Base 53 196 39 288
Base: All those who identified participating in training starting January-April 2002.
3.5
Leaving the training early
Of all lone parent participants who recalled starting training, 23 per cent left the programme before the end, Table 3.7. This was the case for only nine per cent of SJFT participants. This may be because SJFT primarily offers shorter courses and, therefore, people were more likely to complete the training even if they were not particularly enjoying it or were having
difficulties attending.
Table 3.7 Whether left training early
Figures in percentages
SJFT LOT BET ALL
Left training early 9 25 (29) 23
Completed training 91 75 (71) 77
Unweighted Base 55 198 42 295
Base: All those who identified participating in training starting January-April 2002.
In most cases (84 per cent), it was the participants themselves who decided to leave. In 15 per cent of cases, the training provider was involved in the decision and in three per cent of cases the employer was involved. Participants most often left due to personal reasons (26 per cent), because they had found a job (17 per cent) or because they were dissatisfied with the training (19 per cent).
3.6
Usefulness of training
The majority of self-identified participants had found the training very or quite useful, Table 3.8.
Table 3.8 Usefulness of training
Figures in percentages SJFT LOT BET ALL
Very useful 63 57 (46) 57
Quite useful 21 22 (34) 24
Not very useful 10 10 (4) 9
Not at all useful 5 11 (17) 10
Unweighted Base 56 198 42 296
Base: All those who identified participating in training starting January-April 2002.
Table 3.9 Usefulness of training by whether completed training and whether gained a qualification
Figures in percentages Completed training Left training early Gained qualification
Did not gain qualification
Very useful 61 41 66 42
Quite useful 23 28 24 25
Not very useful 9 10 7 12
Not at all useful 7 22 3 21
Unweighted Base 228 67 162 107
Base: All those who identified participating in training starting January-April 2002 who thought the training was useful.
The ways in which the lone parent participants found the training useful varied, Table 3.10. Around one third of all participants said that it helped to increase their self-confidence. Other popular ways were that it helped them with their job search, or because they had gained a qualification or new skills.
Table 3.10 Ways in which the training was useful
Figures in percentages
SJFT LOT BET ALL
Increased self-confidence 37 30 (33) 32
Helped with job search 28 15 (34) 20
Gained a qualification 12 20 (8) 17
Gained new skills 19 16 (16) 16
Improved IT skills 8 17 (2) 14
Met/got to know people 4 9 (7) 8
Updated existing skills 9 3 (7) 4
Improved English, reading, writing 0 0 (19) 2
Gave me something to do/got me out of a rut
2 2 (3) 2
Unweighted Base 50 171 33 254
Base: All those who identified participating in training starting January-April 2002 who thought the training was useful.
As the ‘usefulness’ of training may relate to aspects unconnected with employment, self-identified participants were also asked specifically about whether their training had helped them to get a job. Thirty-five per cent had been employed since WBLA and said that their training had helped them to get a job, Table 3.11. (This accounts for 65 per cent of those self-identified participants who had been in paid work since participation). Those lone parents who completed their training were more likely to say that it had helped them to get a job than those who left before the end (39 per cent compared with 22 per cent).
Table 3.11 Whether training helped participants get a job
Figures in percentages
SJFT LOT BET ALL
Training helped to get a job 26 40 (22) 35
Training did not help to get a job 31 17 (12) 19
Did not have a job 43 43 (67) 46
The most common way in which training had helped participants to get a job was by increasing their self-confidence, Table 3.12. They were also helped by the training in other ways including gaining a qualification required by an employer, their work placement becoming a paid job and by gaining work experience.
Table 3.12 Ways in which the training helped the participant to get a job
Figures in percentages
ALL
Increased self-confidence 66
Gained qualification required by employer 38
Employer placement became a job 30
Gained work experience, employer references 24
Helped you to attend job interviews 23
Helped to persuade employers to interview you 16
Improved English, reading, writing 9
Unweighted Base 103
Base: All those who identified participating in training starting January-April 2002 who thought the training had helped them to get a job.
Unfortunately, the small unweighted bases limit the extent to which views about training could be examined among sub-groups of participants. There were some slight differences between the views of self-identified participants by their characteristics, Table 3.13. However, it is crucial to remember that this only describes the views of those who recalled participating in training. Consequently, these differences can only give a possible indication of how training was viewed by different groups.
Table 3.13 Usefulness of training and whether training helped participant to get a job by participant characteristics
Figures in percentages (Unweighted n)
ALL Per cent useful Per cent helped to get job
White 81 (226) 39 (226)
Non-white 77 (63) 21 (63)
Disability, health problem 72 (71) 22 (71)
No disability, health problem 83 (225) 39 (225)
No qualifications 75 (81) 31 (81)
One or more qualifications 83 (215) 37 (215)
In paid work within year prior 83 (59) 35 (59) Not in paid work in the year prior 80 (227) 35 (227)
ALL 81 (286) 35 (286)
Base: All those who identified participating in training starting January-April 2002. Note: Where the figures are in bold, the difference is significant at five per cent level.
Table 3.14 Usefulness of training and whether it helped participants to get a job
Figures in percentages SJFT LOT BET ALL
Useful or very useful 47 55 48 52
Not useful 9 14 12 13
Did not identify training 45 31 40 35
Unweighted Base 101 288 69 458
Identified training and helped to get a job 15 28 13 23 Identified training but did not help 41 41 47 42
Did not identify training 45 31 40 35
Unweighted Base 101 288 69 458
Base: All lone parent participants (claiming IS) starting January-April 2002.
3.7
Comparison with JSA participants
Due to the large proportion of lone parent and JSA participants who were unable to remember participating in WBLA, no valid comparisons can be made between the views of these two groups.
3.8
Summary
Unfortunately, individuals who participate in training sometimes do not recall doing so. This was the case for a large number of lone parent WBLA participants. Consequently, the survey data can only provide a partial view of what they did on WBLA and their views on the training received. Those who were able to identify their participation predominantly
undertook formal training courses, with many gaining qualifications as a result. The majority found the training to be useful, particularly if they had completed the training and/or gained a qualification. A smaller proportion thought that their training had helped them to get a job, often because it had lead to increased self-confidence or a qualification.
4
Paid work undertaken after WBLA
4.1
Introduction
Lone parent participants have entered many different types of employment since Work Based Learning for Adults, some preferable to others in terms of hours, pay or contract type. This chapter examines the types of work undertaken. It considers the occupation and industry of their most recent jobs and the methods by which the participants found their jobs. Contract type, hours worked, pay and other compensations are then examined before looking at the childcare needs of employed participants. Finally, qualification requirements of their work and the training received, if any, are discussed.
4.2
Whether worked since WBLA
Since participating in WBLA, 48 per cent of lone parents had entered paid work.10 This was
significantly less common among BET participants compared with SJFT and LOT
participants (28 per cent compared to 53 and 52 per cent respectively). Unsurprisingly the proportion who had been employed since their training differed between various sub-groups of participants, Table 4.1.
Table 4.1 Proportion employed since starting WBLA by participant characteristics
Figures in percentages (Unweighted base)
ALL
White 53 (346)
Non-white 34 (106)
Disability, health problem 32 (106)
No disability, health problem 53 (353)
No qualifications 43 (142)
One or more qualifications 51 (316)
In paid work within year prior to WBLA 56 (102) Not in paid work in the year prior to WBLA 47 (343)
ALL 48 (459)
Note: Where the figures are in bold, the difference is significant at 5 per cent level.
Not all of those who had entered paid employment were still employed at the time of interview; only 40 per cent of all lone parent participants were employed when interviewed (45 per cent of SJFT participants, 43 per cent of LOT participants and 23 per cent of BET participants). The reasons given for no longer being employed included the job being temporary or for a fixed contract, being made redundant and personal reasons.11
The vast majority of those who had been in paid work since WBLA were employees in their most recent job. The remainder of this chapter examines the types of work undertaken by
10 This was a similar proportion to that reported for participants in New Deal for Lone Parents nine
these participants. Unfortunately, there were too few respondents who were self-employed to examine in detail, Table 4.2.
[image:38.595.85.515.394.619.2]Table 4.2 Employment status: most recent post-WBLA employment
Figures in percentages SJFT LOT BET ALL
Employee 47 50 28 46
Self-employed 6 2 0 2
No employment since WBLA 47 49 72 52
Unweighted Base 101 289 69 459
Base: All lone parent participants (claiming IS) starting January-April 2002.
4.3
Occupation and employer characteristics
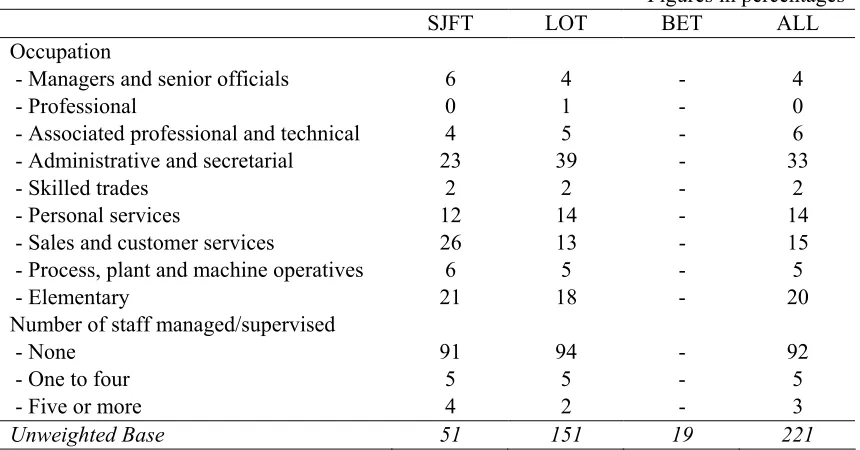
One third of the lone parent participants who went on to work were employed in
administrative or secretarial occupations, Table 4.3. Given the female-domination of this occupational group and the profile of lone parents, this is not surprising. Many others were employed in personal service occupations, sales and customer service or elementary
(unskilled) occupations. Some of these occupations offer more scope for part-time and more flexible working arrangements which can be helpful to those with childcare responsibilities. Few of the employed participants had any managerial or supervisory responsibilities.
Table 4.3 Occupation and managerial/supervisory duties
Figures in percentages SJFT LOT BET ALL
Occupation
- Managers and senior officials 6 4 - 4
- Professional 0 1 - 0
- Associated professional and technical 4 5 - 6
- Administrative and secretarial 23 39 - 33
- Skilled trades 2 2 - 2
- Personal services 12 14 - 14
- Sales and customer services 26 13 - 15
- Process, plant and machine operatives 6 5 - 5
- Elementary 21 18 - 20
Number of staff managed/supervised
- None 91 94 - 92
- One to four 5 5 - 5
- Five or more 4 2 - 3
Unweighted Base 51 151 19 221
Base: All lone parent participants (claiming IS) starting January-April 2002 who have worked since participation.
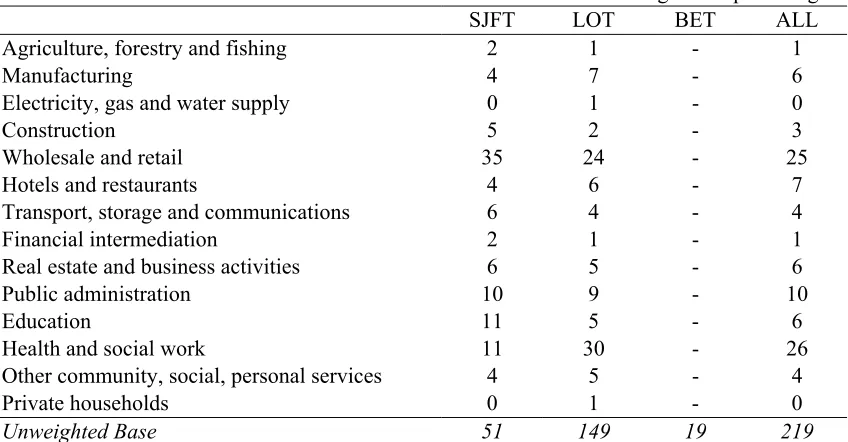
Table 4.4 Industry
Figures in percentages
SJFT LOT BET ALL
Agriculture, forestry and fishing 2 1 - 1
Manufacturing 4 7 - 6
Electricity, gas and water supply 0 1 - 0
Construction 5 2 - 3
Wholesale and retail 35 24 - 25
Hotels and restaurants 4 6 - 7
Transport, storage and communications 6 4 - 4
Financial intermediation 2 1 - 1
Real estate and business activities 6 5 - 6
Public administration 10 9 - 10
Education 11 5 - 6
Health and social work 11 30 - 26
Other community, social, personal services 4 5 - 4
Private households 0 1 - 0
Unweighted Base 51 149 19 219
Base: All lone parent participants (claiming IS) starting January-April 2002 who have worked since participation. Note: This is based on Standard Industrial Classification SIC92.
The majority worked for employers with multiple sites and at establishments with fewer than 100 staff, Table 4.5.
Table 4.5 Number of sites and number of employees
Figures in percentages SJFT LOT BET ALL Number of sites
- single 19 36 - 33
- multiple 79 62 - 64
- unsure 2 2 - 2
Unweighted Base 51 151 19 221
Number of employees
- 1 to 9 23 22 - 24
- 10 to 24 14 20 - 19
- 25 to 99 27 29 - 26
- 100 to 499 31 15 - 20
- 500 or more 6 15 - 12
Unweighted Base 51 150 19 220
Base: All lone parent participants (claiming IS) starting January-April 2002 who have worked since participation.
4.4
Applying for the job
Table 4.6 How heard about the job
Figures in percentages
SJFT LOT BET ALL
Advert 27 29 - 28
Asked to apply for job by employer 20 19 - 20
Jobcentre 20 18 - 19
Through direct contact with the employer 18 11 - 12 Through friends, relatives or neighbours 6 10 - 11
Private recruitment agency 6 6 - 6
Other 3 7 - 5
Unweighted Base 51 151 19 221
Base: All lone parent participants (claiming IS) starting January-April 2002 who have worked since participation.
On occasions, other people persuaded the employer to interview or recruit the participants. Around one quarter of employed lone parent participants claimed that someone had had an influential role on their recruitment. This influence was predominantly that of another employee, Table 4.7.
Table 4.7 Whether anyone persuaded the employer to interview/recruit
Figures in percentages
SJFT LOT BET ALL
Someone persuaded 24 25 - 26
- Someone else at work/another employee 4 7 - 7
- Placement employer 2 4 - 4
- Personal Adviser 0 4 - 3
- New Deal staff member 2 3 - 4
- Someone at Jobcentre 0 2 - 1
- Someone at employment agency 4 2 - 2
- Training provider 4 4 - 4
- Husband, wife or partner 0 1 - 1
- Relative or friend 6 3 - 4
- Someone else 2 1 - 2
No-one 76 75 - 75
Unweighted Base 51 150 19 220
Base: All lone parent participants (claiming IS) starting January-April 2002 who have worked since participation.
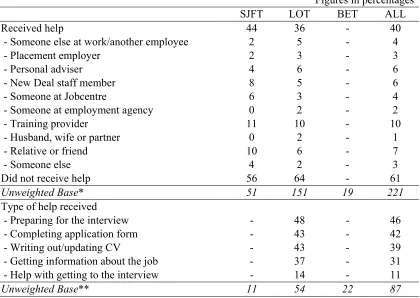
Two out of five participants also got help from other people with the application process, Table 4.8. Such help was received from a wide range of sources, both formal and informal, but many got help from their training provider or friends and relatives. The help received included assistance with interview preparation, help with application forms and CVs, and getting information about the job.
Table 4.8 Whether received help with applying for job
Figures in percentages
SJFT LOT BET ALL
Received help 44 36 - 40
- Someone else at work/another employee 2 5 - 4
- Placement employer 2 3 - 3
- Personal adviser 4 6 - 6
- New Deal staff member 8 5 - 6
- Someone at Jobcentre 6 3 - 4
- Someone at employment agency 0 2 - 2
- Training provider 11 10 - 10
- Husband, wife or partner 0 2 - 1
- Relative or friend 10 6 - 7
- Someone else 4 2 - 3 <