Improving performance of bay irrigation through
higher flow rates
Malcolm Gillies
1,2,3*Rod Smith
1,2,3Bill Williamson
1and Matthew Shanahan
41 CRC for Irrigation Futures, P.O. Box 56, Darling Heights, Qld 4350, Australia
2 National Centre for Engineering in Agriculture, West Street, Toowoomba Qld 4350, Australia 3 University of Southern Queensland, West Street, Toowoomba Qld 4350, Australia
4 RM Consulting Group, Mollison St, Bendigo, Vic 2410, Australia
Corresponding and presenting author, [email protected]
Abstract
Bay (border check) irrigation systems are utilised extensively throughout the Goulburn Murray Irrigation District (GMID). However, the performance of these systems have rarely been assessed, in part due to the difficulty in determining the soil intake function. The CRC for Irrigation Futures has recently completed a project to demonstrate the Irrimate™ performance evaluation process in bay irrigation through on-farm trials. The Irrimate™ approach originally developed for furrow irrigation has already provided real benefits to farmers and has been accepted across the cotton industry.
Bay irrigation has a number of unique characteristics which presented a number of challenges for the tools used to evaluate furrow irrigation. Informed by field trials, new monitoring strategies were tested and new modelling approaches developed in order to provide the same robust evaluation procedure for bay systems. Evaluations provide objective information to irrigators both quantifying efficiencies of current practices and providing strategies to improve performance.
Trials were conducted across 11 sites in order to benchmark current performance and to examine the potential advantages of higher flow rates. Performance varied widely between sites with application efficiencies ranging from 45.9% to 89.5%. Initial modelling indicated that higher flow rates offer potential to increase efficiency. Trials in the second season confirmed the modelling work demonstrating water savings in excess of 20% through flow rates approximately double the conventional rates. The results also show that higher flow rates do not automatically lead to higher efficiency. When adopting higher flow rates irrigators must have greater control over cut-off times. System evaluation is an essential step to reap the benefits of higher flows. The results of this study provide objective information for the modernisation of irrigation systems in the GMID.
Introduction
Irrigated pasture is the single largest water user in Australia, accounting for approximately one third of the total volume of water applied for agriculture. Despite low water availability in Victoria, pasture consumed 58.3% of the state’s agricultural water use in 2008-09 (ABS, 2010), this percentage is down from previous years for example in 2005-06 where pasture accounted for 75.2% of water use (ABS, 2008). The majority of this pasture is grown for the purpose of milk production which is the most significant agricultural commodity in Victoria. The predominant irrigation technique used across the dairy industry is the bay (border check) system. Bay irrigation is a form of surface irrigation where the field is divided into “bays” typically 20-80 metres wide with zero cross slope. Water is applied to the top end of the bay and flows by gravity over the entire bay surface towards the downstream end of the field.
systems involves additional costs and introduces new management issues. Wood et al. (2007) demonstrated a net economic benefit with farm-wide conversion from bay to centre pivot. However, the positive outcome was reliant on a decrease in ML/ha, an increase in yield per hectare and an expansion of the farm size with the potential water saved. Returns on investment are sensitive to factors out of the irrigator’s control (e.g. interest rates, commodity and water prices). It is dangerous to generalise the benefits of system conversion, adoption should be considered in a case by case analysis.
The Irrimate™ surface irrigation evaluation system has been used extensively throughout Australia to evaluate furrow irrigation, most notably in the cotton and sugar industries. Irrimate™, developed by the National Centre for Engineering in Agriculture (NCEA) includes the field measurement techniques and models that enable evaluation of system performance and testing of improved management strategies (Dalton, et al., 2001). Irrigation bays are essentially wide furrows, and hence the techniques designed for furrow irrigation should suffice. However, past experience has shown that both the measurement equipment and modelling approaches do not perform satisfactorily in all situations. It is clear that work is required in order to adapt the Irrimate™ approach to bay irrigation.
Previous studies have established substantial scope for improvements in water use efficiency of surface irrigation. For example, Smith et al. (2005) conducted an analysis of 79 furrow irrigation events under normal grower management and demonstrated potential efficiency gains of an average 20%. This improvement in performance could be achieved through an increase of the furrow flow rate to 6 L/s and reducing the irrigation time accordingly but with no significant modification to the field design or management. Initial modelling analysis indicates that higher flow rates offer similar advantages for bay irrigation.
The major value of the Irrimate™ system is the ability to evaluate existing systems and to prescribe changes in management to increase water use efficiencies. In an independent study the BDA group (2007) estimated that adoption of the Irrimate™ for furrow irrigation has already contributed to an increase in water use efficiency of 10% in the Australian cotton industry, with a further 10% expected by 2014. This equates to total water savings of 400 GL over the 16 years considered and 36 Million dollars in present value benefits to the industry.
Similar approaches have been applied in bay irrigation for experimental purposes but in no cases has this work lead to a commercially applied assessment of performance or prescription of improved management practices (Smith, et al., 2009). The performance of bay systems throughout the region has rarely been assessed, in part due to difficulties in estimating the soil infiltration characteristics. It is believed that experience in furrow irrigation can be used to provide a similar robust approach for evaluation of bay irrigation in the GMID.
This paper is a follow up to that presented by Smith, et al. (2009) who used computer simulations of generic fields to indentify the performance gains possible with higher flow rates. This paper extends the research further, firstly by demonstrating improved measurement and modelling techniques and secondly by using a combination of field trials and modelling to investigate the potential benefits of high flow border irrigation.
Methodology
Field Sites
most common soil types within the district with textures ranging from heavy soils to light sandy soils.
The trials were conducted under normal field conditions over two growing seasons: season 1 in the summer of 2008-2009 and season 2 in the summer of 2009-2010. As a result of the low water allocations experienced during the study it is likely that the selected sites are biased towards the more efficient irrigators and more profitable enterprises.
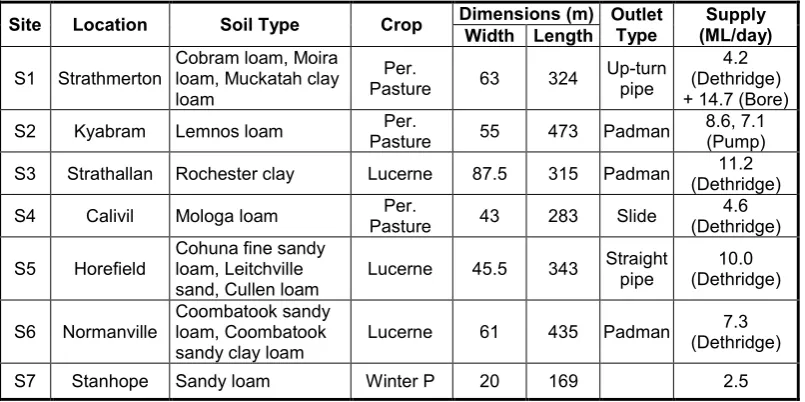
A total of 7 sites were monitored during the first season as shown in Table 1. Each site was monitored for 1 irrigation event, except S1 and S2 which were evaluated twice. In the second season 4 additional sites were chosen (Table 2) to evaluate irrigation performance under high flow irrigation conditions.
Table 1: Sites for Season 1
Site Location Soil Type Crop Dimensions (m) Outlet Width Length Type (ML/day) Supply
S1 Strathmerton Cobram loam, Moira loam, Muckatah clay
loam
Per.
Pasture 63 324
Up-turn pipe
4.2 (Dethridge) + 14.7 (Bore)
S2 Kyabram Lemnos loam Pasture Per. 55 473 Padman 8.6, 7.1 (Pump)
S3 Strathallan Rochester clay Lucerne 87.5 315 Padman (Dethridge) 11.2
S4 Calivil Mologa loam Pasture Per. 43 283 Slide (Dethridge) 4.6
S5 Horefield
Cohuna fine sandy loam, Leitchville
sand, Cullen loam Lucerne 45.5 343
Straight pipe
10.0 (Dethridge)
S6 Normanville Coombatook sandy loam, Coombatook
sandy clay loam
Lucerne 61 435 Padman (Dethridge) 7.3
[image:3.595.98.501.250.451.2]S7 Stanhope Sandy loam Winter P 20 169 2.5
Table 2: Sites for Season 2
Site Location Soil Type Crop Dimensions (m) Outlet Width Length Type (ML/day) Supply
S8 Rochester Rochester clay (knee high) Lucerne 87 369 Portable Pump 20.5
S9 Horefield Reedy Creek clay loam Pasture Ann. 53 254 Portable Pump 18.7
S10 Kyabram Lemnos loam Pasture Per. 69.5 201 Portable Pump 21
S11 Calivil
Yarrawalla fine sandy loam, Yarrawalla loam
Lucerne
(grazed) 60 281
Pipe and Riser
11.5 (Dethridge) + 3.5 (Bore)
Field Measurement Procedure
Direct measurement of the performance of surface irrigation systems is difficult and impractical at the commercial scale. The most effective way to evaluate these systems is via use of a calibrated hydraulic simulation model. The role of field measurement is to collect enough information in order to calibrate this model so it can be as true as possible to the actual irrigation.
S11) required a full survey at multiple points along the bay in order to capture any changes in grade. The surface conditions, pasture and soil type were noted and used to verify the behaviour of the final model.
Surface irrigation evaluation typically involves measurements during the irrigation of:
inflow hydrograph – water applied to the upstream end of the bay
water front advance – times taken to reach various distances along the bay
runoff hydrograph – surface drainage from the downstream end
During the first season the inflow rates at the majority of sites were measured using a custom designed long throated flume with a capacity of up to 15 ML/day. The flow rate is logged continuously to produce both the full inflow hydrograph and the total volume applied. This flume is a scaled version of the Irrimate™ flume flow meter which was designed to measure the flows within a single irrigation furrow. For sites S8, S9 & S10 the flow rates were measured using a portable metered pumping arrangement. The pump allowed testing flow rates in excess of what was possible through the existing supply structure and greater control over the variation in flow rates over time.
The water front advance was measured at a minimum of 6 positions down the length of the bay using Irrimate™ advance sensors. Each sensor consists of eight sets of contacts spaced 5 m apart hence capturing the uniformity of the advance across 35 m of the bay with. At one site a differential GPS was used to characterise the movement of the advance across the full width of the bay. The uniform pattern of the advancing front validated the use of the 1D hydraulic model to represent the 2D surface flows. The drainage conditions at each of the 11 sites did not allow measurement of the runoff flow rates or volumes.
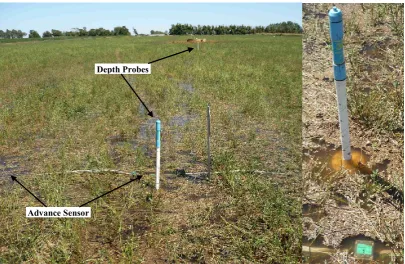
[image:4.595.93.499.477.741.2]During the 2009-2010 season, water depth measurements were collected at several key positions along the length of the field in the middle of the bay. Depth data was captured using logged depth capacitance probes (Figure 1), recording at small time intervals for the entire duration of the irrigation. As backup, manual depth measurements using a ruler were recorded at regular time intervals at the same locations.
Figure 1: Depth probe and advance sensor at site S11
Advance Sensor
The evaluation procedure requires estimates of the soil moisture deficit within the root zone of the crop in order to calculate the target application. Soil moisture deficits were estimated using a soil water balance model with crop evapotranspiration calculated from local weather stations using the Penman Monteith Et0 and site specific crop factors based on
species and pasture condition. All sites during the second season were instrumented with soil moisture monitoring equipment for an unrelated trial, providing backup data if required.
Estimation of Soil infiltration and Surface Roughness
The soil infiltration rate describes the speed at which water is absorbed into the soil profile. It is a time dependent function which can be described using a range of different physically based and empirical equations. The modified Kostiakov (Kostiakov-Lewis) equation is one of the most commonly used empirical functions as it is applicable to a wide range of soil types and forms the basis of the Irrimate™ approach. Here the cumulative infiltrated depth Z (m3/m2) is a function of the opportunity time τ (min.), the time for which
water has been present at the soil surface: and three empirical parameters a, k and f0:
Z
k
a
f
0
I
ak
a1
f
0 Eq. 1The variables a, k are empirical parameters and f0 (m3/m2/min) approximates the final steady
intake rate of the soil. The rate of infiltration I is determined by differentiation.
One alternative used by previous studies (e.g. Austin & Prendergast, 1997; Robertson, et al., 2004) to characterise the soil for border irrigation is the more simplified two parameter linear infiltration function. The linear function is comprised of a crack fill depth followed immediately by a steady intake rate and can be produced from Eq. 1 by setting a = 0. The linear equation performs well on those heavy soils which exhibit cracking but tends to over predict infiltration depth at short opportunity times (Austin & Prendergast, 1997).
The three parameters of Eq. 1 are evaluated using an inverse solution of the volume balance model (IPARM) as described and validated by McClymont and Smith (1996), Gillies and Smith (Gillies & Smith), and later improved with consideration of variable inflow rates (Gillies, et al., 2007). The inverse solution works by adjusting the three parameters (a, k and
f0) of the modified Kostiakov equation until the volume balance model reproduces the
measured water advance and/or runoff measurements. The inverse solution approach works well for furrow irrigation but has two limitations which undermine the techniques performance in bay irrigation: (1) The total reliance on field data collected prior to the time inflow cut-off and (2) the inability of the approach to estimate the Manning roughness parameter.
The volume balance model used by IPARM is a simplification of the physical processes which holds true during the inflow time but fails to reproduce flow behaviour after cessation of inflow. For this reason IPARM only accepts data collected up to the time of cut-off (Gillies, et al., 2007). This a particular issue for many bay systems, where the inflow is stopped early, often well before the advance reaches the end of the field. Where inflow is cut during the advance phase the IPARM estimated parameters only reflect the soil infiltration rates for that top part of the field and for times less than the cut-off time.
An alternative approach, developed recently at USQ overcomes these limitations as it solves the full hydrodynamic equations (conservation of mass and energy) for unsteady spatially varied flow rather than relying on simplifying assumptions such as the volume balance or kinematic wave approximations. This model, SISCO (Surface Irrigation Simulation Calibration and Optimisation) is based on the earlier work by McClymont (2007) and was developed to simulate a wide variety of configurations including bay, furrow and reverse grade furrow systems. The inverse solution of SISCO is not constrained by the cut-off time and can utilise advance, runoff, recession and depth measurements collected over the entire duration of the irrigation event. The ability to use depth measurements is a new development and improves the accuracy of the infiltration equation at later opportunity times. It is proposed that depth measurements can act as a surrogate for runoff measurements which have been shown to improve the accuracy of estimated infiltration parameters compared to those based on the advance data alone (Gillies & Smith, 2005; Scaloppi, et al., 1995; Walker, 2005). The depth measurements (recorded at regular time intervals) can be collected at any position(s) along the length of the bay. The inclusion of depth measurements in the inverse solution also allows SISCO to solve for the Manning roughness parameter n simultaneously with the infiltration parameters.
Modelling, Evaluation and Optimisation
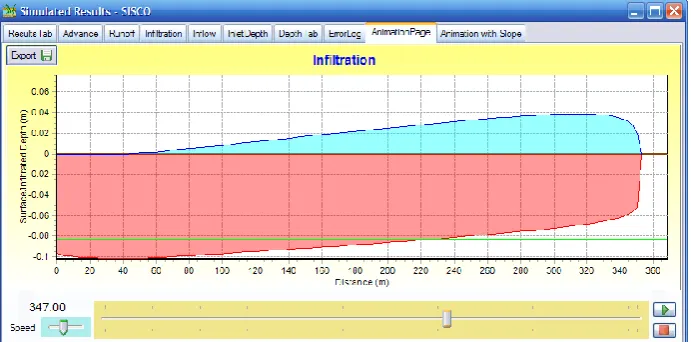
[image:6.595.133.479.463.634.2]The next step in the Irrimate™ process is to evaluate the field using the surface irrigation model SIRMOD (Walker, 2003). Like SISCO, SIRMOD employs the full hydrodynamic equations and is suitable for use in both furrow and bay systems. Once calibrated the model replicates all water flows during the measured event and provides the distribution of water applied to the soil over the length of the field. SIRMOD II (incorporated within Irrimate™) is restricted to constant flows, hence SIRMOD III which can accommodate varying inflow was used for this study. Performance evaluations for the second season were carried out using the SISCO model (e.g. Figure 2). Both models provide performance indices such as the application efficiency (AE), requirement efficiency (RE) and distribution uniformity (DU).
Figure 2: Example simulation from SISCO showing distribution of applied depths (site S8)
At this point it is necessary to define the performance terms. The application efficiency
(AE) describes the volumetric efficiency of the irrigation system and is defined as the ratio of the water added to the root zone store in relation to the total volume applied:
AE Volume added to root zone Volume applied
The requirement efficiency is a measure of the adequacy of the irrigation, or the ability to replenish the soil moisture deficit in the root zone.
RE Volume added to root zone Volume of soil moisture deficit
Eq. 3
The distribution uniformity (DU) is a common indicator used to express the uniformity or evenness of the profile of infiltrated depths over the field. This study uses the low quarter DU which is defined as:
DU Average of the lowest quarter of infiltrated depths Average depth of infiltration
Eq. 4
The calibrated model also offers the ability to test various changes to the management and investigate the impact on irrigation performance. Many factors influence the irrigation performance but have differing significance. Characteristics such as the bay width are impractical and costly to modify over a short timeframe, slope may appear to be important but in reality has a minimal influence on the efficiency (assuming a well graded field). The primary optimisation variables considered in this study are (a) cut-off time, which can be easily modified and (b) inflow rate which may require installation of new head structures but does not require changes in bay design.
Results & Discussion
Estimation of Infiltration and Surface Roughness Parameters for Season 1
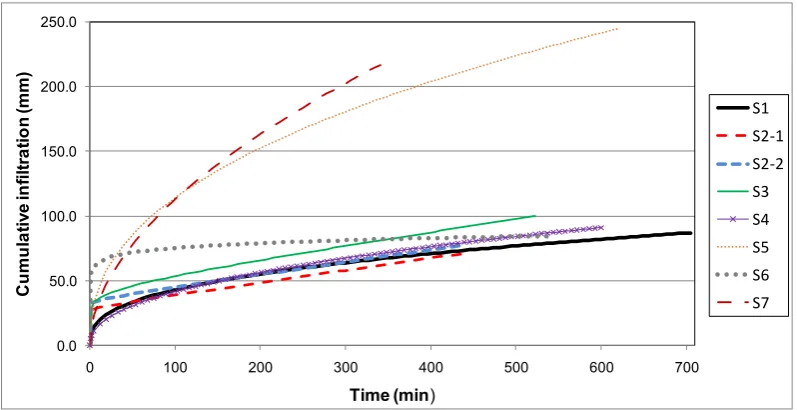
The infiltration parameters for the seven fields of the first season were estimated using the IPARM volume balance approach using the full variable inflow hydrograph and advance measurements. In some cases the characteristics of the irrigation prevented IPARM from working correctly, here the SISCO full hydrodynamic calibration was employed to estimate both infiltration parameters and the surface roughness parameter. The resulting infiltration curves as reported in the preceding paper by Smith et al. are shown in Figure 3.
0.0 50.0 100.0 150.0 200.0 250.0
0 100 200 300 400 500 600 700
C
u
m
u
la
ti
ve
in
fi
lt
ra
ti
o
n
(m
m
)
Time (min)
[image:7.595.99.498.480.685.2]S1 S2-1 S2-2 S3 S4 S5 S6 S7
Estimation of Infiltration and Surface Roughness Parameters for Season 2
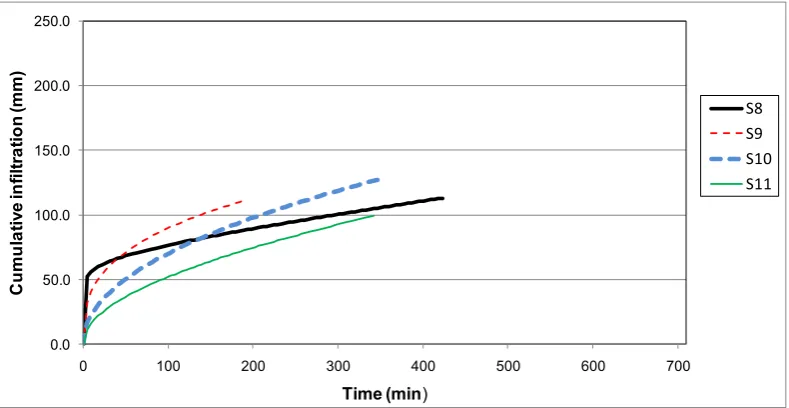
In season 2 the soil infiltration parameters were evaluated using SISCO from a combination of the inflow hydrograph, advance measurements and depth measurements at multiple locations along the bay. The resulting infiltration curves are plotted in Figure 4. The difference in curve shapes can be explained by the soil types (Table 2). Site S8 shows a rapid early infiltration followed by a lower steady rate reflecting a clay soil, S11 has a much steeper shape, indicating a higher steady infiltration rate indicative of a light sandy soil. One interesting point here is that only one out of the four sites in the second season exhibits a cracking clay type infiltration curve and hence it would be inappropriate to represent the remaining curves using the linear infiltration function.
0.0 50.0 100.0 150.0 200.0 250.0
0 100 200 300 400 500 600 700
C
u
m
u
la
ti
ve
in
fi
lt
ra
ti
o
n
(m
m
)
Time (min)
[image:8.595.109.504.215.419.2]S8 S9 S10 S11
Figure 4: Infiltration Curves from field evaluations in season 2
The use of depth measurements allowed the model to estimate the Manning’s surface roughness parameter n with further confidence, values ranging from n=0.187 to 0.386. While high compared to furrow irrigation, these values are consistent with other studies in pasture. It is suggested that either depth or runoff measurements are required in order to accurately indentify this Manning parameter, when relying on advance data alone it is difficult to separate the influences of roughness from that of soil infiltration.
Results of Field Evaluations
Once infiltration and roughness parameters were indentified, each event was modelled using either SIRMOD III or SISCO. The models were operated with all inputs as per the field measurements, therefore the results presented represent the actual irrigation events. The results have been separated into low flow trials in Table 3 (Season 1) and high flow trials in Table 4(season 2). Event 2 from S1 (S1-2) has a high flow rate and is grouped accordingly.
Table 3: Results from low flow bay evaluations from season 1 (Source: Smith, et al., 2009)
Site/ Test
Measured
Flow Time Vol Applied Deficit AE RE Runoff Drain Deep
(ML/d) (ML/d/m) (min) (ML/ha) (mm) (%) (%) (%) (mm)
S1-1 4.2 0.067 690 0.988 71 71.7 100.0 14.4 13.7
S2-1 8.3 0.156 435 0.999 53 54.1 100.0 21.7 24.2
S2-2 7.1 0.129 443 0.841 51 63.0 100.0 6.1 26.0
S3 11.2 0.128 324 0.918 101 86.0 78.0 14.0 0.0
S4 4.6 0.108 285 0.758 65 84.9 98.5 0.0 11.3
S5 10.0 0.220 612 2.426 111 45.9 100.0 2.5 125.2
S6 7.3 0.119 529 1.007 80 79.3 100.0 14.6 6.1
S7 2.5 0.125 295 1.519 >100 54.1* 90.2 0.0 63.8
* advance did not reach the lower end of the field
The measured inflow rates and calculated results for the high flow field trials are presented in Table 4. Here the bay inflows range between 14.6-20.5 ML/day corresponding to 0.234-0.352 ML/day per metre width. Quite deliberately the average flow rate in the high flow trials at 0.268 ML/day/m is double the average flow rate for the standard low flow irrigations (0.132 ML/day/m) measured during the first season. Despite the higher flow rates, the average application efficiency for the high flow trials is 71.6%, only slightly higher than the average efficiency for the low flow trials. Some irrigators when considering higher flow rates are concerned that soils require a long ponding time in order to wet up. The results indicate that this concern is unfounded across the soil types in the study with the requirement efficiency being above 97% in all test sites.
Table 4: Summary of results from high flow bay evaluations from season
Site/ Test
Measured
Flow Time Vol Applied Deficit AE RE Runoff Drain Deep
(ML/d) (ML/d/m) (min) (ML/ha) (mm) (%) (%) (%) (mm)
S1-2 14.7 0.234 215 1.080 62 57.2 99.3 36.0 7.3
S8 20.5 0.235 276 1.222 83.3 68.2 100 15.08 20.4
S9 18.7 0.352 145 1.398 99.8 71.4 100 13.0 21.7
S10 19.2 0.276 111 1.059 97.3 89.5 97.4 2.94 8.3
S11 14.6 0.244 152 0.919 66 71.8 99.9 21.5 6.32
One important difference between the two sets of results is the relative magnitudes of the runoff and deep drainage losses. For the low flow trials the runoff and deep drainage make up 9.2% and 23.5% respectively of the total inflow. For the high flow treatments the total depth applied (ML/ha) remains similar but the runoff and deep drainage losses now make up 17.7% and 10.7% respectively of the total inflow. In terms of a whole farm water balance this represents a recovery of 50% of drainage.
Potential Performance of High Flow Bay Irrigation
[image:9.595.103.494.427.551.2]simple improved strategy was tested using the model; a proposed doubling of the inflow rate and reduction in the cut-off time. The increased flow rate resulted in average water savings of 0.256 ML/Ha (range of 0.077-0.523) across 7 of the 8 events corresponding to a 19% increase in application efficiency.
The field trials in the second season provided the chance to demonstrate these higher flow rates in the field. From Table 4, the higher flow rates did not lead to higher performance with the average efficiency being only marginally higher than the low flow irrigations. It is important to note that no attempt was made to specify optimum cut-off times in the measured events, the management was still controlled by the irrigator.
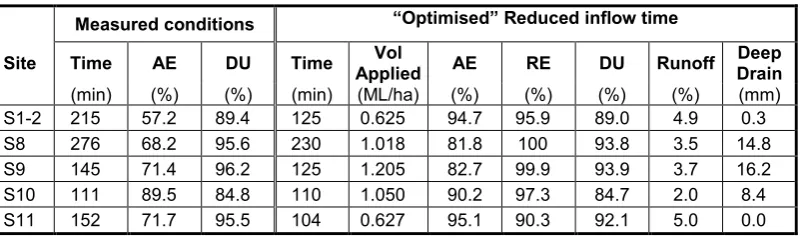
[image:10.595.99.501.324.443.2]In order to demonstrate the potential benefits of higher flows each of the 5 high flow events was simulated with a constant inflow rate equal to that of the measured irrigation and the cut-off time was reduced to limit the runoff fraction back to approx. 5% of the inflow. The results of these simulations (Table 5) represent the potential performance under high flow rates. Here the average application efficiency has been increased to 88.9% and applied depth has decreased from 1.136 to 0.905 ML/ha. For sites S1-2 and S11 the total applied volume drops by 42% and 32% respectively simply by cutting the inflow earlier.
Table 5: Optimising high flow irrigations by adjusting cut-off time
Measured conditions “Optimised” Reduced inflow time
Site Time AE DU Time Applied Vol AE RE DU Runoff Deep Drain
(min) (%) (%) (min) (ML/ha) (%) (%) (%) (%) (mm)
S1-2 215 57.2 89.4 125 0.625 94.7 95.9 89.0 4.9 0.3
S8 276 68.2 95.6 230 1.018 81.8 100 93.8 3.5 14.8
S9 145 71.4 96.2 125 1.205 82.7 99.9 93.9 3.7 16.2
S10 111 89.5 84.8 110 1.050 90.2 97.3 84.7 2.0 8.4
S11 152 71.7 95.5 104 0.627 95.1 90.3 92.1 5.0 0.0
From the results in Table 5 it is clear that at high flow rates the performance is far more sensitive to the cut-off time than for equivalent low flow irrigations. If any of those times are reduced further, there is danger of the water not reaching the end of the bay.
Discussion
The trials conducted for this study have provided the opportunity to adapt the evaluation system to bay irrigation and improve overall confidence in the technique across all surface systems. The characteristics of bay operation presented several difficulties for monitoring which required alternative measurements such as the use of the portable pump for inflows and depth measurements as a surrogate for runoff. When using the inverse approach to estimate infiltration, the infiltration parameters only describe the soil intake behaviour for times up to the end of the measured data. This was a major issue for the IPARM approach traditionally used to evaluate surface irrigation which can only utilise measurements up to the cut-off time. The recently developed SISCO inverse technique overcomes this limitation by applying the rigorous full hydrodynamic model which can utilise advance and runoff measurements over the entire event. Furthermore the addition of depth measurements in the evaluation allows greater confidence in the estimated infiltration parameters. SISCO also adds the ability to evaluate the Manning’s surface roughness coefficient which was previously estimated by guesswork.
times alone. Adoption of higher flow rates combined with optimised cut-off times has the potential to reduce water use by over 20% compared to the measured irrigations. However, the properties sampled within this study are likely to be at the high end of the industry so one would expect that that potential water savings are much higher across the entire industry.
The adoption of high flow rates does not automatically result in higher water use efficiency. The irrigator must take extra care in the control of irrigation run times requiring a better understanding of the crop requirements and soil behaviour. Surface irrigation evaluation techniques such as Irrimate™ provide the tools to gather the necessary information and the ability to identify appropriate management strategies. In many cases the “optimised” run times are short with a smaller margin for error compared to conventional flow rates. Full realisation of the benefits of high flow rates and shorter run times will in many cases require both on-farm and off farm automation.
Conclusions
A study was conducted in order to demonstrate the use of surface irrigation evaluation and the benefits of higher flow rates. Evaluations were conducted at 11 sites testing both conventional low flow rates and high flow rates. Performances of individual fields varied widely with application efficiencies varying from 45.9 % up to 89.5%. Simulations indicate that the efficiencies can be increased to over 80% in most instances with no alterations to bay design. Field experiments confirmed the findings of earlier modelling work that higher flow rates offer considerable potential for water savings. The results provide new and objective information for the modernisation of irrigation systems in the GMID. The study also demonstrates the vital importance of system evaluation for bay irrigation system design and operation.
Acknowledgements
The authors would like to thank those who have been involved in collecting field measurements over the 2 seasons of this study. For season 1: Michael Zerk (SARDI) for assistance at the first two sites and Price Merrett Consulting. For season 2: RM Consulting, CropSol, particularly Eric Hudson and Don Griffin (NSW I&I). The authors must also acknowledge the Northern Victorian Irrigation Renewal Project (NVIRP) and the Cooperative Research Centre for Irrigation Futures (CRC IF) for funding and support.
References
ABS (2008). 4618.0 - Water Use on Australian Farms 2005-06: Australian Bureau of Statistics.
ABS (2010). 4618.0 - Water Use on Australian Farms 2008-09: Australian Bureau of Statistics.
Austin, N. R., & Prendergast, J. B. (1997). Use of kinematic wave theory to model irrigation on cracking soil. Irrigation Science, 18(1), 1-10.
BDA Group (2007). Cost Benefit Analyses of Research Funded by the CRDC, Final Report to Cotton Research and Development Corporation. B. Group, Manuka, ACT, Australia. Dalton, P., Raine, S. R., & Broadfoot, K. (2001). Best management practices for maximising
whole farm irrigation efficiency in the Australian cotton industry. USQ, Toowoomba. Gillies, M. H., & Smith, R. J. (2005). Infiltration parameters from surface irrigation advance
and run-off data. Irrigation Science, 24(1), 25-35.
McClymont, D. J. (2007). Development of a Decision Support System for Furrow and Border Irrigation. Unpublished PhD thesis, University of Southern Queensland, Toowoomba.
McClymont, D. J., & Smith, R. J. (1996). Infiltration parameters from optimization on furrow irrigation advance data. Irrigation Science, 17(1), 15-22.
Robertson, D., Wood, M., & Wang, Q. J. (2004). Estimating hydraulic parameters for a surface irrigation model from field conditions. Australian Journal of Experimental Agriculture, 44(2), 173-179.
Scaloppi, E. J., Merkley, G. P., & Willardson, L. S. (1995). Intake parameters from advance and wetting phases of surface irrigation. Journal of Irrigation and Drainage Engineering, 121(1), 57-70.
Smith, R. J., Gillies, M. H., Shanahan, M., Campbell, B., & Williamson, B. (2009).
Evaluating the Performance of Bay Irrigation in the GMID. Paper presented at the Irrigation and Drainage Conference 2009, Irrigation Australia Ltd, Swan Hill, Vic. Smith, R. J., Raine, S. R., & Minkevich, J. (2005). Irrigation application efficiency and deep
drainage potential under surface irrigated cotton. Agricultural Water Management, 71(2), 117-130.
Walker, W. R. (2003). Surface irrigation simulation, evaluation and design, User Guide and Technical Documentation (pp. 145). Logan, Utah: Utah State University.
Walker, W. R. (2005). Multilevel calibration of furrow infiltration and roughness. Journal of Irrigation and Drainage Engineering, 131(2), 129-136.