FOR THE SIMULTANEOUS ESTIMATION OF SALBUTAMOL
SULPHATE, GUAIFENESIN AND AMBROXOL
HYDROCHLORIDE IN ORAL LIQUID DOSAGE FORM
Dissertation Submitted to
THE TAMILNADU Dr. M.G.R. MEDICAL UNIVERSITY
Chennai-32
In partial fulfillment for the award of the degree of
MASTER OF PHARMACY
(PHARMACEUTICAL ANALYSIS)
Submitted by
Reg. No: 261530403
Under the guidance of
Dr. T. Prabha, M.Pharm., Ph.D., PDF.,
Head of the Department
Department of Pharmaceutical Analysis
SEPTEMBER-2017
Head of the Department,
Department of Pharmaceutical Analysis,
Nandha College of Pharmacy and Resaerch Institute,
Erode-638052,
Tamilnadu.
CERTIFICATE
This is to certify that the work embodied in this dissertation entitled
“DEVELOPMENT AND VALIDATION OF RP-HPLC METHOD FOR THE
SIMULTANEOUS ESTIMATION OF SALBUTAMOL SULPHATE,
GUAIFENESIN AND AMBROXOL HYDROCHLORIDE IN ORAL LIQUID
DOSAGE FORM”, submitted in partial fulfillment to the requirement for the award
of degree of MASTER OF PHARMACY in the Department of Pharmaceutical
Analysis, The Tamilnadu Dr. M.G.R. Medical University, Chennai, at
Nandha College of Pharmacy, Erode, is a bonafied work carried out by
Reg. No.261530403 under my guidance and supervision during the academic year
2016-2017.
Dr.T.Prabha, M.Pharm., Ph.D., PDF.,
Place : Erode
This is to certify that the work embodied in this dissertation entitled
“DEVELOPMENT AND VALIDATION OF RP-HPLC METHOD FOR THE
SIMULTANEOUS ESTIMATION OF SALBUTAMOL SULPHATE,
GUAIFENESIN AND AMBROXOL HYDROCHLORIDE IN ORAL LIQUID
DOSAGE FORM”, submitted to The Tamilnadu Dr. M.G.R. Medical University,
Chennai, was carried out by Reg. No. 261530403 as a Partial fulfillment for the award
of degree of MASTER OF PHARMACY in the Department of Pharmaceutical
Analysis under direct supervision of Dr. T. Prabha, M.Pharm., Ph.D., PDF., Head of
the Department, Department of Pharmaceutical Analysis, Nandha College of
Pharmacy, Erode-638052, during the academic year 2016-2017. The work is original
and has not been submitted in part or full for any degree or diploma of this or other
university.
DECLARATION
The research work embodied in this dissertation work entitled
“DEVELOPMENT AND VALIDATION OF RP-HPLC METHOD FOR THE
SIMULTANEOUS ESTIMATION OF SALBUTAMOL SULPHATE,
GUAIFENESIN AND AMBROXOL HYDROCHLORIDE IN ORAL LIQUID
DOSAGE FORM” was carried out by me in the Department of Pharmaceutical
Analysis, Nandha College of Pharmacy, Erode, under the direct supervision of
Dr. T. Prabha, M.Pharm., Ph.D., PDF., Professor, Department of Pharmaceutical
Analysis, Nandha College of Pharmacy, Erode – 638052.
This dissertation submitted to The Tamilnadu Dr. M.G.R Medical
University, Chennai, as a partial fulfillment for the award of Degree of Master of
Pharmacy in Pharmaceutical Analysis during the academic year 2016 – 2017.
The work is original and has not been submitted in part or full for the award
of any other Degree or Diploma of this or any other University.
Place: Erode
ACKNOWLEDGEMENT
I pay reverence to the supreme ubiquitous, omniscient and omnipotent. The
almighty God for his benevolence and blessing bestowed upon me.
I would like to express my deepest gratitude and heartfelt thanks to all those
helped me in the completion of my project work without which this work would not
have reached its destination.
It is with fathomless gratitude that expresses my benevolent thanks to my
esteemed teacher and guide Dr. T. Prabha, M.Pharm., Ph.D., PDF., HOD &
Professor, Department of Pharmaceutical Analysis, Nandha College of Pharmacy and
Research Institute, Erode. He has been painstakingly congruous with his guidance and
criticism throughout the preparation of this dissertation and my postgraduate studies. I
am indeed beholden and indebted to his valuable guidance in completion of this study.
His profound knowledge of the subject has enabled me to make avail of valuable tips
and suggestions in the preparation of this dissertation. I feel privileged fortuitous
having been his studies in my pursuit for knowledge. His disciplined guidance and
perfection throughout the work offered me interest and courage to sustain the efforts
to complete my project work.
I express my heartful thanks to our beloved principal, Dr. T. Sivakumar,
M. Pharm., Ph.D., Nandha College of Pharmacy & Research Institute, Erode for his
indispensable support which enable me to complete this task vast success.
I express my loyal thanks to Mr. V. Shanmugam, Chairman, and
Mr. S. Nandhakumar Pradeep and S. Thirumoorthy Secretary, Sri Nandha
Educational Institute, Erode providing all the facilities to make this work success.
I am very much indebted to Bioplus life Sciences, Pvt, Ltd, and my industrial
guide Mr. S. Kumaravel, Asst. General Manager, and Mr. S. Vasanthan, Manager,
for providing an opportunity to undertake this dissertation as it helped me to gain a lot
of information in this project.
I am also thankful to Dr. M. Jagadeeshwaran, M.Pharm., Ph.D., Professor
and Mrs. A. Caroline Grace M.Pharm., Assistant Professor, Department of
providing timely assistance throughout the entire work.
I would like to express my heartfelt gratitude to my parents who spent their
life in helping me reach this position. They are and will be my strongest pillar of
strength always. Needless to say without their help this dissertation would not have
seen the light of the day.
Place: Erode
Date: REG.NO. 261530403
ICH - International Conference on Harmonization
IP - Indian Pharmacopoeia
USP - United States Pharmacopoeia
BP - British Pharmacopoeia
- Lambda
g/mL - Microgram Per Millilitre mg/mL - Milligram Per Millilitre
mL - Millilitre
mM - Milli Mole
nm - Nanometer
pH - Negative Logarithm of Hydrogen Ion
% - Percentage
% RSD - Percentage Relative Standard Deviation
RP-HPLC - Reverse Phase -High Performance Liquid Chromatography
RT - Retention Time
S.D - Standard Deviation
UV-VIS - Ultraviolet - Visible
IR - Infra Red
NMR - Nuclear Magnetic Resonance
AUC - Area Under Curve C - Degree Celsius
L - Microlitre
- Micron
v/v/v - Volume/Volume/Volume
SIAM - Stability indicating assay method
SAB - Salbutamol
GUA - Guaifenesin
AMB - Ambroxol
NaH2PO4 - Sodium dihydrogen Orthophosphate
CHAPTER
NO.
TITLE PAGE
NO.
1. INTRODUCTION 1
2. DRUG PROFILE 31
3. LITERATURE REVIEW 37
4. AIM AND PLAN OF WORK 46
5. MATERIALS AND INSTRUMENTS 47
6. RESULTS AND ANALYSIS 48
7. CHROMATOGRAMS 67
8. RESULTS AND DISCUSSION 94
9. SUMMARY AND CONCLUSION 98
Nandha college of Pharmacy & Research Institute
1
1. INTRODUCTION
Pharmaceutical Analysis may be defined as the application of analytical
procedures used to determine the purity, safety and quality of drugs and chemicals. The
pharmaceutical analysis comprises the procedures necessary to determine the “identity, strength, quality and purity” of such compounds. It also includes the analysis of raw material
and intermediates during manufacturing process of drugs.
1.1. TYPES 1
Pharmaceutical analysis includes both qualitative and quantitative of drugs and
pharmaceutical substances starts from bulk drugs to the finished products.
1.1.1. Qualitative analysis
▪ Qualitative inorganic analysis seeks to establish the presence of a given element or
inorganic compound in a sample.
▪ Qualitative organic analysis seeks to establish the presence of a given functional
group or organic compound in a samples
1.1.2 Quantitative analysis2
Quantitative analysis seeks to establish the amount of a given element or compound in
a sample.
Importance of analytical chemistry is to gain information about the qualitative and
quantitative composition of substance and chemical species, that is, to find out what a
substance is composed of and exactly how much it is present
For the past two decades, the pharmaceutical analyst has been a spur in development
of analytical techniques for various medicinal principles both in pure and combined state and
also in finished products. Some of the methods shine in modern technological and electronics
and microprocessor-based developments have really shown faster and best results with more
accuracy than the conventional methods.
There are various methods used for quantitative analysis of mixtures. One of them is
spectrophotometry, which utilizes the measurement of intensity of electromagnetic radiation
emitted or absorbed by the analyte. Another technique which has gained large popularity
during last decade is high performance liquid chromatography. The technique is very much
useful to pharmaceutical analyst in analyzing complex formulation containing number of
ingredients as it permits simultaneous separation and determination of components of
Nandha college of Pharmacy & Research Institute
2
1.2. METHODS OF ANALYSIS
1.2.1. Generally analytical methods are classified as follows:
1. Chemical methods
2. Instrumental methods
a) Chemical methods
1. Volumetric method
2. Gravimetric method
b) Instrumental methods:
The analytical chemist, to save time, to avoid chemical separation or to obtain
increased accuracy may use instrumental methods. This can be classified into:
1. Spectrophotometric methods – UV, IR, NMR etc.
2. Fluorimetric methods
3. Polarimetric method
4. Flame photometric method
5. Turbidimetric method
6. Chromatographic method
7. Refractrometric method
8. Thermal method
9. Electro chemical method
1.3. INTRODUCTION TO CHROMATOGRAPHY3
The word is obtained from the Greek word chroma + graphia, literally "colour
writing". Chromatography is a technique for analyzing mixtures of gases, liquids or solutes
by exploiting differences in their distribution between a stationary and a mobile phase.
Chromatography is a fundamental technique in the detection, identification and quantization
of chemical species. It comes in two basic formats, planar and column chromatography.
1.3.1. Classification of chromatography based on stationary phase
1.3.1.1. Planar Chromatography
The origins of planar chromatography can be traced back to the practice amongst
dyers of testing pigments by placing a drop on paper and observing the colours as the drop
spreads. The scientific use of paper chromatography can be traced to the mid-19th century.
The important separation of amino acids and peptides by paper chromatography was
developed in 1994 by Consden, Gordon, and Martin. Thin layer chromatography (TLC) was
developed in 1938 by Izmailov and Shraiber based on Mikhail Tswett’s earlier description of
Nandha college of Pharmacy & Research Institute
3
1.3.1.2. Column Chromatography
Russian botanist Mikhail Tswett’s invented column chromatography in 1906 as a
means of studying plant pigments, but it soon became clear that the technique provided a
means for separating many complex homogeneous mixtures into their individual components.
Today instrumental chromatographic techniques are essential tools in areas such as
[image:11.595.98.500.215.719.2]chemistry, biology, medicine, forensic science, manufacturing and the environment.
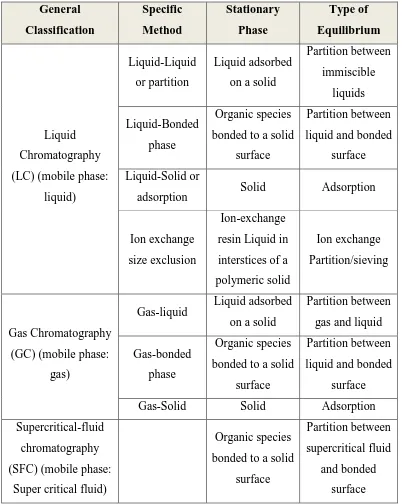
Table 1 Classification of column chromatographic methods 2
General Classification Specific Method Stationary Phase Type of Equilibrium Liquid Chromatography
(LC) (mobile phase:
liquid)
Liquid-Liquid
or partition
Liquid adsorbed
on a solid
Partition between immiscible liquids Liquid-Bonded phase Organic species
bonded to a solid
surface
Partition between
liquid and bonded
surface
Liquid-Solid or
adsorption Solid Adsorption
Ion exchange
size exclusion
Ion-exchange
resin Liquid in
interstices of a
polymeric solid
Ion exchange
Partition/sieving
Gas Chromatography
(GC) (mobile phase:
gas)
Gas-liquid Liquid adsorbed on a solid
Partition between
gas and liquid
Gas-bonded
phase
Organic species
bonded to a solid
surface
Partition between
liquid and bonded
surface
Gas-Solid Solid Adsorption
Supercritical-fluid
chromatography
(SFC) (mobile phase:
Super critical fluid)
Organic species
bonded to a solid
surface
Partition between
supercritical fluid
and bonded
Nandha college of Pharmacy & Research Institute
4
1.3.2. Classification of chromatography based on mobile Phase
Chromatographic methods are also classified depending upon the medium of the
mobile phase. There are two methods under this category:
1.3.2.1. Gas chromatography
Gas chromatography (GC) is based on a partition equilibrium of analyte between a
solid stationary phase (often a liquid silicone-based material) and a mobile gas (most often
Helium). The stationary phase is adhered to the inside of a small-diameter glass tube (a
capillary column) or a solid matrix inside a larger metal tube (a packed column). It is widely
used in analytical chemistry; though the high temperatures used in GC make it unsuitable for
high molecular weight biopolymers or proteins (heat will denature them), frequently
encountered in biochemistry, it is well suited for use in the petrochemical, environmental
monitoring and remediation, and industrial chemical fields. It is also used extensively in
chemistry research.
1.3.2.2. Liquid chromatography
Liquid chromatography (LC) is a separation technique in which the mobile phase is a
liquid. Liquid chromatography can be carried out either in a column or a plane. Present day
liquid chromatography that generally utilizes very small packing particles and a relatively
high pressure is referred to as high performance liquid chromatography (HPLC).
1.3.2.3. Supercritical Fluid Chromatography (SFC)
SFC is aseparation technique in which the mobile phase is a fluid above and relatively
close to its critical temperature and pressure. SFC is a form of normal phase chromatography
that is used for the analysis and purification of low to moderate molecular weight, thermally
labile molecules. It can also be used for the separation of chiral compounds. Principles are
similar to those of high performance liquid chromatography (HPLC), however SFC typically
utilizes carbon dioxide as the mobile phase; therefore the entire chromatographic flow path
must be pressurized.
1.3.3. Classification of chromatography based on the mechanism of separation4
1.3.3.1. Adsorption chromatography
It involves the interaction between the sample molecule and the stationary phase. It is
a competitive situation in which the molecules of the mobile phase and the solute are in
competition for discrete adsorption sites on the surface of the column. Interaction between a
solute molecule and the adsorbent surface is optimum when solute functional groups exactly
Nandha college of Pharmacy & Research Institute
5
The separation is achieved by changes in the composition of mobile phase. It is used for
analysis of non-ionizing, water insoluble compounds.
1.3.3.2. Bonded phase chromatography
It is widely used column packing for liquid-liquid partition chromatography with
chemically bonded, organic stationary phases. Partition occurs between the bonded phase and
a mobile liquid phase. Bonded phase supports are made from silica by the covalent
attachment of an organic hydro carbon moiety to the surface. A stationary phase chemically
bonded to a support that is used for the separation. It is the most commonly used LC mode.
The most popular support used is micro particulate silica gel. An organosilane, such as
octadecyl (for reversed-phase chromatography) is the most accepted type of bonded phase.
1.3.3.3.Normal phase chromatography
Also known as Normal phase HPLC (NP-HPLC), in this method separation of analyte
is based on polarity, it was the first kind of HPLC that chemists developed. NP-HPLC uses a
polar stationary phase and a non-polar mobile phase and works effectively for relatively polar
analyte. The polar analyte associates with and is retained by the polar stationary phase.
Adsorption strength increase with increased analyte polarity and the interaction between the
polar analyte and the polar stationary phase (relative to the mobile phase) increases the
elution time.
1.3.3.4. Size exclusion chromatography (SEC)
It is a chromatographic method in which particles are separated based on their size or
in more technical terms their hydrodynamic volume. It is usually applied to large molecules
or macromolecular complexes such as proteins and industrial polymers. When an aqueous
solution is used to transport the sample through the column the technique is known as gel
filtration chromatography. The name gel permeation chromatography is used when an
organic solvent is used as a mobile phase. The main application of gel filtration
chromatography is the fractionation of proteins and other water-soluble polymers, while gel
permeation chromatography is used to analyze the molecular weight distribution of
organic-soluble polymers. Polymer chemists typically use either silica or cross linked polystyrene
medium under a higher pressure. This media are known as the stationary phase.
1.3.3.5. Ion-exchange chromatography
It is a process that allows the separation of ions and polar molecules based on the
charge properties of the molecules. It can be used for almost any kind of charged molecule
including large proteins, small nucleotides and amino acids. It is often used in protein
Nandha college of Pharmacy & Research Institute
6
molecules based on coulomb (ionic) interactions. The stationary phase surface displays ionic
functional groups (R-X) that interact with analyte ions of opposite charge. This type of
chromatography is further subdivided into cation exchange chromatography and anion
exchange chromatography. The ionic compound consisting of the cationic species M+ and
the anionic species B- can be retained by the stationary phase.
1.3.3.6.Bio-affinity chromatography
This chromatographic process relies on the property of biologically active substances
to form stable, specific and reversible complexes. The formation of these complexes involves
the participation of common molecular forces such as the Van der Waals interaction,
electrostatic interaction, dipole-dipole interaction, hydrophobic interaction and the hydrogen
bond. An efficient bio specific bond is formed by a simultaneous and concerted action of
several of these forces.
1.3.3.7. Hydrophobic Interaction Chromatography (HIC)
Hydrophobic Interaction Chromatography is a separation technique uses the
properties of hydrophobic to separate proteins from one another. In this type of
chromatography, hydrophobic groups such as phenyl, octyl or butyl are attached to the
stationary column. Proteins that pass through the column that have hydrophobic amino acid
side chains on their surfaces are able to interact with and bind to the hydrophobic groups on
the column. HIC separations are often designed using the opposite conditions of those used in
ion exchange chromatography. In this separation, a buffer with a high ionic strength, usually
ammonium sulfate is initially applied to the column. The salt in the buffer reduces the
solvation of sample solutes thus as solvation decreases, hydrophobic regions that become
exposed are adsorbed by the medium. The stationary phase is designed to form hydrophobic
interactions with other molecules.
Selection of suitable method for estimation of drug in dosage forms is an impending
challenge for an analytical chemist. The method so selected should provide analytical data as
accurate as required, technically sound, defensible with low level of uncertainty and above all
amenable to routine laboratory use and capable of giving reproducible results. HPLC has
become the back bone of the biotechnology and pharmaceutical industries where it is used to
identify, characterize and purify molecules at all stages of a process, from R&D to quality
Nandha college of Pharmacy & Research Institute
7
1.3.4. Why HPLC having high importance compared with other techniques?
Different types of chromatographic techniques are available to analyze the samples,
but one of the technique very familiar, is High Performance Liquid Chromatography. HPLC
technique is not only useful for separation, but also useful for qualifying (identifying) and
quantifying the small and neutral molecules also. A few microgram of sample (at the
extreme, even less than a nanogram) is enough to ensure the required accuracy. Secondly,
HPLC separations are usually relatively fast, precise, accurate and an analysis can be
completed in short span possibly in a few seconds. Another advantage of these techniques is
relative simplicity and ease of operation compared with other instrumental techniques. If the
established procedure is well controlled and the apparatus is maintained under calibrated
condition, good accuracy and precision can be achieved.
1.4. ANALYTICAL METHODS DEVELOPMENT
The number of drugs introduced into the market is increasing every year. These
drugs may be either new entities or partial structural modification of the existing one. Very
often there is a time lag from the date of introduction of a drug into the market to the date of
its inclusion in pharmacopoeias. This happens because of the possible uncertainties in the
continuous and wider usage of these drugs, reports of new toxicities (resulting in their
withdrawal from the market), development of patient resistance and introduction of better
drugs by competitors. Under these conditions, standards and analytical procedures for these
drugs may not be available in the pharmacopoeias. It becomes necessary, therefore to develop
newer analytical methods for such drugs.
Pharmaceutical products formulated with more than one drug, typically referred to as
combination products, are intended to meet previously unmet patients need by combining the
therapeutic effects of two or more drugs in one product. These combination products can
present daunting challenges to the analytical chemist responsible for the development and
validation of analytical methods.
1.4.1 Basic criteria for new method development of drug analysis:
➢ The drug or drug combination may not be official in any pharmacopoeias,
➢ A proper analytical procedure for the drug may not be available in the literature
due to patent regulations,
➢ Analytical methods may not be available for the drug in the form of a formulation
due to the interference caused by the formulation excipients,
➢ Analytical methods for the quantitation of the drug in biological fluids may not be
Nandha college of Pharmacy & Research Institute
8
➢ Analytical methods for a drug in combination with other drugs may not beavailable,
➢ The existing analytical procedures may require expensive reagents and solvents. It
may also involve cumbersome extraction and separation procedures and these may
not be reliable.
1.5. HPLC METHODS OF ANALYSIS FOR DRUGS IN COMBINATION
Most of the drugs in multi-component dosage forms can be analyzed by HPLC
method because of the several advantages like rapidity, specificity, accuracy, precision and
ease of automation in this method. HPLC method eliminates tedious extraction and isolation
procedures. Some of the advantages are:
➢ Speed (analysis can be accomplished in 20 minutes or less),
➢ Greater sensitivity (various detectors can be employed),
➢ Improved resolution (wide variety of stationary phases),
➢ Reusable columns (expensive columns but can be used for many analysis),
➢ Ideal for the substances of low volatility,
➢ Easy sample recovery, handling and maintenance,
➢ Instrumentation tends itself to automation and quantitation (less time and less
labor),
➢ Precise and reproducible,
➢ Calculations are done by integrator itself,
Nandha college of Pharmacy & Research Institute
9
1.6. HPLC METHOD DEVELOPMENT 5
HPLC method development seems complex. The process is influenced by the nature of
the analytes and generally involves the following steps:
Information on sample, define separation goals
Need for special HPLC procedure, sample pretreatment etc.,
ple pre-treatment
Choose detector and detector settings
treatment
Choose LC method – preliminary run; estimate best separation conditions
treatment
Optimize separation conditions
treatment
Check for problem or require for special procedure
treatment
Require purified material Quantitative calibration and Qualitative
method
Validated method for release to routine
Nandha college of Pharmacy & Research Institute
10
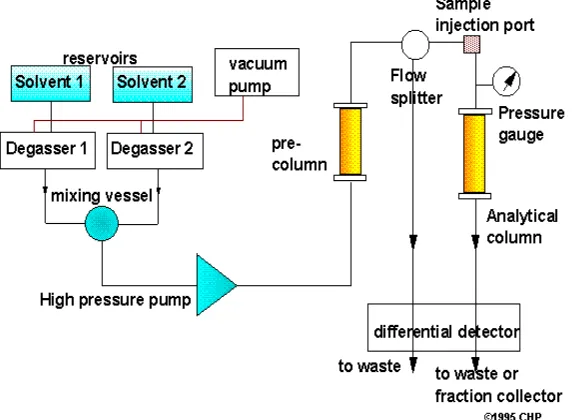
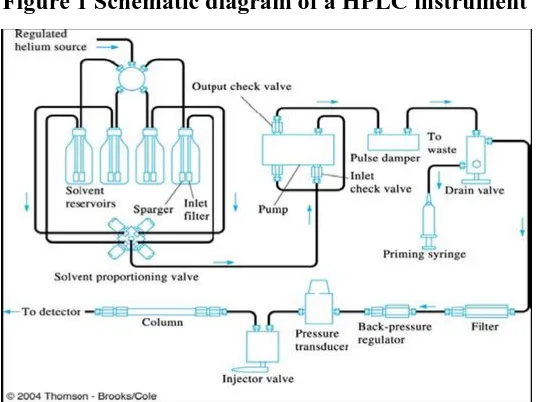
1.7. INSTRUMENTATION OF HPLC2,3,4
The general instrumentation for HPLC incorporates the following components,
• Solvent reservoir.
• Pump.
• Sampling valves or loops
• Guard column
• Pressure gauge
• Analytical column
• Detector
[image:18.595.157.444.376.586.2]• Data acquisition system
Nandha college of Pharmacy & Research Institute
11
Figure 1 Schematic diagram of a HPLC instrument
1.8. TYPES OF HPLC BASED ON MODES OF SEPARATION
❖ NP-HPLC
❖ RP-HPLC
In the normal phase mode, the stationary phase is a polar substance such as
polyethylene glycol or the untreated silica surface itself, and the mobile phase is non polar
(e.g. hexane) under these circumstances polar compounds retarded preferentially and non
polar substances elute more quickly.
In reversed phase mode, the stationary phase is non polar (e.g. ODS) and the mobile
phase is polar, usually a mixture of water, methanol and/or acetonitrile. Non polar
compounds are retained more strongly, while polar solutes elute first. Reversed phase
Nandha college of Pharmacy & Research Institute
12
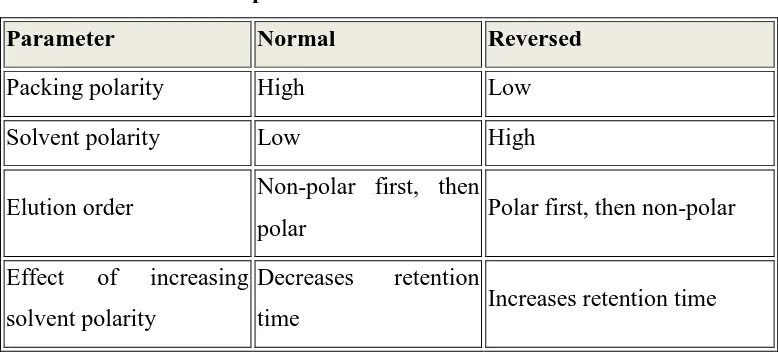
Table 2 Comparison of NP – HPLC and RP – HPLC
Parameter Normal Reversed
Packing polarity High Low
Solvent polarity Low High
Elution order Non-polar first, then
polar Polar first, then non-polar
Effect of increasing
solvent polarity
Decreases retention
time Increases retention time
1.9. INTRODUCTION TO RP – HPLC6
Separation by RP – HPLC is similar to the extraction of different compounds from
water into an organic solvent, where more hydrophobic (non - polar) compounds extract into
the non - polar phase. The column (typically C8and C18 bonded phase) is less polar than the
water - organic phase. Sample molecules partition between the polar mobile phase and non –
polar C8 and C18 stationary phase and more hydrophobic (non - polar) compounds are
retained more strongly. Polar compounds are less strongly held and elute from the column
first and vice versa. In RP – HPLC the retention of a compound is determined by its polarity,
experimental conditions, mobile phase, column and temperature. RP – HPLC columns are
efficient, stable and reproducible.
1.9.1.Mobile phase effects
Retention is preferable adjusted by changing mobile phase composition or solvent
strength. In this the retention is less for stronger, less polar mobile phase. Solvent strength
depends on the choice of organic solvent and its concentration in the mobile phase.
1.9.2. Mobile phase strength
1. In RP-HPLC solvent strength varies as
2. Water < Methanol < Acetonitrile < Ethanol < Tetrahydrofuran < Propanol < Methylene
chloride.
3. Acetonitrile is best initial choice of solvent and Acetonitrile and Water mixture used for
Nandha college of Pharmacy & Research Institute
13
1.10. VARIOUS METHODS OF QUANTITATIVE ANALYSIS IN HPLC
The sample or solute is analyzed quantitatively in HPLC by either peak height or
peak area measurements. Peak areas are proportional to the amount of constant rate. Peak
heights are proportional to the amount of material only when peak width are constant and are
strongly affected by the sample injection techniques. Once the peak height or the peak areas
are measured, there are five principle evaluation methods for quantifying the solute3,7.
1.10.1. Calibration by Standards
Calibration curves for each component are prepared from pure standards, using
identical injection volumes of operating conditions for standards and samples. The
concentration of solute is read from its curve if the curve is linear.
X = K x Area.
Where, X = Concentration of solute.
K = Proportionality constant (slope of the curve).
In this evaluation method only the area of the peaks of interest is measured. Relative
response factors must be considered when converting areas to volume and when the response
of a given detector differs for each molecular type of compounds.
1.10.2. Internal Standard Method
In this technique a known quantity of the internal standard is chromatographed and
area versus concentration is ascertained. Then a quantity of the internal standard is added to
the raw sample prior to any sample pretreatment or separation operations.
The peak area of the standard in the sample run is compared with the peak area when
the standard is run separately. This ratio serves as a correction factor for variation in sample
size for losses in any preliminary pretreatment operations or for incomplete elution of the
sample. The material selected for the internal standard must be completely resolved from
adjacent sample components, must not interfere with the sample components and must never
Nandha college of Pharmacy & Research Institute
14
1.10.3. Area Normalization
The technique is often used for the sample having identical components. It is used to
evaluate the absolute purity of the sample. The procedure is to total up the areas under all
peaks and then calculate the percentage of the total area that is contributed by the compound
of interest. For this method the entire sample must be eluted, all components must be
separated and each peak must be completely resolved.
1.10.4. Standard Addition Method
If only few samples are to be chromatographed, it is possible to employ the method
of standard addition(s). The chromatogram of the unknown analyte is recorded, then a known
amount of analyte(s) is added and the chromatogram is repeated using same reagents,
instruments and same conditions. From the increase in the peak area (or) peak height, the
original concentration can be computed by interpolation.
The detector response must be a linear function of analyte concentration and yield no signal
at zero concentration of the analyte. Sufficient time must elapse between addition of the
standard and actual analysis to allow equilibrium of added standard with any matrix
interferon.
If an instrumental reading (area/height) ‘Rx’ is obtained, from a sample of unknown
‘x’ and a reading ‘Rt’ is obtained from the sample to which a known concentration ‘a’ of
analyte has been added, then ‘x’ can be calculated from.
A correction for dilution must be made if the amount of standard added changes the
total sample volume significantly. It is always advisable to check the result by adding at least
one other standard.
1.10.5. External Standard Method
It employs a separate injection of a fixed volume of sample and standard solution. The
peaks are integrated and concentration is calculated.
Nandha college of Pharmacy & Research Institute
15
The selection of suitable chromatographic (HPLC) system for a given mixtures of
solutes cannot be made with certainty and must be confirmed by experiment. If the chemical
nature of the sample components is known, then the phase system can be selected from the
literature references. If nothing is known about the chemical nature of sample, then the
sample solubility will give some indication as to which chromatographic method to employ.
The essential parts of high performance liquid chromatographic system are solvent reservoir,
pump, injection port, column, detector and recorders.
1.11. METHOD VALIDATION
Method validation can be defined as establishing documented evidence, which
provides a high degree of assurance that a specific activity will consistently produce a desired
result or product meeting its predetermined specifications and quality characteristics.
Method Validation, however, is generally a one-time process performed after the
method has been developed to demonstrate that the method is scientifically sound and that it
serves the intended analytical purpose.
1.11.1. Purpose of Validation
➢ Enable the scientists to communicate scientifically and effectively on technical
matter.
➢ Setting the standards of evaluation procedures for checking compliance and
taking remedial action.
➢ Economic: Reduction in cost associated with process sampling and testing.
➢ As quality of the product cannot always be assured by routine quality control
because of testing of statistically insignificant number of samples.
➢ Retrospective validation is useful for trend comparison of results compliance
to CGMP/CGLP.
➢ Closure interaction with Pharmacopoeial forum to address analytical
problems.
➢ International Pharmacopoeial harmonization particularly in respect of
Nandha college of Pharmacy & Research Institute
16
1.11.2. Guidelines for method validation 7,8,9
ICH Method Validation
USP Method Validation
Typical validation characteristics which should be considered and their definitions are
given below.
1.11.2.1. Accuracy
The closeness of agreement between the value, which are accepted either as a
conventional true value or an accepted reference value and the value found. Accuracy is
represented and determined by recovery studies.
1.11.2.2. Precision
The precision of an analytical procedure expresses the closeness of agreement
Nandha college of Pharmacy & Research Institute
17
sample under the prescribed conditions. A more comprehensive definition proposed by the
ICH divides precision into three types
1. Repeatability
2. Intermediate Precision
3. Reproducibility
1. Repeatability
It is the precision of a method under the same operating conditions over a short period
of time. One aspect of this is instrumental precision. A second aspect is sometimes termed
intra-assay precision and involves multiple measurements of the same sample by the same
analyst under the same conditions.
2.Intermediate precision
It is the agreement of complete measurements when the same method is applied many
times within the same laboratory. This can include full analysis on different days, instruments
or analysts, but would involve multiple preparations of samples and standards.
3.Reproducibility
It examines the precision between laboratories and is often determined in
collaborative studies or method transfer experiments. Precision often is expressed by the
standard deviation or relative standard deviation of the data set.
1.11.2.3. Range
The range of a method can be defined as the upper and lower concentrations for
which the analytical method has adequate accuracy, precision and linearity. The range of
concentrations examined will depend on the type of method and its use.
1.11.2.4. Specificity
Specificity is the ability to assess unequivocally the analyte in the presence of
components, which may be expected to be present. Assuring specificity is the first step in
developing and validating a good method. If specificity is not assured, method accuracy,
precision and linearity all are seriously compromised. Method specificity should be
reassessed continually during validation and subsequent use of the method.
1.11.2.5. Linearity
The linearity of an analytical procedure is its ability to obtain test results, which are
directly proportional to the concentration of analyte in the sample. Linearity can be assessed
by performing single measurements at several analyte concentrations. A linearity correlation
Nandha college of Pharmacy & Research Institute
18
assay methods. The range of an analytical procedure is the interval between the upper and
lower concentration of analyte in the sample.
1.11.2.6. Detection Limit
Several approaches for determining the detection limit are possible, depending on
whether the procedure is a non-instrumental or instrumental. Approaches other than those
listed below may be acceptable.
a) Based on Visual Evaluation
Visual evaluation may be used for non-instrumental methods but may also be used
with instrumental methods.
The detection limit is determined by the analysis of samples with known
concentrations of analyte and by establishing the minimum level at which the analyte can be
reliably detected.
b) Based on Signal-to-Noise
This approach can only be applied to analytical procedures which exhibit baseline
noise. Determination of the signal-to-noise ratio is performed by comparing measured signals
from samples with known low concentrations of analyte with those of blank samples and
establishing the minimum concentration at which the analyte can be reliably detected. A
signal-to-noise ratio between 3 or 2:1 is generally considered acceptable for estimating the
detection limit.
c) Based on the Standard Deviation of the Response and the Slope
The detection limit (LOD) may be expressed as
LOD = 3.3 / S
Where, = the standard deviation of the response.
S = the slope of the calibration curve (of the analyte).
d) Based on the Standard Deviation of the Blank
Measurement of the magnitude of analytical background response is performed by
analyzing an appropriate number of blank samples and calculating the standard deviation of
Nandha college of Pharmacy & Research Institute
19
e) Based on the Calibration Curve
A specific calibration curve should be studied using samples containing an analyte in
the range of DL. The residual standard deviation of a regression line or the standard deviation
of y-intercepts of regression lines may be used as the standard deviation.
1.11.2.7. Quantitation Limit
Several approaches for determining the quantitation limit are possible; depending on
either the procedure is a non-instrumental or instrumental. Approaches other than those listed
below may be acceptable.
a) Based on Visual Evaluation
Visual evaluation may be used for non-instrumental methods but may also be used with
instrumental methods.
The quantitation limit is generally determined by the analysis of samples with known
concentrations of analyte and by establishing the minimum level at which the analyte can be
quantified with acceptable accuracy and precision.
b) Based on Signal-to-Noise Approach
This approach can only be applied to analytical procedures that exhibit baseline noise.
Determination of the signal-to-noise ratio is performed by comparing measured signals from
samples with known low concentrations of analyte with those of blank samples and by
establishing the minimum concentration at which the analyte can be reliably quantified. A
typical signal-to-noise ratio is 10:1.
c) Based on the Standard Deviation of the Response and the Slope
Quantitation Limit (LOQ) may be expressed as
Nandha college of Pharmacy & Research Institute
20
Where, = the standard deviation of the response.
S = the slope of the calibration curve (of the analyte).
d) Based on Standard Deviation of the Blank
Measurement of the magnitude of analytical background response is performed by
analyzing an appropriate number of blank samples and calculating the standard deviation of
these responses.
e) Based on the Calibration Curve
A specific calibration curve should be studied using samples, containing an analyte in
the range of QL. The residual standard deviation of a regression line or the standard deviation
of y-intercepts of regression lines may be used as the standard deviation.
1.11.2.8. Ruggedness
Method ruggedness is defined as the reproducibility of results when the method is
performed under actual use conditions. This includes different analysts, laboratories,
columns, instruments, sources of reagents, chemicals, solvents and so on. Method ruggedness
may not be known when a method is first developed, but insight is obtained during
subsequent use of that method.
1.11.2.9. Robustness
The concept of robustness of an analytical procedure has been defined by the ICH as
“a measure of its capacity to remain unaffected by small, but deliberate variations in method parameters”. The most important aspect of robustness is to develop methods that allow for
Nandha college of Pharmacy & Research Institute
21
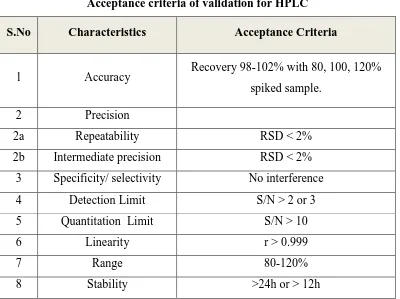
Table 3
Acceptance criteria of validation for HPLC
S.No Characteristics Acceptance Criteria
1 Accuracy Recovery 98-102% with 80, 100, 120%
spiked sample.
2 Precision
2a Repeatability RSD < 2%
2b Intermediate precision RSD < 2%
3 Specificity/ selectivity No interference
4 Detection Limit S/N > 2 or 3
5 Quantitation Limit S/N > 10
6 Linearity r > 0.999
7 Range 80-120%
8 Stability >24h or > 12h
1.12. SYSTEM SUITABILITY PARAMETERS9
System suitability testing is an integral part of many analytical procedures. The tests
are based on the concept that the equipment, electronics, analytical operations, and samples to
be analyzed constitute an integral system that can be evaluated as such. System suitability test
parameters to be established for a particular procedure depend on the type of procedure being
validated.
The parameters that are affected by the changes in chromatographic conditions are,
➢ Retention or Capacity factor (KA)
➢ Resolution (Rs)
➢ Selectivity ()
➢ Column efficiency (N) and
Nandha college of Pharmacy & Research Institute
22
I.RETENTION OR CAPACITY FACTOR (KA)
The retention of a drug with a given packing material and eluent can be expressed as
retention time or retention volume, but both of these are dependent on flow rate, column
length and column diameter. The retention is best described as a column capacity ratio (K),
which is independent of these factors. The column capacity ratio of a compound (A) is
defined as 0 0 0 0 t t t V V V
KA A A
Where,
VA = Elution volume of A
V0 = Elution volume of a non retained compound (void volume)
At constant flow rate, retention times (tA and to) can be used instead of retention volumes.
Retention data is sometimes expressed, relative to a known internal standard (B). The ratio of
retention times (tA/tB) can be used, but the ratio of adjusted retention times
o B o At
t
t
t
isbetter when data need to be transferred between different chromatographs.
The values of k’ of individual bands increase or decrease with changes in solvent
strength. In reversed phase HPLC, solvent strength increases with the increase in the volume
of organic phase in the water/organic mobile phase. Typically an increase in percentage of
Nandha college of Pharmacy & Research Institute
23
II.Resolution (Rs)
The resolution, Rs of two neighboring peaks is defined by the ratio of the distance
between the two peak maxima. It is the difference between the retention times of two peak
maxima. It is the difference between the retention times of two solutes divided by their
average peak width. For baseline separation, the ideal value of Rs is 2.0. It is calculated by
using the formula,
) (
5 .
0 1 2
1 2
W W
Rt Rt Rf
Where,
Rt1 and Rt2 are the retention times of components 1 and 2.
W1 and W2 are peak widths of components 1 and 2.
III.Selectivity ()
The selectivity (or separation factor) , is a measure of relative retention of two components in a mixture. The ideal value of selectivity is 2. It can be calculated by using the
Nandha college of Pharmacy & Research Institute
24
0 1 0 2 V V V V Where, V0 is the void volume of the column and V2 and V1 are the retention
volumes of the second and the first peaks respectively.
IV.Column efficiency
Efficiency N of a column is measured by the number of theoretical plates per meter. It
is a measure of band spreading of a peak. Smaller the band spread, higher is the number of
theoretical plates, indicating good column and system performance.
Columns with N ranging from 5,000 to 100,000 plates/meter are ideal for a good
system. Efficiency is calculated by using the formula,
2 2 16 W Rt N
Where, Rt is the retention time and W is the peak width.
V.Peak asymmetry factor (As)
Peak asymmetry factor As can be used as a criterion of column performance. The peak
half width b of a peak at 10 % of the peak height divided by the corresponding front half
width a gives the asymmetry factor.
Nandha college of Pharmacy & Research Institute
25
1.13. STATISTICAL PARAMETERS10
i) Regression equation
The linear relationship is characterized by at tendency of the points of the scattered
diagram to cluster along a straight line known as the regression line.
Y=a + bX
It is used to describe the dependence of one characteristic (Y) up on the other
characteristic (X), both X,Y represent values of two characters a,b are two constants it will
be evident that two regression lines can be computed for every set of data-one each to
describe the dependence of one character to another. b is known as regressive coefficients
which shows change expected in Y for unit change in X, it is dependence of Y & X; b is the
regressive coefficient of Y& X. The regressive coefficient of b is estimated,
b = the slope of the regression line and is calculated by this formula
x = an arbitrarily chosen value of the predictor variable for which the corresponding value of
the criterion variable is desired.
ii) Correlation coefficient
A measure of the strength of the relationship between two variables is provided by the
coefficient of correlation denoted by r, if the relationship between the two variables is of the
linear form. It is also called the coefficient of linear correlation.
iii) Pearson’s correlation
The correlation coefficient calculation for data values should be +1 or -1 where the
values of
Correlation coefficient is +1 – positive
Correlation coefficient is -1 – negative.
Where, X – value of one character
Nandha college of Pharmacy & Research Institute
26
iv) Standard Deviation
It is the square root of the average of the squared deviations of the observations. From
the arithmetic mean, it is used for measures of dispersion. It is denoted by
Standard Déviation =
1 ) ( 2 n x x
R.S.D (%) = 100
x S.D
Where = Sum of observations
x = Mean or arithmetic average (x / n)
x = Individual observed value
x – x = Deviation of a value from the mean
n = Number of observations
v) Standard error of mean (S.E)
The population of standard deviation is not given, but the size of s is large. So the
sample standard deviation is representing the population of standard deviation.
S.E. = n S.D
Where, S.D = Standard Deviation
n = No. of observations
1.14. STABILITY INDICATING METHOD11
A stability indicating method is a validated qualitative analytical procedure that can
detect the cha nges with time in the properties of drug substance and drug product under
defined storage conditions. A stability indicating assay method accurately measures the active
ingredient without interference from other peaks and is sensitive enough to detect and qualify
the degradation products/impurities. To develop a stability indicating method, stress testing in
the form of forced degradation should be carried out at an early stage so that impurities and
degradation products can be identified and characterized.
The stability-indicating assay is a method that is employed for the analysis of stability
samples in pharmaceutical industry. With the advent of International Conference on
Harmonization (ICH) guidelines, the requirement of establishment of Stability-Indicating
Assay Method (SIAM) has become more clearly mandated. The guidelines explicitly require
conduct of forced decomposition studies under a variety of conditions, like pH, light,
Nandha college of Pharmacy & Research Institute
27
Elaborate definitions of stability-indicating methodology are, however, provided
in the United States-Food and Drug Administration (US-FDA) stability guideline of 1987 [5]
and the draft guideline of 1998 [6].
Stability-indicating methods according to 1987 guideline were defined as the
‘quantitative analytical methods that are based on the characteristic structural, chemical or
biological properties of each active ingredient of a drug product and that will distinguish each
active ingredient from its degradation products so that the active ingredient content can be
accurately measured.’
This definition in the draft guideline of 1998 reads as: ‘validated quantitative
analytical methods that can detect the changes with time in the chemical, physical, or
microbiological properties of the drug substance and drug product, and that are specific so
that the contents of active ingredient, degradation products, and other components of interest
can be accurately measured without interference.’
According to FDA guidance document, a stability-indicating method is “a validated
quantitative analytical procedure that can detect the changes with time in the pertinent
properties of the drug substance and drug product. A stability indicating method accurately
measures the active ingredients, without interference from degradation products, process
impurities, excipients, or other potential impurities.”
HPLC has been very widely employed in stability studies due to its high-resolution capacity,
sensitivity and specificity. Non-volatile, thermally unstable or polar/ionic compounds can
also be analyzed by this technique. Therefore, most of the SIAMs have been established
using HPLC.
1.14.1. Steps in the Development of Validated SIAMS
The practical steps involved in the development of SIAMs are discussed below:
Step I : Critical study of the drug structure to assess the likely decomposition route(s)
Step II : Collection of information on physicochemical properties
Step III : Stress (forced decomposition) studies
Step IV : Preliminary separation studies on stressed samples
Step V : Final method development and optimization
Step VI: Identification and characterization of degradation products, and preparation of
standards
Step VII: Validation of SIAMs
ICH guideline Q1AR and the ICH’s Common Technical Document [181] suggest the
Nandha college of Pharmacy & Research Institute
28
1.14.2. Forced Degradation Studies
Forced degradation or stress testing is undertaken to demonstrate specificity when
developing stability-indicating methods. These studies also provide information about the
degradation pathways and degradation products that could form during storage. Forced
degradation studies may help facilitate pharmaceutical development as well in areas such as
formulation development, manufacturing, and packaging, in which knowledge of chemical
behavior can be used to improve a drug product.
Forced degradation studies (or stress testing) are discussed and differentiated from
accelerated testing, which is done during formal stability testing, in ICH Q1A (R2) [1]. The
guidance states,
“Stress testing of the drug substance can help identify the likely degradation products,
which can in turn help establish the degradation pathways and the intrinsic
stability-indicating power of the analytical procedures used. The nature of the stress testing will
depend on the individual drug substance and the type of drug product involved.”
As stated in ICH Q1A, forced degradation studies can be used as a predictive tool [3].
The initial purpose of these studies is to investigate stability-related properties of an API and
understand the degradation products and pathways of the compound. They are also used to
provide samples for the development of stability-indicating analytical methods for the API.
The information gleaned from a forced degradation investigation can also be utilized in
several other areas of development, including analytical development (methods
development), formulation development (formulation choice and storage conditions),
manufacturing/processing parameters (synthesis/salt selection of API and manufacture of
formulations), safety/toxicological concerns (possible genotoxic degradation products),
metabolism (identification of possible metabolites) and discovery (design of better or more
stable APIs).
1.14.3 Forced degradation studies are carried out for the following reasons:
1. Development and validation of stability-indicating methodology
2. Determination of degradation pathways of drug substances and drug products
3. Discernment of degradation products in formulations that are related to drug
substances versus those that are related to non–drug substances (e.g.,
excipients)
4. Structure elucidation of degradation products
Nandha college of Pharmacy & Research Institute
29
1.14.4. Degradation Studies of a Drug Substance
For degradation studies of a drug substance, FDA requests the following at the time of
registration:
• Stressing the drug substance in solution or suspension at acidic and alkaline pH and under oxidation conditions
• Stressing the solid bulk drug substance at temperature and temperature - humidity conditions in excess of accelerated conditions
• Stressing the drug substance photolytically in the solid state and/or in solution
There are a number of common stresses which are used to
▪ pH (acid/base)
Chemical processes are often catalyzed by the presence of acids and bases. The exposure of
materials to these can therefore accelerate degradation reactions.
▪ Temperature
In accordance to Arrhenius kinetics, increasing temperature increases the rate of any
degradation process. Temperature is often used in conjunction with other stresses to increase
reaction rates.
➢ Oxidation
➢ Concentration
Nandha college of Pharmacy & Research Institute
30
For the stress conditions to provide the best compromise between overstressing and
understressing the sample, the desired target for the extent of observed degradation is
approximately 5-20%. Overstressing the sample may lead to further degradation of the
primary degradants or it may generate irrelevant degradants that would never be seen in
formal stability studies. At the other extreme, understressing may fail to generate important
degradation products that may be generated in formal stability studies. The desired extent of
degradation can be achieved by varying one or more of the stress conditions, e.g., exposure
Nandha college of Pharmacy & Research Institute
31
2.
DRUG PROFILE
2.1 SALBUTAMOL SULFATE21
Molecular structure :
Chemical Name : (RS)- 4-[2-(tert- Butylamino)-1-hydroxyethyl)-2 (hydroxymethyl) Phenol
Molecular Formula : (C13H21NO3)2.H2SO4
Molecular weight : 576.7 g/mol
Therapeutic class : Selective beta2-adrenergic receptor agonist
Category : Bronchodilators, Sympathomimetic, Chronic obstructive,
Pulmonary disease
Metabolism : Liver
Onset of action : <15 min (inhaled), <30 min (pill)
Duration of action : 2-6 hrs
Excretion : Kidney
Description : A white or almost white, crystalline powder
Solubility : Soluble in ethanol, sparingly soluble in water, very soluble in chloroform
Melting point : 1470-1490C
Half life : 3.8-6 hours
Loss on drying : Not more than 0.5%
Assay : 99.99% w/w
Nandha college of Pharmacy & Research Institute
32
Mechanism of action13 : Salbutamol is a beta(2)-adrenergic agonist and thus it stimulateous Beta(2)-adrenergic receptors. Binding of albuterol to beta(2) receptors in the lungs results in relaxation of bronchial smooth muscles. It is believed that salbutamol increases cAMP. Production by activating adenylate cyclase, and the actions of salbutamol are mediated by cAMP. Increased intercellular cyclic AMP increases the activity of cAMP-dependent protein kinase A, which inhibits the phosphorylation of myosin and lowers intracellular calcium concentration .A lowered intercellular calcium concentration leads to a smooth muscle relaxation and bronchodilation.In addition to bronchodilation, salbutamol inhibits the release of broncho-constricting agents from mast cells, inhibits microvascular leakage, and enhances mucocilliary clearance.
Adverse effect14 : Palpitation, Tachycardia, Chest discomfort, Headache, Tremor, Anxiety
Contraindication : Contraindicated in personwith a history of,
1). Hypersentivity reaction
2). Urticaria
3). Angioedma
4). Tachyarrthymias
Marketed Formulation : 1).Tablet
2). Syrup
3). Inhaler
4). Nebulizer and
5). Intramuscularor Intravenous Injectable form
Brand name : 1).Accuneb
2). Proventil
Nandha college of Pharmacy & Research Institute
33
2.2 GUAIFENESIN21
Molecular structure :
Chemical name : 3-(2-methoxyphenoxy) propane-1,2-diol
Molecular formula : C10H14O4
Molecular weight : 198.2g/mol
Therapeutic category : 1). Expectorant
2). Muscle relaxing action
Description : White or almost white, crystalline powder
Solubility : Free soluble in ethanol, soluble chloroform, glycerol, water
Melting point : 78.5- 79°C
Half life : 1 hour
Absorption : Rapidly absorbed from GI tract
Metabolism : Rapidly hydrolysed (60% within 7 hours)
Excretion : Excreted in Urine
Loss on drying : Not more than 0.5%
Storage : Stored in tight containers at room temperature between 15°C and 30°C
Nandha college of Pharmacy & Research Institute
34
Adverse effect16 : 1).Dizziness
2). Headache
3). Nausea
4). Vomiting
5). Skin rash
6). Stomach pain
7). Urticaria (hives).
Contraindication : Contraindicated in patients hypersentivity to the drug
Marketed formulation : 1).Capsules
2). Tablets
3). Syrup
Brand name17 :1).Mucinex
2). Fenesin IR
3). Robitussin
2.3 AMBROXOL HYDROCHLORIDE21
Molecular structure :
. HCL
Chemical name : Trans-4-[(2-amino-3,5-
dibromobenzyl)amino]cyclohexanol Hydrochloride
Molecular formula : C13H19Br2ClN2O
Molecular weight : 414.566 g/mol
Nandha college of Pharmacy & Research Institute
35
Description : A white or yellowish crystalline powder
Solubility : Sparingly soluble in water , soluble in methanol
Practically Insoluble in methylene chloride
Melting point : 233-234.5°C
Half life : 7-12 hours
Loss on drying : Not more than 0.5%
Protein binding : Approximately 90%
Storage : Store protected from light, temperature not exceeding 30°C
Mechanism of action19 : Ambroxol is a mucolytic agent. Excessive nitric oxide (NO) is Associated with inflammatory and some other disturbances of Airway functions. NO enhances the activation of soluble Guanylate cyclase and cGMP accumulation. Ambroxol has been shown to inhibit the NO-dependent activation of soluble Guanylate cyclase.It is also possible that the inhibition of NO-dependent activation of soluble guanylate cyclase can suppress the excessive mucus secretion, therefore it lowers the phlegm viscosity and improves the mucocilliary transport of bronchial secretions.
Adverse effect20 : 1).Occasional gastrointestinal side effect
2). Allergic reaction
3). Heart Burn
4). Dry mouth
5). Dyspepsia
6). Nausea
7). Vomiting
Very rarely,
Nandha college of Pharmacy & Research Institute
36
Contraindication : Hypersentivity to the drug, Hereditary disorders of Carbohydrates tolerance (product contain lactose) Duodenal ulcer, convulsion. There is no absolute Contraindication but in patient with gastric ulceration relative caution should be observed.
Marketed formulation : 1). Tablet
2). Syrup
Brand name : 1). Acticol
2). Acolyt
3). Acocontin
Nandha college of Pharmacy & Research Institute
37
3. LITERATURE REVIEW
Literature review was carried out to enumerate the reported analytical methods for the
selected drugs individually or in combination with other drugs.
Neelima et al.,22 have developed the different analytical methods available for detection of
Guaifenesin alone and in combination from various pharmaceutical formulations. They are
many analytical techniques have been reported for simultaneous estimation of Guaifenesin and
its combined pharmaceutical dosage form but only fewer methods have been reported for
estimation of Guaifenesin alone. Chromatographic separation was performed on symmetry
(C18) inertsil ODS 3V (4.6mm×150mm,4.5μm) column, with mobile phase comparising of
mixture of phosphate buffer (pH 6.0,adjusted with NaOH) and acetonitrile in the ratio of
40:60%v/v, at t