Design and implementation of HTS technology for cellular base stations: an investigation into improving cellular communication
172
0
0
Full text
(2) ABSTRACT When placed between the antenna and receiver electronics of a cellular base transceiver station, a Cryogenic Receiver Front End (CRFE), consisting of a High Temperature Superconducting (HTS) filter and modern Low Noise Amplifier (LNA), can significantly improve the base stations’ coverage and capacity. Due to CRFEs being hurried to the telecommunications industry in a competitive market, the development of CRFEs and their performance have been classified. This left it to be pondered whether HTS filters could really have been beneficial or if they were always just of academic interest. It is the main objective of this thesis to investigate if and under what circumstances high temperature RFsuperconductivity can prove to be an important technological contribution to current and future wireless communications.. This dissertation presents the analysis of an existing CRFE developed by Cryoelectra GmbH and its performance characteristics measured in a field trial held in rural China. With the aid of a CDMA Uplink Model developed by the author, the data was analysed and several novel engineering improvements were made to create an advanced CRFE which was economical to deploy. The analysis of results from a field trial in Beijing city using the CDMA Uplink Model led to the exploration of alternative filter technologies which could achieve similar results to the HTS filter technology. This culminated in the development of dielectric resonators filters which could be used as an alternative and as a supplement to the HTS filters used in the CRFE. The design of two novel dielectric resonator duplexers and two advanced multioperator combiner antenna sharing solutions followed the successful implementation of a high performance dielectric resonator filter.. The performed investigation and development described in this thesis suggest that HTS filter technology for terrestrial wireless communications can be beneficial in current cellular networks, but due to its high cost is economical for use only under certain conditions. However, HTS filter technology may be of great importance in the design and implementation of spectrum friendly wireless communications systems in the future.. i.
(3) ACKNOWLEDGEMENTS I would like to begin by offering my sincerest thanks to my supervisor, Prof. Janina Mazierska, who presented me with a wonderful opportunity to do my PhD. Her contacts in research, guidance and support have been invaluable assets through the past three years.. I must also extend my deepest gratitude to Prof. Helmut Piel and Cryoelectra GmbH for taking a chance on a graduate student from the other side of the globe and looking after me for two and a half years. Additionally Prof. Piel’s knowledge, guidance and experience combined with financial and technical support from Cryoelectra GmbH allowed me to achieve far more that I ever thought would be possible at the beginning of my PhD project and for that I am forever in their debt. I would also like to thank all the Cyroelectra staff for the opportunity work with such an experienced team and bounce my ideas off very well regarded engineers and physicists.. James Cook University and Massey University financial support is also very much appreciated. Special mention must be made of both universities’ acceptance of the conjoint PhD arrangement which allowed me to maintain close contact with my supervisor and both universities.. Finally I must send a heart felt thanks all my family and friends whose support has made everything I have undertaken possible.. ii.
(4) CONTENTS ABSTRACT ................................................................................................................................................ I ACKNOWLEDGEMENTS ......................................................................................................................II CONTENTS ............................................................................................................................................. III FIGURES ................................................................................................................................................. VI TABLES ................................................................................................................................................... XI CHAPTER 1 INTRODUCTION...............................................................................................................1 CHAPTER 2 WIRELESS COMMUNICATION TECHNOLOGY ......................................................5 2.1. ESSENTIALS OF WIRELESS COMMUNICATION .............................................................................5. 2.1.1. The Mobile Environment ......................................................................................................6. 2.1.2. The Cellular Concept............................................................................................................7. 2.1.3. Multipath Signal Fading and Diversity Antennas.................................................................9. 2.1.4 2.2. Radio Frequency Spectrum, Demand and Capacity ...........................................................10 ND. 2 GENERATION CELLULAR SYSTEMS .....................................................................................11. 2.2.1. Global System for Mobile Communications (GSM)............................................................11. 2.2.2 2.3. Code Division Multiple Access (CDMA) ............................................................................13 RD. 3 GENERATION CELLULAR SYSTEMS .....................................................................................14. CHAPTER 3 FUNDAMENTALS OF FILTER TECHNOLOGY.......................................................16 3.1. FILTER BASICS .........................................................................................................................16. 3.2. CAVITY FILTERS.......................................................................................................................18. 3.3. DIELECTRIC RESONATOR FILTERS............................................................................................22. 3.3.1 3.4. Coupling, Tuning and Trimming.........................................................................................23 PLANAR FILTERS ......................................................................................................................25. 3.4.1. Packaging, Trimming and Tuning ......................................................................................27. 3.4.2. HTS Filter Designs .............................................................................................................27. 3.5. FINAL COMMENTS ON FILTER TECHNOLOGY ...........................................................................31. CHAPTER 4 FUNDAMENTALS OF RF SUPERCONDUCTIVITY.................................................33 4.1. THE SUPERCONDUCTING STATE AND THE LONDON TWO FLUID MODEL ..................................33. 4.2. OTHER SUPERCONDUCTIVITY LIMITING PHENOMENA ..............................................................35. 4.2.1. Ionisation of Cooper Pairs by radiation .............................................................................35. 4.2.2. Critical magnetic field ........................................................................................................36. 4.2.3. Critical Current Density in a Superconductor....................................................................36. 4.2.4. RF Surface Resistance of Superconductors ........................................................................37. CHAPTER 5 CRYOGENIC RECEIVER FRONT ENDS FOR WIRELESS BASE STATIONS ....41. iii.
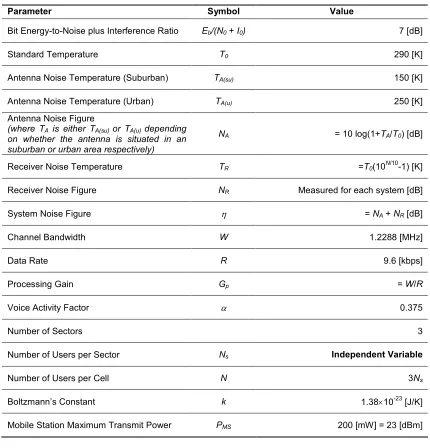
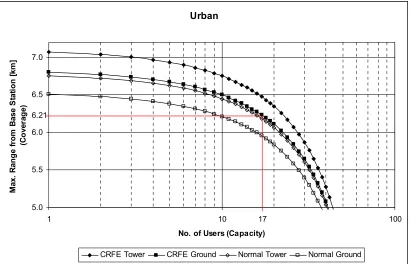
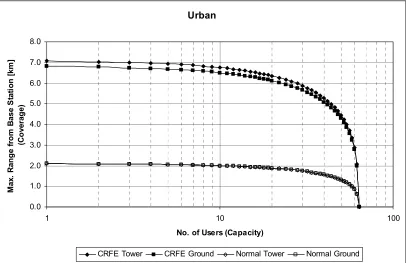
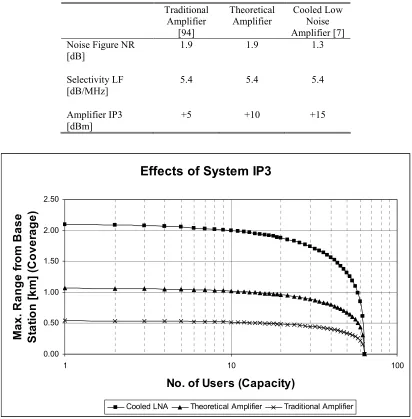
(5) 5.1. BASE STATION RECEIVERS AND CRFES ...................................................................................42. 5.2. CRFE DEMONSTRATOR 6 BY CRYOELECTRA ...........................................................................46. 5.2.1. D6 System Overview ...........................................................................................................46. 5.2.2. The HTS Filter ....................................................................................................................47. 5.2.3. A Linear Low Noise Amplifier for Wireless Comms. ..........................................................50. 5.2.4. Supporting Equipment ........................................................................................................54. 5.3. THE WUNONGCHANG FIELD TRIAL ..........................................................................................61. CHAPTER 6 CDMA UPLINK MODEL................................................................................................65 6.1. CDMA UPLINK MODEL DEVELOPMENT ..................................................................................65. 6.1.1. The Single Base Station CDMA Uplink Model ...................................................................66. 6.1.2. Multiple Base Station CDMA Uplink Model.......................................................................68. 6.1.3. Intermodulation Distortion .................................................................................................71. 6.1.4. Final CDMA Uplink Model ................................................................................................72. 6.2. PERFORMANCE SIMULATIONS OF BASE STATION FRONT ENDS ................................................74. 6.2.1. Performance Simulations in the Presence of Noise and Interference.................................76. 6.2.2. Performance Simulations of the Effect of System IP3.........................................................79. 6.2.3. Performance Simulations of Filter Selectivity ....................................................................81. 6.2.4. Performance Simulations in Different Environments .........................................................83. 6.3. INTERPRETATION OF THE SIMULATION RESULTS ......................................................................84. 6.4. ANALYSIS OF THE WUNONGCHANG FIELD TRIAL.....................................................................86. CHAPTER 7 DEVELOPMENT OF AN ADVANCED CRFE.............................................................89 7.1. CRYOGENIC RECEIVER FRONT ENDS ........................................................................................89. 7.2. CRYOGENIC COMPONENTS .......................................................................................................91. 7.2.1. HTS Filter ...........................................................................................................................92. 7.2.2. Low Noise Amplifier ...........................................................................................................95. 7.2.3. The Filter & LNA Mounting Structure................................................................................96. 7.2.4. Radiation Shielding and Heat Sources .............................................................................100. 7.3. SUPPORTING SYSTEMS ...........................................................................................................101. 7.3.1. Vacuum Systems................................................................................................................101. 7.3.2. Electronic CRFE Controller .............................................................................................103. 7.4 7.4.1 7.5. THE BEIJING FIELD TRIALS ....................................................................................................105 Analysis of the Beijing Field Trials ..................................................................................106 FINAL COMMENTS ON THE CRFE FIELD TESTS ......................................................................106. CHAPTER 8 NOVEL DIELECTRIC RESONATOR FILTER TECHNOLOGY FOR WIRELESS FRONT ENDS ........................................................................................................................................108 8.1. DIELECTRIC RESONATOR FILTERS FOR UMTS SYSTEMS .......................................................109. 8.2. NOVEL CONCEPT OF DIELECTRIC RESONATOR DUPLEXERS ...................................................118. 8.3. NOVEL CONCEPT OF ADVANCED MULTI-OPERATOR COMBINERS ..........................................122. iv.
(6) CHAPTER 9 DISCUSSIONS AND CONCLUSIONS ........................................................................127 9.1. RECOMMENDATIONS ..............................................................................................................129. 9.2. CONCLUSIONS ........................................................................................................................129. 9.3. THESIS RELATED PUBLICATIONS ............................................................................................130. REFERENCES .......................................................................................................................................131 APPENDIX A – WUNONGCHANG FIELD TRIAL .........................................................................135 APPENDIX B – BEIJING FIELD TRIAL...........................................................................................139 APPENDIX C – IR SHIELD AND HEAT SOURCES........................................................................147 GLOSSARY ............................................................................................................................................151. v.
(7) FIGURES FIGURE 2.1. SPECIFIC ABSORPTION OF RF SIGNALS DUE TO ATMOSPHERIC GASES VS. FREQUENCY [8] .......6 FIGURE 2.2. MAP COVERAGE USING HEXAGONAL AND CIRCULAR CELLS ....................................................8 FIGURE 2.3. A CELL SITE LIE AT THE EDGE OF SEVERAL CELLS [17] ............................................................8 FIGURE 2.4. CELL GEOGRAPHY SHOWING CELL SITE ANTENNA DIRECTION AND CHANNEL REUSE FOR AMPS..................................................................................................................................................8 FIGURE 2.5. DIAGRAM REPRESENTING A 25MHZ BANDWIDTH GSM CHANNEL SHOWING 124 CARRIER FREQUENCIES (FDMA) AND THE TDMA FRAME AND BURST PERIODS (TDMA)...............................12 FIGURE 2.6. DIAGRAM REPRESENTING A 1.25MHZ CDMA CHANNEL SHOWING MULTIPLEWALSH CODED CDMA SIGNAL..................................................................................................................................13 FIGURE 2.7. EUROPEAN UMTS FREQUENCY ALLOCATIONS .......................................................................15 FIGURE 3.1. IDEAL LC RESONATOR ............................................................................................................16 FIGURE 3.2. IDEAL FILTER WITH ELECTRICAL COUPLINGS ..........................................................................16 FIGURE 3.3. TRANSFER CHARACTERISTICS OF A LOSSLESS FILTER AND A FILTER WITH A FINITE Q0 OF 20000 ..........................................................................................................................................................17 FIGURE 3.4. A PILLBOX CAVITY ..................................................................................................................19 FIGURE 3.5. PILLBOX CAVITY FILTER .........................................................................................................19 FIGURE 3.6. PHOTOGRAPH OF PILLBOX CAVITY FILTERS AT MT. STUART, TOWNSVILLE............................19 FIGURE 3.7. SCHEMATIC OF AN RF CAVITY FOR PARTICLE ACCELERATORS SHOWING EM FIELD LINES [39] ..........................................................................................................................................................20 FIGURE 3.8. 9 CELL AS USED IN THE TESLA TEST FACILITY [39] ..............................................................20 FIGURE 3.9. COUPLED COAXIAL RESONATORS............................................................................................21 FIGURE 3.10. COUPLED COMBLINE RESONATORS .......................................................................................22 FIGURE 3.11. DIELECTRIC RESONATOR DEVELOPED IN CHAPTER 8 (LEFT: CAD, RIGHT: MANUFACTURED) ..........................................................................................................................................................22 FIGURE 3.12. DIAGRAM OF A DIELECTRIC PUCK AND CAVITY ....................................................................24 FIGURE 3.13. TOP: MAGNETIC MODE FIELDS FROM TOP VIEW OF COUPLED CAVITIES; BOTTOM: SIDE VIEW OF MAGNETIC FIELDS BETWEEN TWO COUPLED CAVITIES ................................................................24. FIGURE 3.14. QUADRUPLET STRUCTURE USING A NEGATIVE CROSS-COUPLING TO OBTAIN A QUASIELLIPTIC RESPONSE ...........................................................................................................................25 FIGURE 3.15. HALF WAVELENGTH MICROSTRIP RESONATOR .....................................................................25 FIGURE 3.16 - THEORETICALLY ACHIEVABLE SKIRT STEEPNESS FOR DIFFERENT FILTER ARCHITECTURE DEPENDING ON THE FILTER ORDER [53] .............................................................................................28. FIGURE 3.17 - LAYOUT OF COUPLING BETWEEN TWO J-SHAPED RESONATORS AND THE EQUIVALENT CIRCUIT [31]......................................................................................................................................29 FIGURE 3.18 - 32 POLE CHEBYSHEV FILTER [31] ........................................................................................29 FIGURE 3.19 - QUADRUPLET STRUCTURE USED TO PLACE 10 TRANSMISSION ZEROS (DOTTED LINES REPRESENT CROSS COUPLINGS) [30] ..................................................................................................30. FIGURE 3.20 - TOPOLOGY OF CLIP RESONATOR [32] ...................................................................................30. vi.
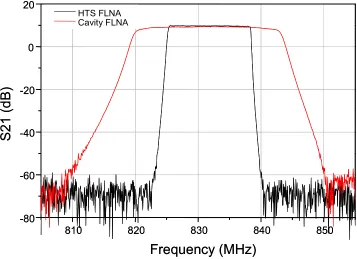
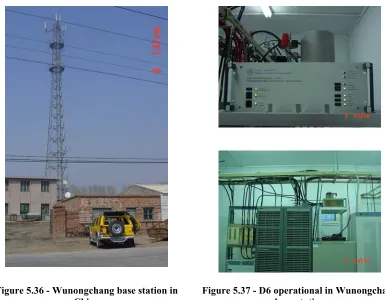
(8) FIGURE 3.21 - DUAL MODE RESONATOR WITH INPUT AND OUTPUT PORTS ...................................................30 FIGURE 3.22 - SIMULATED AND MEASURED CHARACTERISTIC OF DUAL MODE RESONATOR ........................30 FIGURE 4.1. GRAPH OF MERCURY’S TRANSITION TO THE SUPERCONDUCTING STATE [61] .........................34 FIGURE 4.2. SURFACE RESISTANCE OF YBCO THIN FILM ON LAALO3 SUBSTRATE AT 10GHZ [66] ..........38 FIGURE 4.3. SURFACE RESISTANCE AS A FUNCTION OF FREQUENCY FOR YBCO THIN FILMS AND COPPER AT 77K AND BULK N IOBIUM (NB) AT 7.7K [10] ................................................................................38. FIGURE 4.4. RS VS HRF AT F0 = 1.5GHZ ON YBA2CU3O7-X STRIPLINE RESONATOR FOR DIFFERENT TEMPERATURES..................................................................................................................................39. FIGURE 4.5. COMPARISON OF INPUT POWER VERSUS OUTPUT POWER AT 1.3 GHZ FOR A TI2BA2CACU2O8 FILM AT 80K AND A YBA2CU3O7 FILM AT 70K [69]..........................................................................40 FIGURE 5.1. STIS’ SUPERLINKTM RX 850....................................................................................................41 FIGURE 5.2. CONDUCTUS’ CLEARSITE® 2300.............................................................................................41 FIGURE 5.3. ISCOS’ OMNI .........................................................................................................................41 FIGURE 5.4. SCHEMATIC DIAGRAM OF THE RECEIVE SIDE OF A CONVENTIONAL BASE STATION ................42 FIGURE 5.5. SIMPLIFIED BASE STATION BLOCK DIAGRAM ..........................................................................43 FIGURE 5.6. BLOCK DIAGRAM OF THE CRYOGENIC RECEIVER FRONT END (CRFE) ...................................44 FIGURE 5.7. SCHEMATIC DIAGRAM OF CRFE IN A BASE STATION - BLUE OBJECTS ARE COOLED UNDER VACUUM TO 68K, RED OBJECTS ARE ROOM TEMPERATURE ...............................................................45. FIGURE 5.8. BLOCK DIAGRAM OF DEMONSTRATOR D6 CRFE ....................................................................46 FIGURE 5.9. TSINGHUA'S 16 POLE HTS FILTER DESIGN ..............................................................................47 FIGURE 5.10. SCHEMATIC OF THE PRINCIPLE OF ULTRASONIC WEDGE BONDING USED TO BOND THE FILTER PORTS TO SMA CONNECTORS ...........................................................................................................48 FIGURE 5.11. EXAMPLE OF ULTRASONIC WEDGE BONDING (PICTURE IS NOT OF THE FILTER BONDS) .......48 FIGURE 5.12. FILTER HOUSING WITH SMALL AIR HOLE IN THE TOP LEFT HAND CORNER ..........................48 FIGURE 5.13. TUNING DEWAR .....................................................................................................................49 FIGURE 5.14. D6'S 3CHANNEL OBELISK WITH FILTER-LNA COMBINATIONS MOUNTED ............................49 FIGURE 5.15. FREQUENCY RESPONSES FOR 3 FILTER-LNA COMBINATIONS IN D6 .....................................50 FIGURE 5.16. CRYOELECTRA LNA IN BRASS HOUSING ...............................................................................51 FIGURE 5.17. EXPERIMENTAL OP1 MEASUREMENTS OF THE CRYOELECTRA LNA AT UDC = 5V .................52 FIGURE 5.18. OP1-MEASUREMENT OF A MITEQ LNA ...............................................................................53 FIGURE 5.19. MEASURED CHARACTERISTIC OF OP1 AT 3.5V .....................................................................54 FIGURE 5.20 - CROSS-SECTIONAL VIEW OF THE INTERIOR OF THE VACUUM CHAMBER OR DEWAR ...........55 FIGURE 5.21. BOTTOM OF 3 CHANNEL OBELISK ..........................................................................................56 FIGURE 5.22. OPEN DEWAR OF D6 WITH RF CABLES CONNECTED TO SMA FEED THROUGHS ...................56 FIGURE 5.23. DEMONSTRATOR D6 (LEFT) CONNECTED TO A TVP (RIGHT) AT CRYOELECTRA’S LAB .........56 FIGURE 5.24. ION GETTER PUMP ................................................................................................................57 FIGURE 5.25. ION GETTER PUMP CONNECTED TO HIGH VOLTAGE POWER SUPPLY ...................................57 FIGURE 5.26. HIGH VOLTAGE POWER SUPPLY FOR ION GETTER PUMP ......................................................57 FIGURE 5.27. D6 PROTOTYPE POWER REGULATION AND DISTRIBUTION BOARD ........................................58 FIGURE 5.28. SCHEMATIC OF D6 PROTOTYPE POWER REGULATION AND DISTRIBUTION BOARD ................58. vii.
(9) FIGURE 5.29. D6 FRONT PANEL...................................................................................................................59 FIGURE 5.30. POLAR DRIVE C (LEFT) AND SCHEMATIC OF INPUTS AND OUTPUTS (RIGHT) .........................59 FIGURE 5.31. POLARWARE – SOFTWARE TO CONTROL CRYOCOOLER .........................................................60 FIGURE 5.32. D6 FRONT VIEW OF CHASSIS .................................................................................................60 FIGURE 5.33. D6 OPEN CHASSIS AND OPEN DEWAR ...................................................................................61 FIGURE 5.34. CHINA UNICOM CDMA BASE TRANSCEIVER STATION MEASURED METALLIC FILTER RESPONSE ..........................................................................................................................................62 FIGURE 5.35. MEASURE S21 OF THE HTS FILTER AND METALLIC FILTER OF THE SAME OPERATIONAL BANDWIDTH ......................................................................................................................................62 FIGURE 5.36 - WUNONGCHANG BASE STATION IN CHINA ............................................................................63 FIGURE 5.37 - D6 OPERATIONAL IN WUNONGCHANG BASE STATION ...........................................................63 FIGURE 6.1. CELL TOPOLOGY SHOWING ADJACENT CELL INTERFERENCE [8, 17].......................................69 FIGURE 6.2. AVERAGE USER DISTANCE FROM BASE STATION OF INTEREST (THE BASE STATION IS AT THE CENTRE OF EACH CELL IN THIS DIAGRAM FOR SIMPLIFICATION) ......................................................70 FIGURE 6.3. INTER-MODULATION DISTORTION [90] ....................................................................................71 FIGURE 6.4. EFFECT OF PRE-SELECTION FILTER ON OUT-OF-BAND INTERFERER ........................................72 FIGURE 6.5. COMPUTED COVERAGE VS. CAPACITY (PER SECTOR) WITH NOISE ONLY ................................77 FIGURE 6.6. SCHEMATIC OF 20W OUT-OF-BAND INTERFERER, CDMA CHANNELS AND FILTER CHARACTERISTICS USED IN SIMULATIONS .........................................................................................78 FIGURE 6.7. COMPUTED COVERAGE VS. CAPACITY (PER SECTOR) WITH NOISE AND A NARROWBAND OUTOF-BAND INTERFERNCE OF 20W @ 825MHZ ....................................................................................79. FIGURE 6.8. COMPUTED COVERAGE VS. CAPACITY (PER SECTOR) FOR DIFFERENT SYSTEM IP3 IN THE PRESENCE OF INTERFERENCE OF 20W ................................................................................................80. FIGURE 6.9. COMPUTED COVERAGE VS. CAPACITY (PER SECTOR) FOR FILTERS OF DIFFERENT SELECTIVITY WITH NOISE AND A NARROWBAND OUT-OF-BAND INTERFERNCE OF 20W @ 825MHZ.....................81. FIGURE 6.10. COMPUTED COVERAGE VS. CAPACITY (PER SECTOR) FOR FILTERS OF DIFFERENT SELECTIVITY WITH NOISE AND A NARROWBAND OUT-OF-BAND INTERFERNCE OF 20W @ 828.5MHZ ..........................................................................................................................................................82 FIGURE 6.11. COMPUTED COVERAGE VS. CAPACITY (PER SECTOR) FOR DIFFERENT ENVIROMENTS WITH NOISE ONLY ......................................................................................................................................83 FIGURE 6.12. COMPUTED COVERAGE VS. CAPACITY (PER SECTOR) FOR DIFFERENT ENVIRONMENTS WITH NOISE AND A NARROWBAND OUT-OF-BAND INTERFERNCE OF 20W @ 825MHZ..............................84 FIGURE 6.13. EXPERIMENTAL RESULTS COMPARED TO SIMULATED RESULTS USING THE CDMA UPLINK MODEL ..............................................................................................................................................88 FIGURE 7.1. PICTURES OF D7 FRONT AND BACK SHOWING THE NEW N-TYPE CONNECTORS FOR RF INPUT (TOP OF CRYOSTAT) AND OUTPUT (BACK PANEL) ...............................................................................90 FIGURE 7.2. PICTURES OF D7 WITH REMOVED CRYOSTAT ENCLOSURE TO DISPLAY THE NEW OBELISK WITH A HEXAGONAL CROSS SECTION FOR THE MOUNTING OF 6 FILTER-LNA ASSEMBLIES TO BE USED WITH A. 3 SECTOR CDMA BASE STATION .......................................................................................................90 FIGURE 7.3. PICTURES OF 19” RACK MOUNTABLE D8 FRONT AND BACK ...................................................90. viii.
(10) FIGURE 7.4. PICTURE OF THE MAST MOUNTABLE SYSTEM M1 WITH THE DEWAR OPEN AND A FULL COMPLEMENT OF FILTERS .................................................................................................................91 FIGURE 7.5. PICTURE OF THE LATEST SYSTEM, D9, FEATURING A RICOR STIRLING COOLER .....................91 FIGURE 7.6. NEW GENERATION 12 POLE CDMA FILTER DESIGN ...............................................................92 FIGURE 7.7. NEW GENERATION 20 POLE CDMA FILTER DESIGN ...............................................................93 FIGURE 7.8. FULL WAVE SIMULATED RESPONSE OF THE NEW GENERATION 12 POLE CDMA FILTER .......93 FIGURE 7.9. FULL WAVE SIMULATED RESPONSE OF THE NEW GENERATION 20 POLE CDMA FILTER .......94 FIGURE 7.10. LAYOUT OF THE NEW 20-POLE UMTS FILTER .......................................................................94 FIGURE 7.11. FULL WAVE SIMULATED RESPONSE OF THE NEW GENERATION 20 POLE UMTS FILTER ......95 FIGURE 7.12. ALUMINIUM HOUSED LNA....................................................................................................96 FIGURE 7.13. 6 CHANNEL OBELISK WITH CDMA FILTER LNA COMBINATIONS .........................................96 FIGURE 7.14 - WEIGHT ON THE COLD HEAD (VERTICAL) ............................................................................97 FIGURE 7.15 - WEIGHT ON THE COLD HEAD (HORIZONTAL) .......................................................................97 FIGURE 7.16 – CRFE D8 WITH SPIDER SUPPORT SYSTEM INSTALLED ........................................................98 FIGURE 7.17 – CONCEPTUAL BLOCK DIAGRAM OF RADIATION SHIELD AND INSULATION ........................100 FIGURE 7.18. NEG PUMP WITH VACUUM FEED THROUGH FOR HEATING WIRES ......................................101 FIGURE 7.19. ZEOLITE ...............................................................................................................................102 FIGURE 7.20. NEG PUMP TESTS – COOLER INPUT POWER VS. TIME .........................................................103 FIGURE 7.21 – BLOCK-DIAGRAM OF THE BUILT-IN CRYOGENIC FRONT-END MONITORING, DIAGNOSTIC AND CONTROL SYSTEM ............................................................................................................................105. FIGURE 8.1. DIELECTRIC RESONATOR (LEFT: HFSS FINAL DESIGN, RIGHT: MANUFACTURED INITIAL DESIGN) ...........................................................................................................................................109 FIGURE 8.2. MEASURED Q-FACTOR VS. RESONANT FREQUENCY OF THE DIELECTRIC RESONATOR ..........110 FIGURE 8.3. CAD DRAWING OF 4 POLE DR FILTER AS SEEN IN HFSS.......................................................111 FIGURE 8.4. MANUFACTURED 4 POLE RX DR FILTER (NOTE: COUPLING WINDOWS BETWEEN RESONATORS AND CORRESPONDING ADJUSTABLE TRIM RODS AND TUNING PLATES IN THE LID) ........................111. FIGURE 8.5. SIMULATED FREQUENCY RESPONSE OF 4 POLE RX DR FILTER USING HTSS (S21 – BLUE, S11 – RED) ................................................................................................................................................112 FIGURE 8.6. MEASURED 4 POLE RX DR FILTER RESPONSE .......................................................................112 FIGURE 8.7. SIMULATED 4 POLE RX DR FILTER PASSBAND RESPONSE (Q0 ≈ 40000) ...............................113 FIGURE 8.8. MEASURED 4 POLE RX DR FILTER PASSBAND RESPONSE (Q0 ≈ 20000) ................................113 FIGURE 8.9. EIGHT POLE FILTER DESIGN WITH 2 CROSS-COUPLINGS .......................................................114 FIGURE 8.10. CAD DRAWING OF 9 POLE DR FILTER AS SEEN IN HFSS.....................................................114 FIGURE 8.11. SIMULATED FREQUENCY RESPONSE OF 9 POLE RX DR FILTER ...........................................115 FIGURE 8.12 PHOTOGRAPH OF THE 9-POLE DR FILTER FOR THE UMTS UPLINK (LEFT: COMPLETE PACKAGE, RIGHT: OPEN LID) .............................................................................................................................115. FIGURE 8.13. MEASURED CHEBYSHEV RESPONSE OF THE 9-POLE TX DR FILTER SHOWING -21DB MATCHING AT 2115MHZ WITH 6MHZ BANDWIDTH ........................................................................116. FIGURE 8.14. PHOTOGRAPH OF THE 9-POLE-UPLINK UMTS-FILTER WITH CROSS COUPLING (OPEN LID) 116. ix.
(11) FIGURE 8.15. MEASURED QUASI-ELLIPTIC RESPONSE OF THE 9-POLE TX DR FILTER SHOWING -21DB MATCHING AT 2116MHZ WITH 5MHZ BANDWIDTH ........................................................................117. FIGURE 8.16. MEASURED QUASI-ELLIPTIC RESPONSE IN THE PASSBAND OF THE 9-POLE TX DR FILTER .117 FIGURE 8.17. OPTION 1 – DR DUPLEXER FRONT END ...............................................................................119 FIGURE 8.18. OPTION 2 – WIDEBAND DR DUPLEXER AND CRFE .............................................................120 FIGURE 8.19. DR DUPLEXER LUMPED ELEMENT CIRCUIT MODEL ............................................................121 FIGURE 8.20. DR DUPLEXER RESPONSE OF TRANSMIT AND RECEIVE CHANNELS .....................................122 FIGURE 8.21. DR DUPLEXER CLOSE UP OF TRANSMIT CHANNEL RESPONSE ............................................122 FIGURE 8.22. BLOCK DIAGRAM OF A TRADITIONAL MOC SPLITTING THE UMTS SIGNAL FOR FILTERING WITH CAVITY FILTERS .....................................................................................................................123. FIGURE 8.23. BLOCK DIAGRAM OF A DIELECTRIC RESONATOR MOC .......................................................124 FIGURE 8.24. BLOCK DIAGRAM OF THE DR AND HTS MOC .....................................................................125 FIGURE 8.25. HTS HEXAPLEXER SIMULATED FREQUENCY RESPONSE ......................................................126. x.
(12) TABLES TABLE 3.1. Q0 VALUES AND SIZE VARIOUS FILTER DESIGNS ......................................................................26 TABLE 5.1. CRYOELECTRA LNA SPECIFICATION .........................................................................................52 TABLE 5.2. VOLTAGE SUPPLIES AND CONNECTIONS FOR THE POWER REGULATION AND DISTRIBUTION BOARD ...............................................................................................................................................58 TABLE 6.1. LINK BUDGET PARAMETERS .....................................................................................................74 TABLE 6.2. PROPERTIES OF BASE STATION RECEIVER FRONT ENDS ...........................................................77 TABLE 6.3. PARAMETERS OF INVESTIGATED BASE STATION RECEIVER FRONT ENDS .................................80 TABLE 6.4. PARAMETERS OF FILTERS USED IN FILTER SELECTIVITY EXPERIMENTS ....................................81 TABLE 7.1. VERTICAL AND HORIZONTAL TESTING .....................................................................................99 TABLE 7.2. VERTICAL AND HORIZONTAL MOUNTING TEST RESULTS OF D8...............................................99 TABLE 8.1. COMPARISON OF IMPORTANT PARAMETERS OF PROPOSED AND CONVENTIONAL MOC ..........126. xi.
(13) CHAPTER 1 INTRODUCTION In 1986 two researchers at the IBM Research Laboratory in Rüschlikon, Switzerland, Alex Müller and Georg Bednorz created a ceramic compound that exhibited the transition superconductivity at a temperature of 30K [1], which was at that time the highest known critical temperature (Tc) of a superconductor. This was the first record of high temperature superconductivity, which was made more significant by the fact that previously researches had not considered ceramic materials for superconductivity experiments because ceramics are normally associated with insulators. This incredible discovery was awarded the Nobel Prize one year later 1987. Also in 1987 research into the new superconducting ceramics led a research team at the University of Alabama-Huntsville to develop a new and quite structurally different molecule by substituting Yttrium for Lanthanum in the Müller and Bednorz molecule to create YBa2Cu3O7-δ (YBCO) [2]. This new material exhibited superconductivity at temperatures up to 92K, which could be reached using liquid nitrogen, a commonly available and inexpensive coolant [3].. Early exploratory measurements of the Radio Frequency (RF) Joule losses in polycrystalline YBCO samples [4] and the encouraging experimental results on the RF surface resistance of epitaxially grown YBCO thin films on Strontium Titanate (SrTiO3) substrates [5, 6] indicated the possibility of the application of HTS materials in microwave systems. The early availability of high quality, commercially produced YBCO coated sapphire wafers [7] nourished this expectation. About five years after the discovery of high temperature superconductivity planar superconducting microwave band pass filters appeared to be one of the first and challenging applications of HTS technology in the fast growing area of wireless communication.. At the same time researchers discovered HTS technology and began to think about the first applications, the personal wireless communications industry was beginning to boom. The first analogue mobile phone service (AMPS), a cellular system, had been deployed in Tokyo in 1979 [8]. This system proved to be very successful and subsequently grew in popularity around the world, eventually necessitating the need for the development of more spectrally efficient digital systems to cope with increasing demand. Global System for Mobile (GSM) communications and Code Division Multiple Access (CDMA) were developed in the late 1980s when the AMPS system was approaching its user capacity in heavily populated areas. Today these systems are known as 2nd Generation (2G) systems. By the late 1990s the 2G systems had evolved to include data services in so called 2.5G systems. Wide band variations of these GSM and CDMA systems that incorporate fast data services and multimedia capabilities, known as 3rd Generation (3G) systems, are currently being deployed around the world and offer the latest in communications technology.. 1.
(14) Chapter 1. Introduction. The popularity and affordability of mobile phones has increased since their inception. Today over 1.5 billion people around the world (1/4 of the world’s population) [9] own a mobile phone and in the foreseeable future service providers will once again be presented with network capacities shortages like the AMPS system experienced in the late 1980s. Several options exist to increase the capacity and quality of service, the most obvious of which is to increase the density of base stations in a given area. But the presence of these structures and the associated antennas is not popular with the general public. Another solution would be to use highly selective filters of low insertion loss and cryogenic low noise amplifiers (LNA) of high dynamic range to ensure that only the signals from a chosen service provider’s customers are received and not noise from competitor channels, other wireless services or white noise [10].. In order to provide the highest quality communications services and efficient use of the allocated bandwidth, cellular base stations require highly selective, low insertion loss, band pass filters in the front end of their receivers. When coupled with a LNA of high dynamic range, this Filter-LNA combination (FLNA) in such a base station receiver front end can reduce adjacent channel interference and ensure an increase in the signal-to-noise ratio (SNR). Due to the improved SNR base stations can potentially improve their coverage; eliminating areas with poor reception, black spots, and increase capacity without requiring an increase in the antenna height or number of base stations [11-13]. The low loss nature of the new HTS materials meant planar band pass filters fabricated from YBCO thin film wafers combined with cooled low noise amplifiers (LNA) were considered to be attractive as cryogenic receiver front ends (CRFE) for wireless base stations in cellular communication systems all around the world.. When it became clear that these HTS filters could be reliably fabricated the subject of application became of high economic interest due to the large wireless communications market. A number of commercial companies formed with an aim to develop filter applications and capture this market. The outcome of industry commercialisation was that the new applications and their implementation became confidential. Of the major companies that formed, Superconducting Core Technologies, Superconductor Technologies Inc. (STI), Conductus Inc. and Illinois Superconductor Corporation, the most successful commercial application of CRFE was demonstrated by STI with the installation of about 5000 systems up to September 2005, predominantly in the United States of America [14]. However, due to difficulties in implantation, production, reliability and cost, the new technology has not been widely adopted by the market. As a result many of these companies which formed during the initial hype have now abandoned their work leaving it to be pondered whether HTS filters could really have been used or if they were always just of academic interest. It is the main objective of this thesis to investigate if and under what circumstances high temperature RF-superconductivity can prove to be an important technological contribution to future wireless communication.. This thesis begins by describing the basic principles of wireless communication, followed by an introduction to RF superconductivity and discussion on HTS filter design. After this introduction, fundamental elements and the design of a CRFE (manufactured by Cryoelectra, version D6) are. 2.
(15) Chapter 1. Introduction. described. This includes detailed information on a HTS filter designed at Tsinghua University and an excellent Cryolectra LNA.. Subsequently the author’s work is presented, beginning with his primary contribution to the field, namely a CDMA uplink model. This model primarily allows for the calculation of base station coverage versus capacity (number of users per sector) for different front end setups and environments. The developed model is one of the first of its kind to be published and has been used to examine field trials of the D6 CRFE, discriminating between the improvement caused by the LNA and that caused by the HTS filter. The results of this examination led to the author to develop a series of improvements to create an advanced CRFE in an effort to optimise the performance cost ratio and bring the technology closer to the market. One of the advanced CRFE (D7) has been trialled successfully in Beijing, China. Ultimately two novel room temperatures hardware concepts for base station front ends which can achieve similar performance to the CRFE at significantly reduced expense are proposed. The investigation concludes by looking at the developed CRFE and concepts proposed with the consideration that for any new technology to be successful it must be an improvement over existing technology or be economically beneficial, preferably both.. A chapter by chapter summary of this thesis is given below.. Chapter 2 discusses wireless communications technology and theory which is used in today’s cellular systems. Understanding this is a vital component to making correct design decisions in the development of the CRFE. The chapter begins by explaining the essentials of wireless communications technology; the mobile communications environment, the cellular concept, diversity, fading and the radio frequency spectrum. The current 2nd and 3rd generation mobile phone services are describe in the last section of this chapter.. Chapter 3 briefly describes the fundamentals of microwave filter designs using lumped elements to model distributed element filters such as cavities, metallic, dielectric resonator and planar filters. It also shows how the geometrical factor and losses in the resonator affect its unloaded Q-factor.. Chapter 4 of this thesis outlines the important material properties and physics theories surrounding RF superconductivity and describes why RF filters generated so much excitement as one of the most promising applications of HTS technology. The chapter concludes with some basic planar filter theory and several examples of HTS filters.. Chapter 5 gives an introduction into the conventional base stations and explains why HTS planar filters appear attractive to be used in CRFE. Additionally the current state of the art technology that was used in the first demonstrator CRFE developed by Cryoelectra named D6 is explained. This chapter concludes with the analysis of the March 24th 2004 field trial carried out at Wunongchang, China, performed using D6.. 3.
(16) Chapter 1. Introduction. Chapter 6 presents a CDMA coverage capacity uplink model which was created by the author to examine and explain the results which were obtained in the field trials. This chapter explains the development of the model and analysis of several theoretical situations in order to determine which individual properties of the CRFE are responsible for increasing the coverage and capacity of the base station under different conditions. Finally the need for specific field trials in order to obtain conclusive data is identified.. Chapter 7 describes the improvements made by the author to the old D6 CRFE to create several new advanced CRFE with enhanced performance. Advances in several of the core components make the CRFEs faster to produce and less expensive, while enhancements to the usability of the systems make them easier to operate and modifications to the layout increased the deployment options. The chapter is concludes by presenting the five base station field trials held in the city of Beijing, China. The trials prompted questions as to the nature of the improvements and incited further investigation into other filter technology which might be able to provide similar results at substantially reduced costs.. Chapter 8 present the authors designs of dielectric resonator filters and a couple of novel dielectric resonator duplexers for use in the ultimate base station. The conceptual design for an advanced Multioperator Combiner using dielectric resonators filters and HTS filters is also given.. The conclusions to the thesis are presented in Chapter 9, which includes a discussion of future work in the area of CRFE and other possible implementations of HTS filters.. 4.
(17) CHAPTER 2 WIRELESS COMMUNICATION TECHNOLOGY The first telephone was invented by Alexander Graham Bell in 1876. No one at that time fully envisaged the immense impact this invention would have on the lives of people around the world. For the first time in history people could communicate in real time without being face-to-face over very large distances. In the years since the wire line phone has evolved into what is known today as the cellular or mobile phone. Unlike the wire line system, which uses cables (copper or optical fibre) to transmit signals from one point to another, the cellular system utilises signals propagating through the air between mobile phones and cellular base stations. The base stations are then responsible for connecting calls to their final destination, either directly via the standard wire line phone network or using both the wire line network and another cellular base station. Like the original telephone which brought real time voice communications into peoples homes and businesses, the cellular phone revolution has also had a huge impact on the way people live and work by providing them with communications, and more recently data and video services, anywhere, anytime.. 2.1 ESSENTIALS OF WIRELESS COMMUNICATION As mentioned above, in wireless (or radio) communication an electromagnetic signal is transmitted through free space (air) rather than via a wire. Transmission of signals through the air presents a unique set of challenges which includes the necessity to use antennas for both transmission (Tx) and reception (Rx). These antennas are responsible for transforming electromagnetic waves in free space to time varying voltages and currents in electrical circuits and vice versa. The antenna design is usually independent of its intended purpose (Tx or Rx) and is defined by parameters such as frequency, beamwidth, bandwidth, gain and polarisation.. Information in wireless telecommunications in not transmitted in its raw form, but rather it is processed. A transducer converts the original signal (eg. voice) to an electromagnetic signal which is used to modulate a carrier signal. A carrier signal is usually a simple sinusoidal signal at a much higher frequency than the original signal (typical audio frequencies cover 8 kHz – 22 kHz). Carrier signals are used primarily for two reasons; the first is to reduce the wavelength of the signal for transmission and reception and the second is to allow for simultaneous use of the same channel by multiplexing.. The optimum antenna size is one half or one quarter the wavelength of the Tx or Rx signals, which means that for a 10kHz audio signal an antenna of at least 7.5km would have been required. In contrast by using a carrier signal at 800MHz, such as in 1st and 2nd generation cellular phones, the antenna size is reduced to 76.2mm. With the invention of high relative permittivity (εr) dielectrics it became possible to build very broadband antennas [15, 16] even smaller than one quater the wavelength of the carrier, which is very important for miniaturised antennas for mobile handsets. For this reason the use of a carrier is not. 5.
(18) Chapter 2. Wireless Communication Technology. significant from the point of view of antenna size but rather due to the ability to filter noise and interference from the signals.. The second and now most important reason for the use of a carrier signal is that it allows for simultaneous use of the same channel by multiplexing. Cellular networks primarily use Code Division Multiple Access (CDMA) or Time Division Multiple Access (TDMA – which is the basis the GSM system) to allow multiple phone conversations over a common channel. Allowing for multiple users inside each channel is very important as the radio spectrum is a limited natural resource, and the demands on it are increasing. The limitation on the use of higher frequencies for radio networks is their susceptibility to environmental propagation loss (explained in the next section). Descriptions of CDMA and TDMA systems are given in Sections 2.2 and 2.3.. 2.1.1 THE MOBILE ENVIRONMENT Atmospheric propagation losses increase significantly at high frequencies as shown in Figure 2.1. Losses above 10GHz are caused by moisture in the atmosphere. Peaks occur at 20GHz, due to signal absorption of water vapour, and at 60GHz, due to signal absorption by oxygen molecules. Therefore the mobile phone spectrum has been implemented at frequencies around 800MHz and 1800MHz to 2200MHz where gaseous absorption is minimised and the wavelength is already short.. Figure 2.1. Specific Absorption of RF Signals due to Atmospheric Gases vs. Frequency [8]. 6.
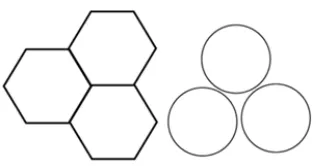
(19) Chapter 2. Wireless Communication Technology. Because base station antennas and mobile antennas are located close to the Earth’s surface, the propagating radio waves are susceptible to natural variation in the terrain, human made structures and electromagnetic industrial noise. As a mobile station moves, the received signal can become stronger or weaker depending on the mobile station’s position and the location of hills or buildings. Additionally ground reflected waves can be received from the base station antenna as well as the direct wave. These reflected waves cause a d-4 propagation loss, which is significantly higher than the d-2 propagation loss through free space, where d is the distance between transmit and receive antenna.. Inside cities human made structures, such as buildings and bridges, cause the signals to be reflected back and forth before reaching the mobile unit, causing signal fading as the mobile unit moves. This multi-path fading causes the average carrier power of the receiving signal to be reduced and therefore degrades voice quality and data rates.. Another problem in urban environments is the electromagnetic noise generated from human made sources such as vehicles, powerlines, industrial equipment and other wireless series. The noise floor is higher in urban areas than suburban areas or open areas, and in general decreases at higher frequencies. One 8 cylinder engine at 3000rpm can generate 200 spikes per second, each spike in the time domain spreads its energy across a wide band in the frequency domain. Hence increased traffic density in urban areas contributes to the higher noise floor in these areas. The noise from 100 vehicles per hour is 32dB above the thermal noise floor at 100MHz, but at 1GHz, 1000 vehicles per hour will only cause a 5dB increase in the noise above the thermal noise floor [8]. Therefore, working in the 800MHz – 2.2GHz region minimises the atmospheric losses and human made noise therefore maximising the systems capacity.. Loss minimisation is particularly important in the case of the uplink (from mobile units to base stations) since the transmit power is much lower than the signals from base stations. Consequently it is important that base stations have very sensitive receivers in order to receive the weakest signal possible, thereby increasing call quality and maximising base station coverage.. 2.1.2 THE CELLULAR CONCEPT The concept of using a hexagonal shape to approximate the coverage of the cellular radio network came about in the early development of Analogue Mobile Phone Service (AMPS). It was desirable to geographically depict an area totally covered by the radio network without any gaps or overlapping lines. The solution therefore was to use a hexagon rather than a circle (Figure 2.2).. 7.
(20) Chapter 2. Wireless Communication Technology. Figure 2.2. Map Coverage Using Hexagonal and Circular Cells. Obviously other shapes could achieve the same goal so why was the hexagon shape chosen? To answer this question it must first be understood that a “cell site” or the base station location is not at the centre of the “cell” or geographical area. In fact each cell site lies at the edge of several cells (Figure 2.3). A reason for the selection of a hexagon was to do with frequency planning and vehicle traffic. Using three sectored sites and a frequency reuse pattern of seven network planners could service all areas and make the most efficient use of the available channels as no adjacent cells would ever use the same channel as illustrated in Figure 2.4. 1 2. 3 4 6. 5 7. Figure 2.3. A Cell Site lie at the Edge of Several Cells [17]. Figure 2.4. Cell Geography Showing Cell Site Antenna Direction and Channel Reuse for AMPS. If sites with the same channels are located too closely together, the signals from the adjacent cell cause interference. Because cellular systems were first planned to be used in city areas and modern cities are based on a grid pattern, network planners needed a solution which would best serve those streets. If four sectors were used (in a square pattern) the cell borders would be at along the streets (if the antenna was directed away from the street) or the sector would point along the street (if the antenna was directed along the street). Either case would cause the mobile units to handoff to the adjacent cell site continuously due to signal fluctuations, creating a ping-pong effect. A large number of handoffs place a very large load on the system and reduce its capacity significantly. The solution to the problem of continuous handoffs was to service the streets using a single dominant sector in the hexagonal pattern. The complete mathematical analysis of this situation of this situation was done by Dr. William Lee at the inception of the AMPS network and been published in many of his works including [8, 18].. 8.
(21) Chapter 2. Wireless Communication Technology. 2.1.3 MULTIPATH SIGNAL FADING AND DIVERSITY ANTENNAS Because the earth is not flat and objects (natural and man made) adorn its surface, RF signals do not always travel directly between transmitters and receivers. In a mobile wireless communication systems, such as the cellular phone network, a RF signal may travel between a transmitter and receiver over multiple reflective paths. This phenomenon is known as multipath propagation. Multipath signals can experience reflection, diffraction and scattering. Reflection takes place when the propagating signal impinges on a relatively smooth surface much larger than the signal wavelength. Diffraction happens when the RF signal encounters a large (compared to the wavelength of the signal) dense object, causing secondary waves to be produced behind the obstruction. In the case where there is no line-of-sight between the transmitter and the receiver, diffraction is the phenomenon that allows the transmitted signal to reach its destination. Scattering occurs when the signal is incident on a rough surface or one of dimensions is close to or smaller than the signal wavelength, causing the reflected signal to spread out in all directions. Multipath fading is the name given when multipath signals affected by these phenomenon cause fluctuations in the received signal’s amplitudes, phase and angle of arrival.. Prominent terrain, such as hills, forests and buildings, may shadow receivers from transmitters. The average signal power attenuation or path loss due to motion over large areas is known as large scale fading. Small scale (Rayleigh fading) refers to changes in signal amplitude and phase that can be experienced in the spatial separation between receivers and transmitters. This form of fading has two primary mechanisms; time spreading of the signal, or signal dispersion, and time variant behaviour of the channel. The time variant behaviour occurs because of the motion between the transmitter and receiver causing propagation path changes. This type of fading is also known as Rayleigh fading, because, if no line-of-sight path exists between transmit and receive antenna, then the link is formed via multiple reflective paths. The envelope of the received signal formed by the reflective signals is statistically determined by a Rayleigh probability density function [8, 19]. Roaming mobile radio signals will experience both types of fading and the receiver must still be able to process the received data for a successful link.. In multipath conditions there is the possibility that all the propagated signals from a transmitter will nullify each other creating a fade where the incident signal strength is lower than the mean level in the surrounding area [20]. While the precise location of a fade is random, on average they are separated by approximately half the wavelength of the signal. For voice services the problem is manageable. For example a person standing still while talking; if the person notices a diminished voice quality or volume from the other party the person tends to move a small amount to where the voice quality improves. In the example of a moving vehicle, the time when bad fading is experienced is relatively short due to the vehicle’s movement. However for data services the problem of multipath fading can cause a significant decrease in data throughput due to the stepping down of data rates to maintain an acceptable bit error rate.. By using two or more separate receive antenna the effects of multipath fading can be significantly reduced. Typically such a system is only implemented at the cellular base station where one antenna is the. 9.
(22) Chapter 2. Wireless Communication Technology. main antenna, which is used for both transmit and receive signals through a duplexer (refer to Figure 5.4), and the other antenna is a diversity antenna, which is receive only. So as to prevent both antenna seeing a deep fade at the same time the antennas are separated by several wavelengths. While this setup has been using at base stations since the inception of the original AMPS network [8] discussion has recently taken place about using a similar system on 3G mobile phone handsets [20].. 2.1.4 RADIO FREQUENCY SPECTRUM, DEMAND AND CAPACITY Different types of radiation, such as visible light, radio waves, X-rays, etc. are referred to as the electromagnetic spectrum. For the reasons mentioned in the Section 2.1.1 only frequencies up to about 10 GHz are useful for communications systems. In particular mobile communications frequencies currently used are between 400MHz and 2.5GHz in order to take advantage of large bandwidths and minimal propagation losses. Because of the limited useful frequency range, the electromagnetic spectrum is regarded as a limited natural resource and therefore needs to be managed efficiently if it is to provide a sufficient medium for communications now and in the future. In wireless communications radio interference and neighbouring channels limit the usability of the spectrum.. When the digital cellular phone spectrum was allocated in the USA, the major driving market factors were [8], 1.. Good coverage. 2.. Good voice quality. 3.. No dropped calls. 4.. Low cost. 5.. Small handsets. These factors and the existing spectrum allocations led to the selection of the 800MHz allocation for cellular communications. Subsequently 1800-1900MHz and 2100-2200MHz frequency bands were allocated when data applications became available and the capacity of the original allocation was being reached.. High data rate applications, such as video, picture messaging and internet require wider frequency bandwidth than traditional voice applications. The voice quality, data rate and system performance are inversely propositional to the system capacity (number of simultaneous users). Therefore in order to maintain the quality of service and add high speed data transfer capability while maintaining customer numbers, the spectrum needs to be used more efficiently. This can be achieved in several ways; improving the sensitivity of the front end of a base station by incorporating low loss filters, cooled high gain amplifiers and tower mounting of the front end could effectively reduce the minimum allowable signal level by improving the signal to noise ratio (SNR), which will allow more concurrent users in a system. Filters with very small transition regions (steep skirts) can effectively reduce the size of the guard bands (unused gap between channels to prevent co-channel interference) and the effects of strong out-ofband interferers which cause inter-modulation distortion inside the passband (due to non-linear elements. 10.
(23) Chapter 2. Wireless Communication Technology. such as mixers and amplifiers). Eliminating inter-modulation distortion is an important aspect in maximising the performance of a radio network. As such improving the linearity of the amplifier and mixers is vital in achieving this goal.. 2.2 2ND GENERATION CELLULAR SYSTEMS The first generation analogue mobile phone system (AMPS) proved to be very successful and subsequently grew in popularity around the world, eventually necessitating the need for the development of more spectrally efficient digital systems to cope with increasing demand. The second generation of cellular phones developed during the 1980’s to facilitate the rapid growth of the cellular communications market. A group, referred to as the Groupe Spécial Mobile (GSM), was formed at the 1982 Conference of European Posts and Telegraphs with the aim to develop a pan-European public land mobile system, now commonly known as Global System for Mobile Communications (GSM) [21]. In February 1989 the CDMA (code division multiple access) system for cellular was introduced. Theoretically CDMA provided 10 times the capacity of the original AMPS system. The successful demonstration by Qualcomm on the 3rd on November 1989 paved the way for CDMA to be adopted as the 2nd generation standard in the USA after a relatively short 5 year development period (GSM took closer to 10 years) [8]. The GSM and CDMA systems are briefly described below.. 2.2.1 GLOBAL SYSTEM FOR MOBILE COMMUNICATIONS (GSM) The criteria set down by the developers of the GSM standard were the following: •. Good subjective speech quality. •. Low terminal and service cost. •. Support for international roaming. •. Ability to support handheld terminals. •. Spectral efficiency. •. ISDN compatibility. •. Support for a range of new services and facilities. These features are taken for granted today and the new services which were added to the original analogue system have been highly successful. The most successful is probably the Short Message Service (SMS); SMS is a bidirectional service for short alphanumeric messages between two subscribers with a message receipt being sent to the sender. SMS has also been used in broadcast mode for traffic updates and network updates when one enters a new country for the first time. GSM users can also send and receive data at 9600bps from normal telephone data services. Other features of the GSM standard included several forms of call forwarding, call barring, caller identification, call waiting and multiparty conversations.. To achieve these results significant network architecture and radio link development was done. The GSM network architecture consists of mobile handsets and the base station subsystems, which controls the radio link with the mobile stations and the network subsystem. This network subsystem performs the. 11.
(24) Chapter 2. Wireless Communication Technology. switching of calls between mobile users and between mobile and fixed network users. The focus of this work is on the front end of the base station subsystem and requires understanding the radio link aspects. As such this is the focus of the discussion in the remainder of this section.. In most parts of the world GSM-900 and GSM-1800 are used. GSM-900 uses 890-915MHz for the uplink (Mobile to Base Station) and 935-960MHz for the downlink. GSM-1800 uses 1710-1785MHz for the uplink and 1805-1880MHz for the downlink. GSM-850, GSM-1900, GSM-400 and variations of GSM900 are also used in various regions in the world [22].. GSM uses a combination of Time and Frequency Division Multiple Access (TDMA/FDMA). The FDMA part divides the maximum 25MHz bandwidth of the GSM channel into 124 carrier frequencies spaced 200kHz apart. A TDMA scheme is then used to further divide the carrier frequencies in time. Eight burst periods, which lasts 15/26ms each, make up a TDMA frame to form a basic logic unit (Figure 2.5). One physical channel (an active subscriber) is one burst period per TDMA frame [21]. The frames are serviced in a round robin fashion and because the rotation is so fast users are unaware of the time slots.. Burst Period. Carrier Frequencies. 11 11 1. TDMA frame 21 11 1. 31 11 1. 41 11 1. 51 11 1. 61 11 1. 71 11 1. 81 11 1 …×124. Figure 2.5. Diagram Representing a 25MHz Bandwidth GSM Channel showing 124 Carrier Frequencies (FDMA) and the TDMA frame and burst periods (TDMA). Because GSM is a digital system, speech has to be digitised before it is transmitted. This is done using a Regular Pulse Excited - Linear Predictive Coder (RPE-LPC) with a Long Term Predictor loop. Convolutional encoding and block interleaving are used to protect the encoded speech or data signals transmitted to the receiver such that they are received correctly despite interference and fading issues [21].. Slow frequency hopping, where the mobile and base stations transmit each TDMA frame on a different carrier frequency, takes advantage of the frequency dependency of the location of signal nulls to alleviate problems with multipath fading. Additionally Co-channel interference is normalised across all the active channels. Discontinuous transmission (DTX), where the transmitter is turned off during silent periods, which account for more than 60% of a typical conversation, is also used to reduce co-channel interference in GSM systems [8, 21, 23].. Another important interference control mechanism implemented in GSM is that of power control. Power control allows mobile units to operate at a minimum power level required to maintain a successful link with a base station. The mobile unit measures the SNR based on the Bit Error Ratio and relays the information to the base station. The base station then decides if the power of the mobile unit requires. 12.
(25) Chapter 2. Wireless Communication Technology. changing. This functionality forms the basis of drive tests, which are used to measure the performance of base stations. While important to GSM for controlling co-channel interference, the power control plays a far more important role in controlling CDMA systems [8, 17, 21].. 2.2.2 CODE DIVISION MULTIPLE ACCESS (CDMA) Because the CDMA cellular service began development 7 years later than the GSM service, it included all the features of the GSM service (discussed in the previous section). However the radio link for the CDMA system is very different to its FDMA/TDMA counterpart. The CDMA system employs what is referred to as a wideband spread spectrum technique to carry digitised voice and data transmissions. Each connected mobile phone in a channel is assigned a unique digital code know as a Walsh code. The code is assigned as a unique pseudorandom noise code generated by the digital radio. This allows the digital signal to be spread over the entire channel along with signals from other mobiles all using the same channel (Figure 2.6). The digital signal of the selected transmission can be decoded at the receiver (which knows the corresponding Walsh code), while all other CDMA signals will appear to be noise. There is a maximum of sixty-four pseudorandom Walsh codes per 1.25MHz carrier in the CDMA modulation scheme. Theoretically there can be nine 1.25MHz carriers per cell, although up to eleven have been used successfully. Typically twenty-two to forty voice calls can be handled simultaneously, however twelve to fourteen are the average for most carriers today. The cell reuse factor of CDMA is usually one, rather than the seven used for the old AMPS system, meaning a more efficient use of the spectrum [17, 24, 25].. 1.25MHz CDMA Channel. Walsh Coded CDMA Signals. Figure 2.6. Diagram Representing a 1.25MHz CDMA Channel Showing MultipleWalsh Coded CDMA Signal. Like GSM, the CDMA base stations use power control to limit the power of the mobile units. It is very important that all CDMA signals arrive at a base station with roughly the same power level so that they can be properly decoded. Power control is required to maintain the system capacity so that close mobiles do not “drown out” the signals from more distant mobiles. The CDMA system can be thought of like a room full of people talking to one another at the same time. If everyone talks very loudly then nobody can hear the person they are speaking to. If however everyone only speaks as loud as required to be heard by their partner then everyone can continue speaking successfully. While in AMPS and GSM systems power control is a performance benefit, for CDMA power control is a critical function in order for the system to operate successfully [25].. 13.
(26) Chapter 2. Wireless Communication Technology. 2.3 3RD GENERATION CELLULAR SYSTEMS In recent years the new 3G cellular network and phones has been the focus of much attention. The revolution is that mobile communications is moving from the voice only delivery to a multimedia capable system, combining camera, video camera, computer, media player and radio into handsets. The 3G also brings together high-speed radio and IP-based services like those available from an internet connected PC. The packet based IP system allows users to be permanently online and gives access to Mobile Internet services including personalised portals, new entertainment, commerce and unified messaging. High speed data, superior quality voice and video communication and other location-based services can be available with the user only paying for sending and receiving data [26]. Like with 2G, the world doesn’t have a unified 3G standard but rather several 3G standards developed from their 2G counterparts. These are briefly described below.. GPRS, General Packet Radio Service is an enhancement of the GSM network that introduces packet data transmission, allowing for a permanent connection to online services and the internet with cost incurred for time of use. GPRS can be viewed as a 2.5G service since only packet data nodes have been added to the existing 2G network, but is typically classed as 3G.. EDGE, Enhanced Data Rates for Global Evolution enables GSM operators to offer 3G services over their existing frequencies. This required a complete upgrade of the GSM system to a full IP and multimedia network. Data speeds of up to 384kbps are available using this system.. WCDMA, Wideband CDMA or UMTS (Universal Mobile Telecommunications System), as it is known in Europe and Japan, is a 3G wideband CDMA service that provides very high speed data rates (up to 2Mbps) and a highly efficient use of the frequency spectrum. At this data rate access to several voice, video and data services is available simultaneously.. The cdma2000 system was built around the framework of the original cdmaOne system (the American 2G CDMA system) and allows current CDMA operators a path to deploying 3G in their existing networks. Fully 3G services are offered with cdma2000, including a packet data rate of up to 2Mbps.. Improvements in chip rate, channel and pilot structure, power control mechanisms, diversity techniques, handoff efficiency and base station synchronisation have significantly enhanced 3G systems since the inception of their 2G counterparts in the early 1990s. However there is a problem with the proposed UMTS (or WCDMA) systems caused by the specification requirement for channels to fit into a 5MHz bandwidth with more than 35dB isolation between adjacent services. A solution to fulfil this requirement is for the UMTS system to use modern, highly selective filters in the receive side of the front end of the base stations [27].. 14.
(27) Chapter 2. Wireless Communication Technology. Spacing of UMTS Frequency Bands. D2. in spe. E+. in spe.. O2. D1. D2. in spe. E+. UMTS-Rx. in spe. O2. UMTS-Tx. 9.9. 9.9. 9.9. 9.9. 9.9. 9.9. 5. 5. 5. 5. 5. 5. 4.2. 4.2 0.75 9.15. 4.2 0.75. 4.2 0.75. 9.15. D1. 4.2 0.75. 4.2 0.75 9.15. 4.2 0.75. 4.2 0.75 9.15. 4.2 0.75. 4.2 0.75. 4.2 0.75. 9.15. 4.2 0.75. 9.15. 0. UMTS Rx or Tx: 9.9 – User block; 5 – Carrier spacing; 4.2 – Carrier BW; 0.75 – Carrier guard BW; 9.15– User useful BW; -30 dB – Required isolation; Min. Steepness=15dB/0.375MHz= 40 dB/MHz. Figure 2.7. European UMTS Frequency Allocations. In Europe UMTS providers are allocated a 9.9MHz user block containing 2 carriers or channels (Figure 2.7). Each carrier has a 4.2MHz bandwidth and carriers are spaced 5MHz apart. Transmit and receive channels should have 80dB isolation at the base station. Individual channels are required to have an isolation of 30dB which requires filters with a minimum steepness of 40dB/MHz [28]. As is described in the next chapter HTS filters, which can yield an almost ideal filter using HTS thin films on a suitable substrate [29-33], are said to be very well suited to this task.. Before discussing the suitability of different filter technologies it is important to understand some of the fundamentals of filter technology. This as well as some practical examples of different filter technologies is the focus of the next chapter.. 15.
(28) CHAPTER 3 FUNDAMENTALS OF FILTER TECHNOLOGY The task of a filter in wireless subsystems is to reduce the bandwidth of the spectrum received by an antenna to the useful frequency range. A bandpass filter can be represented as a chain of coupled resonant circuits. There are several types of resonant circuits which can be manufactured, most commonly used in microwave communications are cavity filter designs. Theoretically cavity filters, metallic filters, dielectric filters and HTS planar filters can all be used in cellular base transceiver stations and each type have certain advantages and disadvantages. While the unloaded quality factor (Q0) of individual resonators of a filter is an excellent indicator of its performance, practical matters related to implementation are also important. Understanding both of these factors is essential in selecting the correct filter type to achieve a higher performance and a practical receiver front end.. 3.1 FILTER BASICS RF Filters have two figures of merit which describe the performance of the filter. The first metric is the steepness of the transition region of the transfer characteristic, which is proportional to the number of resonators and transmission zeros. The second metric is the unloaded quality factor, Q0, which describes the insertion loss and rounding of the band edges. A higher unloaded Q indicates lower losses and less rounding, a more ideal response.. An ideal resonator can be represented by an LC circuit (Figure 3.1). A filter is made from coupled resonators and the coupling between resonators can be electrical, as in Figure 3.2, or magnetic. In practice, excluding lumped element filters, the coupling is a mixture of both electric and magnetic types. This is generally the case at the high frequencies used in wireless communications.. Figure 3.1. Ideal LC Resonator. Figure 3.2. Ideal Filter with Electrical Couplings. Increasing the number of resonators in most filter designs is quite simple and improves the steepness of the response in the transition region. Transmission zeros, created by adding a cross coupling between non-adjacent resonators [30], can also be used to increase the steepness of the transition region. However, as more resonators are added and cross couplings are included, tuning and trimming of the filter response. 16.
Figure
![Figure 2.1. Specific Absorption of RF Signals due to Atmospheric Gases vs. Frequency [8]](https://thumb-us.123doks.com/thumbv2/123dok_us/200814.55406/18.595.187.467.397.740/figure-specific-absorption-rf-signals-atmospheric-gases-frequency.webp)
+7
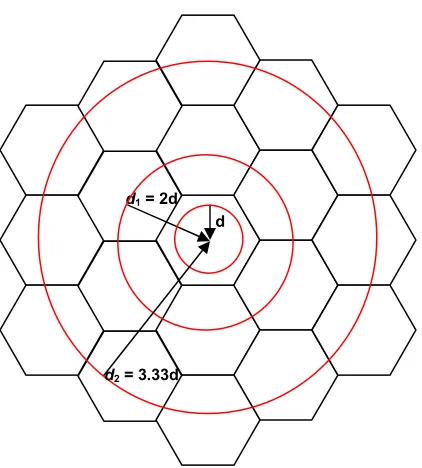
![Figure 6.1. Cell Topology Showing Adjacent Cell Interference [8, 17]](https://thumb-us.123doks.com/thumbv2/123dok_us/200814.55406/81.595.256.422.256.399/figure-cell-topology-showing-adjacent-cell-interference.webp)
Related documents