1
DIAGNOSTIC UTILITY AND
ACCURACY OF OPTIC
NERVE SHEATH DIAMETER
(ONSD) IN DETECTING
RAISED INTRACRANIAL
TENSION
A Dissertation submitted in partial fulfillment of
2 Dr. M.G.R. UNIVERSITY, CHENNAI
to be held in 2016
DECLARATION BY THE CANDIDATE
This is to de lare that dissertatio e titled
DIAGNOSTIC UTILITY AND ACCURACY OF OPTIC NERVE SHEATH DIAMETER (ONSD) IN DETECTINGRAISED INTRACRANIAL TENSION
is y origi al work towards partial
fulfilment of M.D (General Medicine) Branch I Examination of the Tamil Nadu Dr.
M. G. R. UNIVERSITY, CHENNAI to be held in 2016
Candidate
Dr. Allan John Samuel
Post graduate
Department of General Medicine
Christian Medical College
3
CERTIFICATE
This is to ertify that dissertatio e titled
DIAGNOSTIC UTILITY ANDACCURACY OF OPTIC NERVE SHEATH DIAMETER (ONSD) IN DETECTING
RAISED INTRACRANIAL TENSION
, is the o afide origi al work of Dr. Alla
John Samuel, towards the M.D. Branch
–
I (General Medicine) Degree
Examination of the Tamil Nadu Dr. M.G.R University, Chennai to be conducted in
2016
Guide
Dr. Anand Zachariah.
Professor and Head
Department of Medicine Unit – I
Christian Medical College
Vellore – 632004
Co guides:
Dr. Kishore Pichamuthu ( Associate Professor - Critical care)
Dr. Anitha Jasper (Assistant Professor Radiology Dept)
Dr. Soumya S (Professor Medicine-3)
Dr. Samuel Hansdak (Professor Medicine-4)
Dr. Tarun K George (Assistant. Professor Medicine-2)
4
CERTIFICATE
This is to ertify that dissertatio e titled
DIAGNOSTIC UTILITY ANDACCURACY OF OPTIC NERVE SHEATH DIAMETER (ONSD) IN DETECTING
RAISED INTRACRANIAL TENSION
, is the o afide origi al work o
f Dr. Allan
John Samuel, towards the M.D. Branch
–
I (General Medicine) Degree
Examination of the Tamil Nadu Dr. M.G.R University, Chennai to be conducted in
2016
Head of Department
Dr. Anand Zachariah
Head of Department
Department of General Medicine and Medicine Unit- I
Christian Medical College
5
8
Table of Contents
Acknowledgements ... 11
1. Introduction ... 12
2. Aim of the study ... 15
3. Objectives of the study ... 16
4. Literature review ... 17
Embryology of the optic nerve... 17
Optic nerve anatomy: ... 18
Meningitis ... 20
Global prevalence of meningitis ... 20
Asian prevalence of meningitis ... 21
Stroke ... 21
Global prevalence of stroke ... 21
Optic nerve sheath diameter ... 22
Studies among healthy volunteers... 22
ONSD variation with change in position. ... 24
ONSD and IC bleed ... 24
CSF pressure and ONSD dynamic change ... 26
Change in ONSD with anti-edema therapy ... 27
ONSD in the pediatric age group ... 27
ONSD in idiopathic intracranial hypertension ... 29
Meta-analysis and systematic review ... 29
Indian studies ... 33
Study on ONSD and TB meningitis patients ... 35
ONSD and LP correlation ... 36
ONSD and cutoff values- study from Tamil Nadu ... 38
5. Methodology ... 39
Study setting... 39
Study design ... 39
Study period ... 39
9
Inclusion criteria: ... 40
Exclusion criteria: ... 40
Pilot study ... 41
Initial evaluation and triage of patients ... 42
Controls ... 44
Flowchart of patient recruitment ... 45
Measurement of optic nerve sheath diameter... 46
Measurement of CSF opening pressure:- ... 51
Correlation with CT/MRI imaging of the brain ... 52
The criteria for diagnosis of raised ICT on CT imaging ... 52
The criteria for diagnosis of raised ICT on MR brain imaging ... 52
CT features for ischemic stroke ... 53
Diagnostic criteria for raised intracranial pressure ... 54
Sample size calculation ... 54
Statistical Methods: ... 56
Inclusion of patients ... 57
Case definitions:... 57
Strobe figure... 59
Baseline characteristics ... 60
Age distribution ... 60
Gender distribution ... 61
Admission characteristics and treatment outcome ... 63
Table 2. Incidence of symptoms against the type of meningitis ... 65
Baseline ONSD values ... 67
Evaluation of ONSD as a diagnostic tool ... 70
Figure.9 ROC curve of ONSD vs raised ICT by CT/MRI imaging of the brain ... 72
Subgroup analysis ... 76
ONSD with CSF pressure in meningitis patients ... 76
ONSD with imaging in meningitis patients ... 78
ONSD with imaging in cerebrovascular accident ... 78
Symptoms correlation with different modalities and raised ICT ... 81
10
Role of ONSD in follow up ... 84
Temporal profile of symptoms (Table 16) ... 84
Discussion ... 86
Conclusion ... 91
Recommendations ... 92
Limitation ... 93
6. Bibliography ... 94
7. Appendices ... 101
Patient information sheet. ... 101
Consent form ... 103
CLINICAL QUESTIONNAIRE FOR ONSD STUDY ... 105
11
Acknowledgements
Right at the outset, I want to thank my guide Dr. Anand Zachariah, with all my heart for
meticulously and painstakingly guiding me through this entire process of completing my
dissertation. I cannot thank him enough for all the patience and kindness with which he
dealt with me and every single problem that I had during this course. I would also like to
thank my co-investigator Dr.Kishore Pichamuthu for training me in doing USG guided
ONSD measurement. Also I would like to thank my co-investigator Dr. Anitha Jasper, for
reviewing all the neuroimages of the brain and assessing them for raised intracranial
tension.
I am also grateful to the entire Department of Medicine, Department of Emergency
Medicine, Department of Critical care for all the support I received in preparing this
dissertation throughout my three years course in General Medicine. I would specially like
to thank Dr. L. Jeyaseelan and Mr. Prakash Ramasami from the Department of Clinical
Epidemiology, who helped me with the analysis of the data.
I would like to thank to all the hospital patients who agreed to be a part of this study. I am
deeply thankful to God whose daily love and encouragement was inevitable in doing this
thesis. I would also like to thank my wife Dr. Femi K Sam for all the encouragement and
12
1. Introduction
Patients presenting to the Emergency department with acute onset of altered sensorium is
very common. The commonest etiologies are CNS infections and cerebrovascular
accident. Central nervous system infections such as meningitis or meningoencephalitis
are a very common disorder seen especially in the young adult. All patients with
suspected CNS infections require cerebrospinal (CSF) analysis to be done for diagnosis
as to the etiology of the disease and to decide on further treatment plan. But CSF analysis
is contraindicated in patients with raised intracranial pressure since it can lead to the
herniation of the brain and death. In patients with cerebrovascular accident intracranial
pressure can be increased as part of the diffuse cerebral edema in case of ischemic strokes
or because of the space occupying nature of hematoma in case of intracranial
hemorrhage. Increase in intracranial pressure as part of the disease process or due to
complications such as hydrocephalus will contribute towards clinical deterioration of the
condition of the patient and may require treatment for the same in the form of anti edema
measures or even surgical procedures. Hence the intracranial pressure plays a critical role
in the management of these patients.
Traditionally the only methods to measure intracranial pressure were by intraventricular/
intraparenchymal catheters placed in the brain, or in case of patients with extra
ventricular drainage procedures, from the drain. The third method which was being
13
and connecting it to a manometer or pressure transducer. The former two were considered
as gold standard for measuring raised intracranial pressure while the third being
considered as less reliable and predictive of the true intracranial pressures in many
studies. But all these procedures are invasive with inherent procedure risks and risks of
infection. The former two are done usually in patients with traumatic brain injury or post
neurosurgery as it is unethical to undergo such invasive procedures in patients with
central nervous system infection who are being evaluated in the current study.
Hence unsurprisingly non-invasive procedures to measure intracranial pressures have
been of keen interest. One such recent test was the introduction of transcranial Doppler to
assess intracranial pressure. But this has gone out of vogue in view of the high technical
expertise needed and the poor reproducibility. Hence in current clinical practice
commonly employed method to look for raised intracranial pressure is computerized
tomography or magnetic resonance imaging of the brain. But they give only an
impression whether the intracranial pressure is raised or not at the point in time when the
test being done. And these tests are expensive, time consuming, not frequently available
in remote locations and more importantly cannot be done at the point of care. This is
important as many of these patients will be in the intensive care unit requiring close
monitoring and care. Hence an easy, rapid, inexpensive bedside test to assess for raised
14
Measurement of optic nerve sheath diameter (ONSD) using ultrasonography is an
inexpensive and rapid method to determine raised intracranial tension. But the efficacy of
this test to detect raised intracranial pressure as compared to neuroimaging or direct
measurement of CSF pressure in patients with altered sensorium in medical patients and
in the Indian setting has not been established. Currently computerized tomography or
magnetic resonance imaging is used in patients with suspected meningitis and altered
sensorium before doing lumbar puncture to rule out raised intracranial pressure.
However, this test is expensive, time consuming and not freely available, especially in
rural locations. The availability of a cheap and easy to perform test will simplify the
initial management of such patients. The study aims at measuring the optic nerve sheath
diameter in patients presenting to Christian Medical College, Medicine department with
altered sensorium and acute cerebrovascular accident and the correlation of the optic
nerve sheath diameter with raised intracranial tension as confirmed using either direct
measurement of Cerebrospinal fluid pressure during lumbar puncture or comparing with
signs of raised pressure in computerized tomography or magnetic resonance imaging of
the brain. At the end of the study we are trying to answer the following questions.
1. Can ONSD be used to diagnose raised intracranial pressure in patients with stroke
and acute CNS infection?
2. Can ONSD be used to monitor clinical improvement in patients with stroke and
15
2. Aim of the study
The aim of the study is to establish the relationship between optic nerve sheath diameter
(ONSD) and the intracranial pressure (ICP) in patients with suspected central nervous
16
3. Objectives of the study
1.To assess the diagnostic utility and accuracy of optic nerve sheath diameter
(ONSD)in detecting raised intracranial tension as determined by CT/MRI imaging
or CSF pressure during lumbar puncture in patients with central nervous system
infection, acute cerebrovascular accident and acute onset altered sensorium.
2.To assess the temporal profile of ONSD in patients with acute CNS infection
17
4. Literature review
Embryology of the optic nerve
The genesis of the optic nerve sheaths start towards the later part of the seventh week of
gestation. Slender, long mesenchymal cells will envelop the optic nerve and will
gradually transform into one well knitted layer. Towards the tenth week of life the pia
mater is distinguishable. This is succeeded by the dura mater towards the fifth month of
life and then the arachnoid mater by seventh month of life. The pia mater and the
arachnoid layers originate from the neural crest cells.
The Optic nerve: It traces its origin from the optic stalk which is present in the embryo.
This optic stalk appears in the embryo by the fourth week of gestation and then bridges
the optic vesicle with the forebrain. Gradually this stalk elongates and becomes narrower.
The cavity of the stalk is systematically taken over by the axons from the ganglion cells
of the retina. These axons gradually take over completely the optic stalk lumen by the
eighth week. The axons extend till the brain and a preliminary optic chiasm is created.
The physiology behind the retinal ganglion cells migrating till the optic disc has still not
been elucidated.
The axons belonging to the optic nerve is myelinated. This process initially starts in the
central portion and then gradually progress in an outward manner till the lamina cribrosa.
The myelin sheath originates from the oligodenedrocytes and it is completed following
18
Optic nerve anatomy:
The optic nerve is a white matter tract and its length in humans is about 50 mm and about
3mm in width extending from the eye to the optic chiasm. Ontogenetically the optic
nerve is a component of the CNS. It is divided into four parts. The optic nerve head or the
intraocular portion is about 1 to 1.5 mm long. The second or the intraorbital part is about
30 to 40 mm in length and has a tortuous path which is in the shape of an S to allow for
the movements of the eye. The third or the intracanalicular part is about 5 to 8 mm in
length and is adherent to the canal. The fourth or the intracranial part is about 10 mm in
length and leads up to the optic chiasm where it meets the opposite optic nerve.
Inside the cranium the optic nerve is sheathed only by the pia mater and inside the optic
canal it is sheathed by the arachnoid mater also. Near the optic foramen the duramater
from the cranium also comes and bisects into the outer layer which will fuse with the
perioteum of the orbit. The inner layer will join the optic nerve. Hence inside the orbit
and optic canal the optic nerve is encased by all the three layers. These 3 sheaths are the
extensions of the meninges of the central nervous system. The outer layer of the sheath
ie. the dura mater consists of thick and dense collagenous fibrillae. The thickness of the
duramater ranges from 0.35 to 0.5mm. Anteriorly, along with the ciliary vessels and
nerves, it splits and insert into the sclera and rectus muscle. Posteriorly it consists of 2
layers, the first merges with the periosteum of the canal. The second layer is fused with
19
with the periosteum of the sphenoid bone. There is a potential space betwixt the
duramater and arachnoid which is called the subdural space and the space betwixt the
arachnoid and piamater known as subarachnoid space. These spaces maintain connection
with the respective intracerbral spaces.
The second layer, the arachnoid mater is quite consists of elastic and collagenous fibers
with blood vessels and Fibroblasts. The fibers form a mesh like trabecular pattern which
are coated with meningothelia. The meningothelia can replicate and form onion shaped
structures. These structures are called psammoma bodies and when calcified are known
as corpora arenacea.
The final layer, the pia mater is adherent to the optic nerve and is made up of collagenous
and elastic fibers. Pia mater is adherent to the optic nerve and it has fibers extending into
the nerve to form septations. The pia mater fuses with the sclera and choroid layer in the
anterior aspect. In the posterior aspect, the pia mater extends through the optic foramen
and results in a fused single layer around the intracranial part of the optic nerve.
Between the dura and the arachnoid mater there is the subdural space. The subdural space
has no connection with the intracranial subdural space and hence is not of clinical
importance. But the subarachnoid space maintains its connection with the intracranial
subarachnoid space namely the chiamal cistern. Hence it contains the cerebrospinal fluid
which acts as a conduit for transmis
20
Meningitis
Global prevalence of meningitis
In a study done in USA, where over a 9 year period 3188 patients with meningitis were
enrolled in th study. In this study the prevalence in adult age group ranged from 0.66 to
1.38 cases per 1,000,000 population. As expected, the incidence was much higher in
neonate group. The statistics also have shown a persistent and significant fall in the
incidence of meningitis since 1970. There has been a 55% fall in the incidence of
bacterial meningitis since 1970(1). This decrease had been mainly in the pediatric age
group due to the introduction of Hemophilus b vaccination. In the adults, the mortality
rate was 16.4%, which increased progressively with age. (upto 22% in those aged above
65 years of age). Streptococcus pneumoniae was the most common pathogen isolated in
the adults. Although thre had been significant decrease in the incidence of meningitis, the
mortality rate had remained the same with little decrease over the years. (2)
In an observational study done among in Netherlands, 754 patients with community
acquired meningitis was enrolled in the study based on data from Netherlands research
laboratory for meningitis. The data showed that the symptoms of headache, nuchal
rigidity and febrile episode were present in 87%, 83% and 77% respectively. The triad of
symptoms was present in about 44%. Altered sensorium was present in only 69% only.
21
Asian prevalence of meningitis
In a retrospective done in a single centre in Thailand, 161 cases were identified over a 20
year period. In this study 59% was due to hospital acquired causes, and among the
community acquired pneumonia, Streptococcus pneumoniae was the most
common pathogen which was identified. The mortality rate was 15.5% (4)
Stroke
Global prevalence of stroke
In a meta analysis of 119 studies, the world wide incidence of strokes were looked at. The
data from this study showed about 11569538 incidents of ischemic cerebrovascular
accident occurs per year with about 2835419 people dying per year. Hemorrhagic
cerebrovascular accident events numbered about 5234997 episodes with 3038763 deaths.
In the low income nations there was also noted that there is 22% increase in hemorrhagic
cerebrovascular accidents.(5) The infarcts caused about 68% of stroke while hemorrhage
22
Optic nerve sheath diameter
Studies among healthy volunteers
A study was done in China among 519 healthy subjects to assess the normal variation in
optic nerve sheath diameter. All the measured characteristics including optic nerve sheath
diameter, optic nerve diameter and eyeball transverse diameter showed a non-normal
distribution. There was no statistically significant difference between male and female
and among the right and left eyes.(6)
A prospective observational study was done in Hong Kong among non- neurological
patients and staff in the Emergency department of the hospital. 100 candidates were
enrolled in the study and the mean optic nerve sheath diameter was 4.05mm. There was
no statistical difference between gender, the side of the eye and among the staff and the
patients. (7)
In another study done among 42 healthy individuals comparing routine transverse visual
axis technique versus infraorbital approach. The study showed no statistically significant
difference both the groups. (8) The average ONSD of the right eye was 4.73mm (0.73)
and left eye was 4.48 mm (0.62)
In a prospective study done in Bangladesh to determine the normal values for the optic
23
value was calculated to be 4.41mm (4.24-4.83mm). The ONSD values were distributed in
a bimodal pattern. The highest value was 4.75mm. (9).
In a study done among 400 healthy volunteers in Nigeria to look for the normal value of
the optic nerve sheath diameter. The median value for the optic nerve sheath diameter
ranged from 3.36to 5.1mm. There was no statistically significant difference between the
24
ONSD variation with change in position.
A prospective case control study done among 10 normal volunteers, to look for variation
in ONSD with position. In these patients ONSD was checked in the supine,
Trendelenburg’s and revere Trendelenburg’s position, with a time gap of 1 minute
between each of these positions. There were no statistically significant differences
between any of the positions and the optic nerve sheath diameters. The mean the optic
nerve sheath diameter in the right and left eye while the patient was lying supine was
4.6mm and 4.5 mm and while in Trendelenburg’s position it was 4.4mm and 4.7mm
while in reverse Trendelenburg’s position it was 4.4mm and 4.8mm. (11)
ONSD and IC bleed
In a prospective study 35 patients with probable intracranial bleed secondary to trauma or
aneurysmal rupture and probable raised intracranial pressure were enrolled. Among them
14 patients had features of raised intracranial pressure. The mean ONSD among these
patients with raised intracranial pressure was 6.27mm (95% CI ¼ 5.6 to 6.89). and was
4.42mm (95% CI ¼ 4.15 to 4.72) in the normal intracranial pressure group. The
sensitivity was 100% with a specificity of 95%. (12)
In another prospective study done in Netherland, 18 patients were enrolled in the study.
Here the variability of ICP and ONSD with tracheal suctioning maneuvers was assessed.
25
cutoff of 5 mm the area under the curve was 0.99 with the sensitivity being 94% and the
specificity being 98%.(13)
Fifteen patients were enrolled in the study of which 4 had trauma and 11 had spontaneous
ICH. All the patients had invasive intracranial pressure monitoring. The relationship
between optic nerve sheath diameter and ICP was plotted. For intracranial pressure of 20
or more the average optic nerve sheath diameter was found to be 5.4 ± 0.49 mm while for
the controls with intracranial pressure of less than 20 cm of water the average optic nerve
sheath diameter was 4.4 ± 0.49 mm. Using the intracranial pressure an ROC curve was
plotted which showed the area under the curve to be 0.93 (95% CI = 0.84 to 0.99). The
standard of 5mm showed a sensitivity of 88% and specificity of 93% (14)
In another study 12 patients with chronic subdural hemorrhage or hygroma were enrolled
and the optic nerve sheath diameter was compared to subdural pressure. The mean optic
nerve sheath diameter preoperatively was found to be 6.1mm ± 0.7. Post operatively the
mean optic nerve sheath diameter decreased to 4.8mm ± 0.9 mm. (15)
In a case report optic nerve sheath diameter was compared with CT imaging features of
raised intracranial tension in patients who had presented with hyperacute intracranial
hemorrhage secondary to CVA. 4 patients were compared and a significant positive
relation was detected between ONSD and the midline displacement of the ventricle. (16)
In another study done in Czech Republic where 31 patients with acute hemorrhagic
26
16 normal subjects. The mean ONSD in the ICH subjects was 5.48mm while in the
normal controls was 3.41mm and in ischemic stroke was 3.42mm. The sensitivity for the
cutoff of 5mm to detect a hematoma more than 2.5cc volume was 70% and the specificity
was 100%.(17)
One study was done in Turkey where 28 patients with raised intracranial tension (both
trauma and non-trauma) on CT imaging were enrolled and their optic nerve sheath
diameters were measured. The mean optic nerve diameter in the subjects with the raised
ICT was 6.4mm and for those in the control group it was 4.6mm.(18)
CSF pressure and ONSD dynamic change
Another study was done in Germany among patients with presumptive diagnosis of CSF
absorption disorders such as communicating hydrocephalus. They underwent intrathecal
infusion of Ringer’s solution through the intrathecal needles inserted in the lower lumbar
region. The continuous CSF pressure was being monitored by another intrathecal needle
connected to a pressure transducer. The results showed positive correlation between the
increase in intrathecal pressure and the optic nerve sheath diameter. The maximum
increase in the optic nerve sheath diameter correlated with the maximum intrathecal CSF
pressure with an average increase of 1.8mm or 45% increase from the baseline optic
27
Change in ONSD with anti-edema therapy
A prospective observational study was done among patients with traumatic brain injury
or subarachnoid hemorrhage. 13 patients were enrolled in the study and they had either
EVD pressure monitoring or intraparenchymal pressure monitoring. All these 13 patients
had elevated CSF pressure and had to be started on mannitol therapy as part of anti
edema measure to reduce CSF pressure. There was significant correlation between the
ICP and the ONSD before and after mannitol therapy and was associated with decrease in
CSF pressure after the mannitol therapy(20)
ONSD in the pediatric age group
In the study 21 children in Malawi, Africa with suspected raised intracranial pressure, the
common diagnosis being space occupying lesions, meningitis and coma were evaluated.
14 children had suspected raised intracranial pressure and 8 of them had CT imaging of
the brain done. All 8 of these children had raised intracranial pressure with a mean ONSD
of 5.4mm (4.3–6.2 mm). The remaining 7 had no features of raised intracranial pressure.
Four children out of seven had imaging of the brain done and all of them were normal
28
children with mean ONSD of 3.5mm (2.5–4.1 mm). For a ONSD cut-off of 4.2 mm the
sensitivity was calculated to be 100% and the specificity was 86%.(21)
In a study done among 17 pediatric patients with raised intracranial tension post shunting
of hydrocephalus to look for correlation between optic nerve sheath diameter and
correlation with hydrocephalus, it was found that these patients had high ONSD values of
4.5 mm or more. These patients were designated as group 4. Group 1 had normal healthy
volunteers. Group 2 had patient post shunting of hydrocephalus and was asymptomatic
while group 3 had patients post shunting of hydrocephalus and was initially symptomatic
for raised ICT but they became asymptomatic later and their symptoms were deemed not
29
ONSD in idiopathic intracranial hypertension
In a study done in Germany where 10 patients with idiopathic intracranial hypertension
were enrolled and their ONSD were measured. The patients had mean optic nerve sheath
diameter of 6.4 +/-0.6mm. After the lumbar puncture, they were noted to have decrease in
the optic nerve sheath diameters in both the eyes. There was also no statistically
significant difference between the ONSD and age, gender or BMI of the patients.(23)
Meta-analysis and systematic review
In a meta-analysis done of 6 studies which focused on ONSD and invasive intracranial
pressure monitoring, it showed a sensitivity of 86.7% and a specificity of 79.4%. The
problem of the study was that different studies had taken different cutoffs varying from 5
mm to 5.9mm. All the studies were done in traumatic brain injury patients or on patients
31
Meta-analysis was done to evaluate the efficiency of the optic nerve sheath diameter as
measured by ultrasound with invasive intraventricular cerebrospinal fluid pressure
monitoring. Out of the 699 articles evaluated, 6 were included in the meta-analysis. The
pooled sensitivity of the ONSD was 90% and the specificity was 85%. There was no
32
In a meta-analysis, 12 studies which compared optic nerve sheath diameter with CT
imaging was compared. The meta-analysis showed a sensitivity of 95.6% and specificity
33
Indian studies
In a study done in Mumbai where 100 traumatic brain injury patients were enrolled. 73
patients had CT features of raised ICT. The mean optic nerve sheath diameter in this
group was 5.8 +/- 0.57mm. In the other group with no raised ICT, the mean ONSD was
3.5 +/-0.75mm.(27)
A prospective study was done in Hyderabad in patients admitted with altered sensorium
and raised intracranial tension due to various medical causes. Among the 60 patients in
Group B, 35 had features of raised intracranial tension on neuroimaging. Of these, 21
cases were diagnosed as having meningitis and 12 cases had stroke (both ischemic and
34
5.43+/- 0.53mm. The ROC curve was calculated and the area under the curve was 98.6%
with sensitivity being 77.8% and specificity being 100%. Among the normal 25 patients,
2 were diagnosed as having meningitis and 18 cases had stroke (both ischemic and
hemorrhagic) and 5 had metabolic encephalopathy. The Group A had 41 healthy controls
35
Another study was done by the same author comparing Optic nerve sheath diameter with
the MRI imaging enrolling 100 patients with diagnosis of meningoencephalitis. The mean
Optic nerve sheath diameter for the women was 5.48mm +/- 0.43mm and among the
males was 5.40 mm +/- 0.37mm. (29)
Study on ONSD and TB meningitis patients
In another study done among 25 patients with tuberculous meningitis and compared with
controls. The patients with tuberculous meningitis had a mean ONSD of 5.81mm while in
the control group mean ONSD was 4.37mm. There was no data available regarding the
sensorium or clinical condition of patients or the confirmation of tuberculosis diagnosis.
Also there was no data regarding intracranial pressure or the imaging features of raised
36
ONSD and LP correlation
In a blinded cross-sectional study of patients with suspected raised intracranial tension,
279 patients were enrolled and their optic nerve sheath diameter and lumbar puncture
pressure was measured. 101 subjects had elevated CSF opening pressure during lumbar
puncture while 178 subjects had normal opening pressure. In patients with elevated CSF
pressure the average ONSD was 4.58 +/- 0.46mm while that of the normal CSF pressure
group was 3.55 +/- 0.38mm. Out of the 279 subjects, 18 had bacterial infection, 132 had
viral infection, 1 had fungal infection, 3 had neurocysticercosis and 2 had neurosyphillis.
The rest of the 123 subjects did not have any infectious etiology and were found to have
CVA in 43 subjects, intracranial space occupying lesion in 17 subjects, hydrocephalus in
6 subjects and peripheral neuropathy in 21 subjects. A ROC curve was generated using
the CSF pressure as the standard and it provided an area under the curve of 0.965. The
sensitivity calculated was 95% with a specificity of 92% at a cutoff point of 4.1mm(31)
In a study done in USA where patients presenting to the emergency services and
requiring lumbar puncture were enrolled and the correlation between CSF pressure and
ONSD was analyzed. The indication for the lumbar puncture was mainly to rule out
infection in 30 (58.8%) patients and to rule out subarachnoid hemorrhage in 11(21.6%).
All the patients had non traumatic causes for the raised ICP. The sensitivity of the optic
nerve sheath diameter cutoff of 5mm was found to be 75% with a specificity of 44% with
37
showed good correlation between ONSD and ICP, this study was done exclusively in non
trauma patients and it showed a poor specificity as compared to CSF pressure measured
by lumbar puncture.(32)
In a study done among 98 Human immunodeficiency virus infected Ugandan patients
with suspected cryptococcal meningitis. Four subjects were diagnosed as having
tuberculous meningitis, 15 were found to have aseptic meningitis of unknown etiology
and 79 were diagnosed as having cryptococcal meningitis. The median value of the optic
nerve sheath diameter was 5.5mm (both pre lumbar puncture and post lumbar puncture).
38
and the specificity was 59% for detecting a CSF opening pressure greater than 20cm of
CSF (25).
ONSD and cutoff values- study from Tamil Nadu
In a study done in Vellore, 60 patients admitted to Intensive care unit underwent ONSD
measurement. 14(23%) patients had features of raised intracranial pressure. The
measurements were taken 3mm behind the papilla and also 3mm behind the globe to look
for their agreement with raised ICT. All values correlated with raised ICT, though there
was variation in the cutoff values. (33)
3mm behind
papilla - within
anatomic dura
3mm behind
papilla - within
echogenic fat
3mm behind
globe - within
anatomic dura
3mm behind
globe - within
echogenic fat
39
5. Methodology
Study setting
The study was conducted in Christian Medical College, Vellore (CMC). It a tertiary care
level hospital situated in Vellore, Tamil Nadu.
Study design
This was a prospective observational study. The primary investigator was unaware of the
CSF pressure or the brain neuroimaging findings at the time of the measurement of the
optic nerve sheath diameter. The radiologist and the doctor performing the lumbar
puncture were also unaware of the optic nerve sheath diameter values.
Study period
The patients were recruited from July 2014 –August 2014
Selection of patients
Method of recruitment:
All adult medical patients admitted to ward or ICU with (1) altered sensorium, (2)
clinical picture suggestive of acute CNS infection or (3) stroke without history of trauma
and with no past history of any raised intracranial tension will be included in the study
40
Inclusion criteria:
1. Patients who are clinically suspected to have CNS infection and who have had or
are being planned for lumbar puncture with or without brain imaging (CT scan or
MRI).
2. Patients who present with clinical picture of acute cerebrovasular accident who
had brain imaging (CT brain or MRI) within last 24 hours or who are planned for
CT/MRI brain in the next 24 hours
3. Patients who present with other causes of altered sensorium with GCS of 13/15 or
below and who have had or are being planned for lumbar puncture or brain
imaging (CT scan or MRI).
Exclusion criteria:
1. Consent not being given
2. Patients with history of chronic raised intracranial tension.
3. Patients with traumatic brain injury.
4. Pregnant women and children less than 15 years of age will not be included in the
41
Pilot study
Preliminary work done by the primary investigator includes chart review of Inpatients in
Medicine-department from January 1st 2013 to May 31st 2013. 529 charts were
reviewed and it showed 50 patients who had met the inclusion criteria. Of these raised
ICT was present in 8 out of the 50 patients.
The break-up for the 8 patients with raised ICT was:-
TB with hydrocephalus = 6/50
CVA = 1/50
Toxoplasmosis = 1/50
These data were useful in planning the study and calculating the sample size.
Also as part of preliminary study, the primary investigator had done ONSD measurement
of patients admitted in ICU, for a variety of diagnosis. 10 patients were evaluated and the
results were cross checked by ICU consultant who is a trained sinologist. These showed
no significant variation in the ONSD values and following which the study was
42
Initial evaluation and triage of patients
At presentation based on clinical diagnosis of meningoencephalitis or cerebrovascular
accident the patients were triaged into either the cerebrovascular accident or the
meningitis/ encephalitis arm. The patients with suspected meningoencephalitis were seen
by the primary investigator before the lumbar puncture. After obtaining the informed
consent, the patient history was taken and clinical examination was done. Following
which the ultrasound examination of both the eyes using Sonosite M turbo high
frequency linear probe (6-13MHz) was done in the supine position and the optic nerve
sheath diameter were noted. Based on the treating team’s decision patient will then
undergo imaging of the brain including Computed tomography (CT) or Magnetic
resonance imaging (MRI).Lumbar puncture was then done if no contraindications such as
raised intracranial pressure (decided on the basis of papilloedema and/or brain imaging)
or bleeding diathesis was present. During lumbar puncture, the cerebrospinal fluid
pressure was measured using intra arterial extension line and the cerebrospinal fluid
column length in cm was noted. The patients following this were admitted in the ward
and then followed up with repeat ultrasound imaging on day 4 and day 7 along with
clinical examination to look for improvement in clinical condition including GCS score
43
Patients with clinical diagnosis of cerebrovascular accident were admitted in the ward
and underwent brain imaging including Computed tomography (CT) or Magnetic
resonance imaging (MRI) as decided by the treating team of physicians. They were seen
in the ward by the primary investigator and then after obtaining the informed consent, the
patient history was taken and clinical examination was done. Following which the
ultrasound examination of both the eyes using Sonosite M Turbo high frequency linear
probe (6-13MHz) was done and the optic nerve sheath diameters of both the eyes were
noted. They were followed up with repeat ultrasound imaging on day 4 and day 7 and
clinical examination to look for improvement in clinical condition including GCS score,
sensorium and neurological deficits. Since lumbar puncture was not clinically indicated
in these patients, cerebrospinal fluid pressure was not measured. If any repeat brain
imaging was done as decided by the treating team, these were also reviewed for the
purposes of the study.
The brain imaging were analysed by a trained Radiologist who was unaware of the
clinical details of the patient. The computed tomography images were evaluated for
features of raised intracranial pressure such as sulcal and gyral effacement, dilated
ventricles, periventricular CSF seepage and brain stem herniation. In MR images of the
brain, additional features such as tortuosity of the optic nerve as it traverses through the
orbital canal, and flattening of the posterior scleral wall were also noted. The Radiologist
also will examine the images for features of ischemic or hemorrhagic cerebrovascular
44
Controls
Normal individuals with no neurological illness or features of raised intracranial pressure
were enrolled as controls. These were patients admitted in the hospital ward for other
conditions. Since they did not have any suspected neurological condition they did not
undergo lumbar puncture or brain imaging. There will be 1 normal control for every
45
Flowchart of patient recruitment
46
Measurement of optic nerve sheath diameter.
This was done by the primary investigator using Sonosite Mturbo high frequency linear
probe (6-13MHz) after having been trained by ICU Consultant who is trained Sonologist.
Initially the primary investigator was trained by the ICU consultant, and afterwards all
the images were saved and reviewed by co- investigator to reduce the chance of error in
measuring values. The measurement was done using the high frequency linear probe
(6-13MHz) Hz frequency probe. The measurement was done in supine position with the
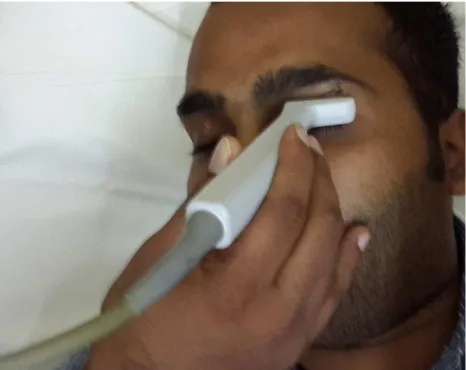
patient directing his gaze anteriorly. Copious amount of ultrasound gel was applied to the
probe and the probe was applied horizontally over the closed eyelid as shown in figure `1.
The optic nerve and its sheath layers were visualized at a point 3 mm from the papilla as
this was the place of maximum distension in case of raised intracranial tension. Using the
integrated caliper a point 3 mm perpendicular from the papilla was identified. The
horizontal diameter was measured at this point from the inner surface of dura to dura.
The values for both the eyes were recorded and the image with the measured valued was
saved, for later review. All saved images were reviewed by the trained ICU sonologist
and measurements were counterchecked. In case of any discrepancy, the measurement of
the trained sonologist will be taken as the ONSD measurement.
When an Ultrasound image of the eye is obtained, the predominant structure is the eye
globe. The globe is an anechoic structure which has an anterior and posterior chamber.
The division of the chambers is by the lens which appears as 2 hyperechoic lines due to
47
Behind the globe the optic nerve can be seen as a hypoechoic strip with bilateral perioptic
hyperechoic periorbital fat on either side of the nerve. Ideally, with the correct imaging
condition, the nerve fibers which is hypoechoic will be seen distinct from the
anechogenic subarachnoid space(34)
The volume of the perioptic CSF space is 0.1 - 0.2 mm3. Studies using gelatin infusion in
the CSF space has shown proportionately larger increase in diameter of the retrobulbar
segment than the posterior part of the nerve, even though anatomically the anterior
diameter of the optic nerve is smaller compared to the posterior part. This has been
attributed to the asymmetrical arachnoid trabecula distribution;(35) the reduced number
of the arachnoid trabeculae in the anterior part of the optic nerve and the nature of the
optic nature such that it is thinnest at the retrobulbar segment. (36)
Figure 2 shows a normal ONSD measurement of one of the study patients. It showed an
ONSD of 0.41 mm which was consistent with normal ONSD. Figure 3 shows an elevated
49
50
51
Measurement of CSF opening pressure:-
The CSF measurement was done independently by the treating team doctors. The CSF
pressure was measured during lumbar puncture in cm of CSF by measuring the column of
the CSF. In order to minimize variations in the value, a uniform approach was done
during lumbar puncture. During lumbar puncture, the CSF column will be measured. The
lumbar puncture was done with the patient in the lateral decubitus position with the legs
and neck flexed onto the chest. A 20 gauge Yale spinal needle was used for the
intrathecal puncture and once the subarachnoid space is entered, the patient was asked to
straighten the legs. The cerebrospinal fluid pressure was measured using an arterial
pressure monitoring line (Vygon) which was connected to the lumbar puncture needle
and the level to which the CSF rises was noted and marked and measured in centimeters.
The meniscus may fluctuate between 2 and 5 mm with the patient's pulse and between 4
and 10 mm with respirations. The patient was advised not to strain, because straining can
increase the opening pressure, and cautioned not to hyperventilate, as hyperventilating
will lower the opening pressure. This was taken as the CSF pressure. This was done by an
independent observer who was part of the treating team of physicians and who was
unaware of the optic nerve sheath diameter. The cutoff for elevated CSF pressure was
52
Correlation with CT/MRI imaging of the brain
For the patients who underwent CT/MRI imaging of the brain, the images were reviewed
by an experienced Radiologist co-investigator independent of clinical data based on the
below criteria to look for signs of raised intracranial tension.
The criteria for diagnosis of raised ICT on CT imaging
(a) Midline shift
(b) Evidence of transtentorial herniation,
(c) Effacement of sulci .
(d) Dilation of basal cisterns
(e) Cerebral oedema
The criteria for diagnosis of raised ICT on MR brain imaging
(a)Tortuosity of the optic nerve.
(b)Flattening of the posterior pole of the optic nerve
(c)Increased CSF perioptic hyperintensity or halo
(d)Evidence of uncal or transtentorial herniation,
53
CT features for ischemic stroke
Hypoattenuation involving one-third or more of the middle cerebral artery (MCA)
territory
Obscuration of the lentiform nucleus
Cortical sulcal effacement
Focal parenchymal hypoattenuation
Loss of the insular ribbon or obscuration of the Sylvian fissure
Hyperattenuation of large vessel (eg, "hyperdense MCA sign")
Loss of gray-white matter differentiation in the basal ganglia
Ischemic Cortical stroke: Patients with stroke with imaging evidence of cortical
infarction
Ischaemic Sub-cortical stroke: Patients with stroke with imaging evidence of
infarction of internal capsule/basal ganglia
Ischaemic brain stem stroke: Patients with clinical evidence of a brain stem stroke
syndrome with or without imaging evidence
Hemorrhagic stroke CT imaging shows hyperacute blood as hyperdense. Over
weeks, the blood will become isodense and may have a ring enhancement
54
Diagnostic criteria for raised intracranial pressure
>250 mm of CSF pressure, or
Imaging evidence of raised intracranial pressure as described.
Sample size calculation
The analysis was divided into the following subgroups:
1. Patients with stroke.
2. Patients with acute CNS infection.
3. Normal controls
Sample Size Calculation:
Single Proportion - Absolute Precision
Expected Proportion Sensitivity or Specificity
of increased Intracranial Pressure 0.9 0.9 0.9
Precision (%) 5 7.5 10
Desired confidence level (1- alpha) % 95 95 95
55
Based on the data of:
Kimberly et al (2008): Sensitivity (88%) and Specificity (93%) for trauma
patients, and
Rajajee et al (2011): Sensitivity (98%) and Specificity (91%) of stroke patients,
it was assumed that the sensitivity and specificity each would be around 90% .
In order to estimate this with the precision of 10%, with 95% CI, we need to study
minimum 35 patients with increased pressure and 35 with normal pressure.
We anticipated that nearly all patients with meningitis will have raised ICP based on CSF
pressure monitoring or imaging features. Of the patients who present with
cerebrovascular accident, 30% were estimated to have intracerebral haemorrhage and
20% were estimated to have cortical ischemic strokes, all of whom might have evidence
of raised ICP on imaging.
Therefore, we decided to recruit 35 cases of CNS infection and stroke each. To obtain 1:5
56
Statistical Methods:
Data was entered in Microscoft Excel software. Data was cleaned using frequency
distribution, Box-Cox plots and Histograms. Though the literature has suggested various
cut off values, we found out the best cut off value using ROC curve with high sensitivity
and reasonable specificity. The Diagnostics test statistics such as Sensitivity, Specificity,
Predictive values and Likelihood ratio statistics with 95% CI was calculated (both
frequentist and Bayesian methods will be used). The Spearman rank correlation was also
calculated to study the strength of correlation. The predictive values will also be
presented for various levels of pre test probabilities such as 5%, 10% and 15% etc.
Demographic variables are presented with frequency and percentages for categorical
variables and with mean and SD for continuous variables. Accuracy of ONSD with the
CT or MRI brain imaging and CSF pressure were assessed by plotting ROC curve and
the clinically meaningful cut-off values for ONSD was computed after checking for its
sensitivity and specificity and were presented with 95% confidence interval. Chi-square
test was used to assess the association of disease conditions in intracranial tension.
Symptoms and signs of intracranial tension were assessed using chi-square test. p-value
of <0.05 is considered to be statistical significant.
The diagnostic test statistics was performed separately in patients with stroke and CNS
infection. Statistical correlation of temporal profile of ONSD (day 0, 4 and 7 days) to
clinical improvement (sensorium, headache and vomiting) was performed in patients with
57
Inclusion of patients
Out of 110132 patients admitted in the year 2014-2015 at Christian Medical College,
7976 patients were admitted under Medicine Department. Of these, 32 patients with
cerebrovascular accident and 31 patients with suspected meningitis/ meningoencephalitis
were enrolled in the study. 59 subjects with no neurological disorder but had been
admitted in the wards for various other reasons were enrolled as the control subjects in
the study. They were seen by the primary investigator and after obtaining the informed
consent, was enrolled as participants in the study. The inclusion into the
meningoencephalitis or the cerebrovascular accident arm was done based on the initial
clinical diagnosis made at the first evaluation of the patients.
Case definitions:
Pyogenic meningitis:- patient presenting with acute onset of fever, with signs and
symptoms of meningeal irritation, with or without altered sensorium, with CSF showing
neutrophilic pleocytosis with elevated protein and decreased glucose with or without
culture being positive
Tuberculous Meningitis:- patient presenting with sub acute history of fever with signs
58
lymphocytic pleocytosis with elevated protein and normal or decreased glucose with or
without culture being positive
Viral meningitis:- patient presenting with acute history of fever with signs of meningeal
irritation, with or without altered sensorium, with or without seizures with CSF showing
lymphocytic pleocytosis with normal protein and normal glucose with culture being
negative, with or without viral polymerase chain reaction being positive
Acute encephalitis:- patient presenting with acute history of fever with signs of
meningeal irritation, with altered sensorium, with CSF showing normal counts with
normal protein and normal glucose with culture being negative
Stroke: Patients presenting with sudden onset focal neurological deficits, including
hemiplegia, hemiparesis, aphasia or cranial nerve involvement with imaging features
diagnostic of thromboembolic or ischemic stroke.
The first measurement of the optic nerve sheath diameter was done within 24 hours of
admission to the ward. A total of 23 patients had the day 4 optic nerve sheath diameters
59
cerebrovascular accidents. In these patients brain imaging and cerebrospinal fluid
analysis (if done) where followed up along with the opening pressure during the lumbar
puncture. These patients were also followed upto the time of discharge to ascertain the
final diagnosis and information on the treatment received.
Strobe figure
Meningoencephalitis arm 34 patients approached
CVA arm
35 patients evaluated
2 withdrew consent 1 missing data 3 patients later withdrew
consent
31 patients were
enrolled in the study
32 patients were
enrolled in the study
5 patients neuroimaging was inconclusive
7 patients neuroimaging was inconclusive
26 patients were included in the final analysis 25 patients were included in
the final analysis 26 patients were included
in the final analysis 3 patients missing data
7 patients neuroimaging was inconclusive
3 patients had missing data.
5 patients neuroimaging was inconclusive
32 patients were
enrolled in the study
25 patients were included in the final analysis
Meningoencephalitis arm 34 patients evaluated
60
Baseline characteristics
Age distribution
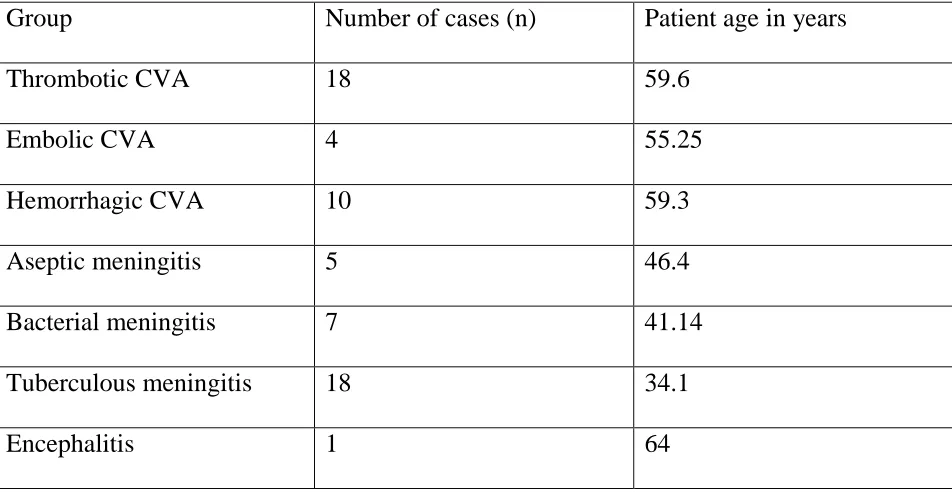
Out of the 63 patients who were enrolled in the study, 32 patients had cerebrovascular
accident. They were subdivided into embolic, hemorrhagic or thrombotic based on the
etiology of the stroke (Table 1) . The mean age in the cerebrovascular group was 59
years. And on subgroup analysis the mean age of thrombotic cerebrovascular accident
group was 59.6 years while the mean age for embolic cerebrovascular accident group was
55.25 years. The mean age for hemorrhagic cerebrovascular accident group was 59.3
years.
Among the 31 patients in the meningoencephalitis group, the mean age was 38.6 years.
Sub group analysis showed the mean age of the patients with aseptic meningitis was 46.4
years, while in the bacterial meningitis group was 41.14 years and in the group of patients
with tuberculous meningitis was 34.1 years. There was only 1 patient with encephalitis
and his age was 64 years. The detailed characteristics is given in Table 1
61
Table 1:- showing average age in years in different subgroups and the number of patients
in each of the subgroups.
Group Number of cases (n) Patient age in years
Thrombotic CVA 18 59.6
Embolic CVA 4 55.25
Hemorrhagic CVA 10 59.3
Aseptic meningitis 5 46.4
Bacterial meningitis 7 41.14
Tuberculous meningitis 18 34.1
Encephalitis 1 64
Gender distribution
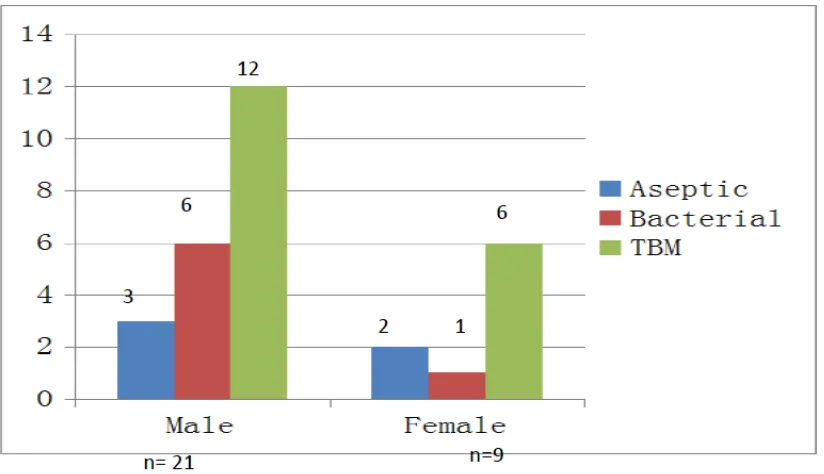
Among the patients with meningitis 21 patients were male and 9 were female among the
meningoencephalitis. There was one male patient with encephalitis. The details are given
in Figure 4.
Among the patients with cerebrovascular accident, 17 patients (53%) were male and 15
62 Figure: 4 GENDER DISTRIBUTION AMONG PATIENTS WITH MENINGITIS
Figure:5 GENDER DISTRIBUTION AMONG PATIENTS WITH
[image:62.612.82.494.110.347.2]63 GENDER DISTRIBUTION AMONG CONTROLS
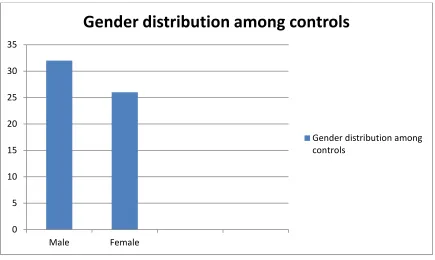
Among the controls there were 32 (55.2%) males and 26 (44.8%) females. This has been
[image:63.612.73.508.219.479.2]shown in Figure 6.
Figure: 6 GENDER DISTRIBUTION AMONG CONTROLS
Admission characteristics and treatment outcome
Among the 31 patients with meningoencephalitis, the clinical symptom profile of the
meningitis patients at admission was recorded. Special attention was paid to symptoms
and signs which correlates with raised intracranial tension. Table 2 shows the symptom
profile of these patients at admission. The majority of the patients had tuberculous
0 5 10 15 20 25 30 35 Male Female
Gender distribution among controls
64
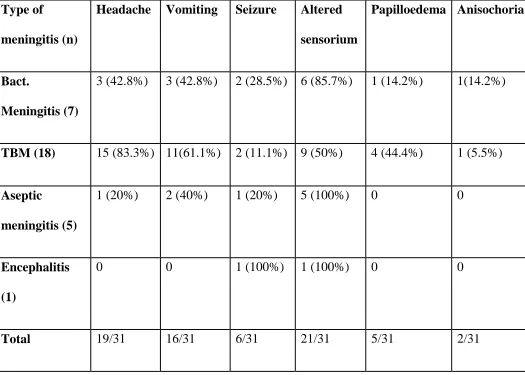
meningitis (18 out of 31). The frequency of headache was higher in TB meningitis (83%)
compared to the acute meningitis (20%) and bacterial meningitis (43.8%). Altered
sensorium was common in patients with acute meningitis like bacterial (85.7%), aseptic
(100%) and encephalitis, while it was present only in 50% of patients with tuberculous
meningitis. This may be due to the rapidity of the process in acute CNS infection leading
to increase in intra-cranial pressure. Similarly the frequency of seizures were higher in
acute meningitis (bacterial meningitis 14.2% and aseptic meningitis 20%) compared to
TBM (11.1%). Papilloedema was more prevalent in tuberculous meningitis (44.4%)
compared to bacterial meningitis (14.2%) and aseptic meningitis (0%) which could be
due to the fact that papilloedema takes time to develop and may not have been present in
the patients with acute meningitis. Anisocoria was present only two cases, one each in
bacterial meningitis and TBM.
Among the 31 patients with meningoencephalitis where follow up data regarding
treatment outcome were available, 21 patients were alive and well at the time of
discharge, there were 5 deaths and 4 were discharged against medical advice. Three of
the deaths were in patients with tuberculous meningitis and one each in aseptic
meningitis and bacterial meningitis. This is shown in Figure 7.
In the Cerebrovascular group, among the 32 patients, 23 patients were alive and well at
the time of discharge and there were 4 deaths and five patients were discharged against
65
in haemorrhagic stroke. Four patients who got discharged against medical advice were in
[image:65.612.71.596.252.627.2]the thrombotic stroke group. The details are shown in Figure 8.
Table 2. Incidence of symptoms against the type of meningitis
Type of
meningitis (n)
Headache Vomiting Seizure Altered
sensorium
Papilloedema Anisochoria
Bact.
Meningitis (7)
3 (42.8%) 3 (42.8%) 2 (28.5%) 6 (85.7%) 1 (14.2%) 1(14.2%)
TBM (18) 15 (83.3%) 11(61.1%) 2 (11.1%) 9 (50%) 4 (44.4%) 1 (5.5%)
Aseptic
meningitis (5)
1 (20%) 2 (40%) 1 (20%) 5 (100%) 0 0
Encephalitis
(1)
0 0 1 (100%) 1 (100%) 0 0
66 Figure 7. Discharge characteristics among meningitis patients
Figure 8. DISCHARGE STATISTICS AMONG PATIENTS WITH
67
Baseline ONSD values
The baseline ONSD values were noted for the different subtypes of meningitis (Table 3).
It showed the higher mean ONSD in patients with tuberculous meningitis of 0,53 mm
which is indicative of the increased prevalence of raised ICT in this subgroup. The mean
ONSD in aseptic meningitis was 0.494 mm and in bacterial meningitis was 0.501 was
higher than the mean among controls (0.45). The values are shown in Table 3.
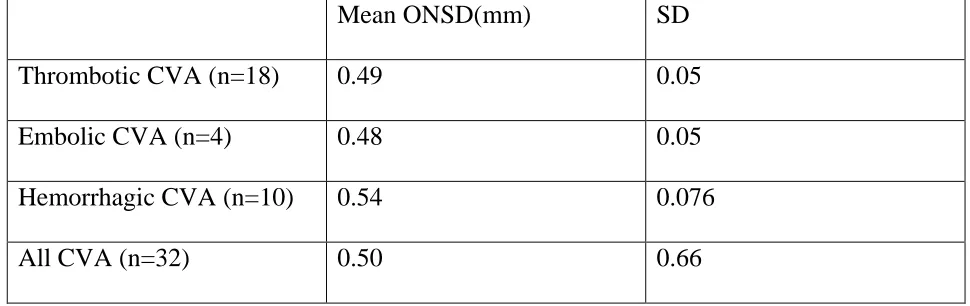
Similarly the mean ONSD was calculated for the CVA subtypes and the hemorrhagic
CVA had the highest value with mean of 0.54, since hemorrhage is most commonly
associated with raised ICT (Table 4). The mean ONSD for thrombotic stroke was 0.49
and embolic stroke was 0.48 was higher than the normal control value.. The values are
given in Table 4.
The mean ONSD for the 58 controls was 0.45 with a SD of 0.05.
68 Table.3 Baseline ONSD values for types of meningitis
Mean ONSD(mm) SD
Aseptic meningitis
(n=5)
0.494mm 0.07
Bacterial meningitis
(n=7)
0.501 0.068
Tuberculous
meningitis (n=18)
0.53 0.062
Encephalitis (n=1) 0.41 -
All meningitis
(n=31)
0.51 0.67
Table.4 Baseline ONSD values for types of CVA
Mean ONSD(mm) SD
Thrombotic CVA (n=18) 0.49 0.05
Embolic CVA (n=4) 0.48 0.05
Hemorrhagic CVA (n=10) 0.54 0.076
[image:68.612.63.548.495.648.2]69
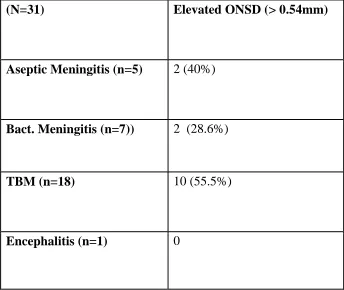
In table 5 the proportion of raised ONSD by the different subtypes of meningitis was
plotted using the cutoff value for elevated ONSD of > 0.54 mm. The rate of raised
intracranial pressure as assessed by ONSD was 55.5% in TBM compared to 40% in
[image:69.612.66.410.242.532.2]aseptic meningitis and 28.6% in bacterial meningitis.
Table.5 Proportion of raised ONSD by meningitis subtypes
(N=31) Elevated ONSD (> 0.54mm)
Aseptic Meningitis (n=5) 2 (40%)
Bact. Meningitis (n=7)) 2 (28.6%)
TBM (n=18) 10 (55.5%)
70
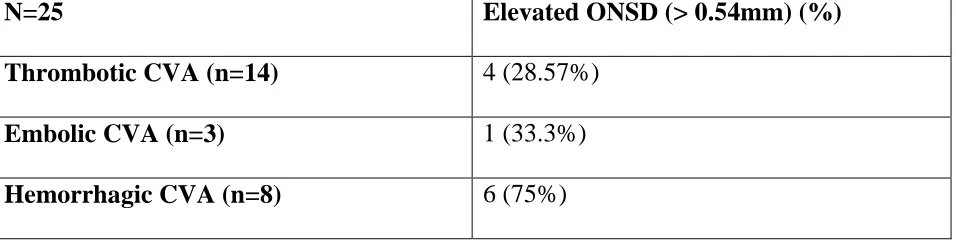
Table 6 shows the prevalence of elevated ONSD as seen in each of the stroke subtypes.
Though thrombotic CVA was by far the commonest, the raised ONSD was more
[image:70.612.70.548.254.375.2]prevalent in hemorrhagic CVA
Table 6 Incidence of raised ONSD by CVA subtypes
N=25 Elevated ONSD (> 0.54mm) (%)
Thrombotic CVA (n=14) 4 (28.57%)
Embolic CVA (n=3) 1 (33.3%)
Hemorrhagic CVA (n=8) 6 (75%)
Evaluation of ONSD as a diagnostic tool
For this study we have taken the cutoff of 0.54mm or more as increased ONSD value,
consistent with raised intracranial tension. CSF pressure of 25cm of CSF or more was
taken as raised intracranial tension. The table 7 shows the comparison of ONSD with
imaging features of raised ICT, either CT or MRI in both patients with stroke and
71
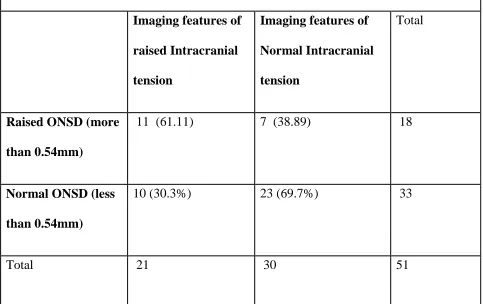
Table.7 ONSD compared with imaging features of raised ICT (N=51)
Imaging features of
raised Intracranial
tension
Imaging features of
Normal Intracranial
tension
Total
Raised ONSD (more
than 0.54mm)
11 (61.11) 7 (38.89) 18
Normal ONSD (less
than 0.54mm)
10 (30.3%) 23 (69.7%) 33
Total 21 30 51
At the cutoff value of 0.54mm we had obtained 52.38% sensitivity and 76.67%
specificity with positive likelihood ratio of 2.24 and negative likelihood ratio of 0.62.The
positive predictive value was 61.1% (95% CI 35.7-82.7) and the negative predictive
value was 51.3% (95% CI 51.3-84.4)
ROC curve comparing ONSD with imaging.The values of optic nerve sheath diameter
and imaging features of raised intracranial tension were put in a 2x2 table. Accuracy of
ONSD with the CT or MRI brain imaging and CSF pressure were assessed by plotting
ROC curve and the clinically meaningful cut-off values for ONSD was computed after
72
interval. The ROC curve had an area of 0.70 which showed reasonable association
[image:72.612.73.541.210.550.2]between ONSD and raised ICT based on imaging. The ROC curve is shown in Figure 9.
Figure.9 ROC curve of ONSD vs raised ICT by CT/MRI imaging of the brain
The detailed report showing the sensitivity, specificity, positive and negative likelihood
ratio of each of the ONSD cutoff values were calculated. These values were plotted on
the ROC curve and show the same significance as explained in Table 4. The detailed
73 Table.8 Detailed report of sensitivity and specificity
---
Correctly
Cutoff Sensitivity Specificity Classified LR+ LR-
---
( >= .41 ) 100.00% 0.00% 41.18% 1.0000
( >= .43 ) 100.00% 10.00% 47.06% 1.1111 0.0000
( >= .44 ) 95.24% 16.67% 49.02% 1.1429 0.2857
( >= .45 ) 90.48% 23.33% 50.98% 1.1801 0.4082
( >= .46 ) 90.48% 30.00% 54.90% 1.2925 0.3175
( >= .47 ) 80.95% 40.00% 56.86% 1.3492 0.4762
( >= .48 ) 76.19% 43.33% 56.86% 1.3445 0.5495
( >= .49 ) 71.43% 43.33% 54.90% 1.2605 0.6593
( >= .5 ) 71.43% 53.33% 60.78% 1.5306 0.5357
( >= .51 ) 66.67% 63.33% 64.71% 1.8182 0.5263
( >= .52 ) 61.90% 66.67% 64.71% 1.8571 0.5714
( >= .53 ) 57.14% 76.67% 68.63% 2.4490 0.5590
( >= .54 ) 52.38% 76.67% 66.67% 2.2449 0.6211
( >= .55 ) 42.86% 80.00% 64.71% 2.1429 0.7143
( >= .56 ) 42.86% 83.33% 66.67% 2.5714 0.6857
( >= .57 ) 38.10% 86.67% 66.67% 2.8571 0.7143
74
( >= .59 ) 28.57% 93.33% 66.67% 4.2857 0.7653
( >= .6 ) 28.57% 96.67% 68.63% 8.5714 0.7389
( >= .61 ) 19.05% 96.67% 64.71% 5.7143 0.8374
( >= .62 ) 14.29% 100.00% 64.71% 0.8571
( >= .66 ) 9.52% 100.00% 62.75% 0.9048
( >= .7 ) 4.76% 100.00% 60.78% 0.9524
( > .7 ) 0.00% 100.00% 58.82% 1.0000
---
Interpretation of ROC curve
The ROC curve can be interpreted as follows:
From 0.7-0.62:- these values of ONSD had a likelihood ratio of infinity and hence they
can be used to rule in raised intracranial tension. Ie. the intracranial tension will be raised
in 100% of the cases.
From 0.61-0.58:- likelihood ratio ranged from 4 to 8
From 0.43-0.39:- these values of ONSD had a likelihood ratio of zero and hence they can
be used to rule out raised intracranial tension. ie. the intracranial tension will be normal
in 100% of the cases.
75
At the ONSD cutoff value of less than 0 .43, the sensitivity was 100.00% and specificity
10.00%.
At an ONSD cutoff value of more than 0.54mm we had obtained 52.38% sensitivity and
76.67% specificity. At cutoff value of > 0.58, the sensitivity was 33.33% and specificity
93.33%.
[image:75.612.68.569.320.535.2]Diagnostic utility of ONSD based on ROC curve
Table.9 Diagnostic utility of ONSD
ONSD Number of
cases (%)
Positive
Likelihood ratio
Interpretation
0.39-0.43 6 (11.7%) 0 Raised ICT can be ruled out
0.44-0.57 36 (70%) 1.1-2.86 Intermediate likelihood
Raised ICT cannot be ruled out
0.58-0.61 6 (11.7%) 4-8 Moderate likelihood of raised ICT
0.7-0.62 3 (5%) Infinity All patients will have raised ICT
In this study, in 15 cases (28.4%) ONSD could provide conclusive information to rule in
(16.7%) or rule out raised intracranial pressure (11.7%). In 36 cases (71.6%) of patients
with ONSD values of 0.44-0.57 ONSD co