SDR 220/2011 29 November 2011
Class Sizes in Primary Schools in Wales: September 2011
This Statistical First Release presents the results of the September 2011 Class Size Count which was carried out in all maintained primary schools in Wales. Local authorities supplied the Welsh Government with details of the registered ordinary classes in primary schools in their authority. This will be the last time that this exercise is carried out in September. From 2013 the data will be collected as part of the annual January PLASC (Pupil Level Annual School Census) collection and published in the summer.
Key Points
Last year the number of infant classes of over 30 pupils (and pupils within such classes) increased; there was a corresponding increase in the number of junior classes of over 30 pupils. The total number of infant and junior classes of over 30 pupils has risen a little over the past 7 years but remains lower than a decade ago when the statutory duties on local authorities in respect of infant class sizes were introduced. Chart 1: Percentage of Infant and Junior pupils in classes over 30
0 5 10 15 20 25 30 35
1999 2000 2001 2002 2003 2004 2005 2006 2007 2008 2009 2010 2011
%
of
pupils
Infant Classes Junior Classes
Infant classes (Key Stage 1) (Tables 1-2)
• 3.8 per cent of pupils (3,882 pupils) were in infant classes of over 30 pupils.
• 122 infant classes (3.0 per cent) in Wales had more than 30 pupils, with 105 of these classes having permissible exceptions. This is more than at September 2010 when 97 classes (2.4 per cent) had over 30 pupils, of which 85 had permissible exceptions.
Junior classes (Key Stage 2) (Tables 4-5)
• 6.6 per cent of pupils (8,175 pupils) were in junior classes of over 30 pupils.
• 257 junior classes (5.1 per cent) in Wales had more than 30 pupils, with 153 of these classes having permissible exceptions. This is more than at September 2010 when 236 classes (4.7 per cent) had over 30 pupils, of which 135 had permissible exceptions.
Contents
Page Infant classes
Table 1 Infant classes, including exception categories, September 2011 and 2010 3
Table 2 Infant classes by year group, September 2011 4
Table 3 Infant classes by year group, September 2010 4
Junior classes
Table 4 Junior classes, including exception categories, September 2011 and 2010 5
Table 5 Junior classes by year group, September 2011 6
Table 6 Junior classes by year group, September 2010 6
Ordinary classes in primary schools
Table 7 Distribution of registered ordinary classes in primary schools in September 7
Table 8 Distribution of pupils in registered ordinary classes in primary schools in
September 7
Table 9 Average class sizes of registered ordinary classes in primary schools in
September 8
Notes 9
Infant Classes
Here are the key points for infant classes:
Pupils
• At September 2011, 3,882 pupils (3.8 per cent) were in infant classes of over 30. This compares with 3,077 pupils (3.1 per cent) at September 2010 and 9,236 pupils (8.6 per cent) at September 1999. • Excluding pupils in classes with permissible exceptions to the class size limit of 30 (see Key Quality
Information) there were 547 pupils (0.5 per cent) in classes of over 30.
Classes
• At September 2011, 122 of the 4,055 infant classes (3.0 per cent) in Wales had more than 30 pupils. This compares with 97 classes (2.4 per cent) at September 2010 and 285 classes (6.4 per cent) at September 1999.
[image:3.595.58.536.372.631.2]• Excluding classes with permissible exceptions to the class size limit of 30 (see Key Quality Information), there were 17 classes with more than 30 pupils. The percentage of classes without excepted pupils has increased from 0.3 per cent in September 2010 to 0.4 per cent in September 2011.
Table 1: Infant classes including exception categories, 2010 and 2011
2010 2011 2010 2011
Up to 20 pupils 845 730 13,173 11,673
21 - 25 pupils 1,134 1,053 26,369 24,620
26 - 30 pupils 1,989 2,150 56,451 61,138
31 - 35 pupils 95 119 2,985 3,764
36 or more pupils 2 3 92 118
Classes over 30:
with pupils admitted due to a statement of SEN 5 8 155 255
with pupils admitted after admission appeal 10 17 319 552
with pupils admitted outside normal admission round 55 61 1,730 1,921 with pupils admitted due to Welsh medium provision 10 17 317 545
with pupils registered at special schools 4 1 124 31
with pupils admitted for a combination of the above reasons 1 2 32 64
Total - with excepted pupils 85 105 2,677 3,335
Total - with and without excepted pupils 0 1 0 33
Total - without excepted pupils 12 16 400 514
Total classes over 30 without permissable exceptions 12 17 400 547
Total 4,065 4,055 99,070 101,313
Percentage of classes with over 30 pupils 2.4 3.0 3.1 3.8
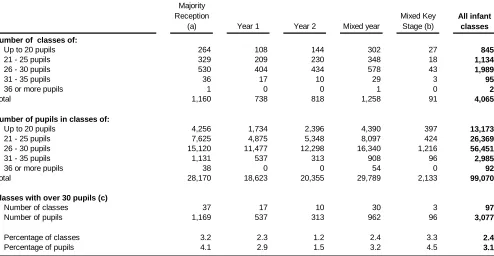
Table 2: Infant classes by year group, 2011
Majority Reception
(a) Year 1 Year 2 Mixed year
Mixed Key Stage (b)
All infant classes
Number of classes of:
Up to 20 pupils 216 97 120 267 30 730
21 - 25 pupils 282 188 221 341 21 1,053
26 - 30 pupils 594 415 445 638 58 2,150
31 - 35 pupils 38 16 26 38 1 119
36 or more pupils 2 1 0 0 0 3
Total 1,132 717 812 1,284 110 4,055
Number of pupils in classes of:
Up to 20 pupils 3,563 1,655 2,047 3,915 493 11,673
21 - 25 pupils 6,565 4,395 5,149 8,020 491 24,620
26 - 30 pupils 16,918 11,906 12,661 17,987 1,666 61,138
31 - 35 pupils 1,203 506 818 1,206 31 3,764
36 or more pupils 78 40 0 0 0 118
Total 28,327 18,502 20,675 31,128 2,681 101,313
Classes with over 30 pupils (c):
Number of classes 40 17 26 38 1 122
Number of pupils 1,281 546 818 1,206 31 3,882
Percentage of classes 3.5 2.4 3.2 3.0 0.9 3.0
Percentage of pupils 4.5 3.0 4.0 3.9 1.2 3.8
(a) Mixed nursery/ reception classes, with majority reception pupils.
(b) Includes mixed Key Stage classes where majority of pupils are Key Stage 1. (c) Of which 105 classes (with 3,335 pupils) were classes with exceptions.
Table 3: Infant classes by year group, 2010
Majority Reception
(a) Year 1 Year 2 Mixed year
Mixed Key Stage (b)
All infant classes
Number of classes of:
Up to 20 pupils 264 108 144 302 27 845
21 - 25 pupils 329 209 230 348 18 1,134
26 - 30 pupils 530 404 434 578 43 1,989
31 - 35 pupils 36 17 10 29 3 95
36 or more pupils 1 0 0 1 0 2
Total 1,160 738 818 1,258 91 4,065
Number of pupils in classes of:
Up to 20 pupils 4,256 1,734 2,396 4,390 397 13,173
21 - 25 pupils 7,625 4,875 5,348 8,097 424 26,369
26 - 30 pupils 15,120 11,477 12,298 16,340 1,216 56,451
31 - 35 pupils 1,131 537 313 908 96 2,985
36 or more pupils 38 0 0 54 0 92
Total 28,170 18,623 20,355 29,789 2,133 99,070
Classes with over 30 pupils (c)
Junior Classes
Here are the key points for junior classes:
Pupils
• At September 2011, 8,175 pupils (6.6 per cent) were in junior classes of over 30. This compares with 7,474 (6.0 per cent) at September 2010 and 45,784 pupils (30.9 per cent) at September 1999.
• Excluding pupils in classes with permissible exceptions to the class size target of 30 (see Key Quality Information), there were 3,330 pupils (2.7 per cent) in classes of over 30.
Classes
• At September 2011, 257 of the 4,994 junior classes (5.1 per cent) in Wales had more than 30 pupils. This compares with 236 classes (4.7 per cent) at September 2010 and 1,398 classes (25.2 per cent) at September 1999.
• Excluding classes with permissible exceptions to the class size target of 30 (see Key Quality
Information), there were 104 classes with more than 30 pupils at September 2011. The percentage of classes without excepted pupils has increased from 2.0 per cent in September 2010 to 2.1 per cent in September 2011.
Table 4: Junior classes including exception categories, 2010 and 2011
2010 2011 2010 2011
Up to 20 pupils 890 857 14,114 14,212
21 - 25 pupils 1,498 1,488 34,907 34,619
26 - 30 pupils 2,414 2,392 68,038 67,485
31 - 35 pupils 234 252 7,397 7,986
36 or more pupils 2 5 77 189
Classes over 30:
with pupils admitted due to a statement of SEN 8 6 249 188
with pupils admitted after admission appeal 14 26 444 817
with pupils admitted outside normal admission round 80 91 2,506 2,876 with pupils admitted due to Welsh medium provision 32 31 1,024 998
or a provision of a religious denomination
with pupils admitted for a combination of the above reasons 1 1 34 32
Total - with excepted pupils 135 153 4,257 4,845
Total - with and without excepted pupils 0 2 0 66
Total - without excepted pupils 101 102 3,217 3,264
Total classes over 30 without permissable exceptions 101 104 3,217 3,330
Total 5,038 4,994 124,533 124,491
Percentage with over 30 pupils 4.7 5.1 6.0 6.6
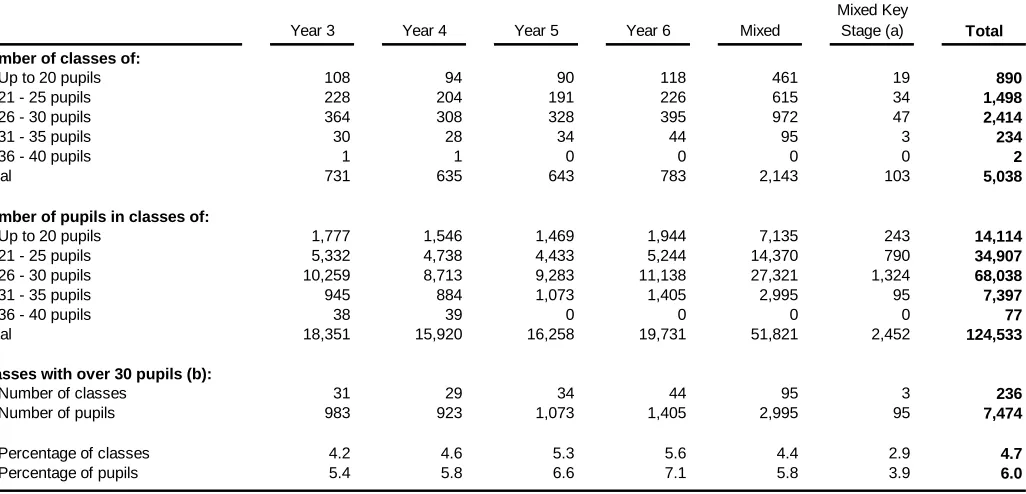
Table 5: Junior classes by year group, 2011
Year 3 Year 4 Year 5 Year 6 Mixed
Mixed Key
Stage (a) Total
Number of classes of:
Up to 20 pupils 104 81 104 107 439 22 857
21 - 25 pupils 250 224 188 235 570 21 1,488
26 - 30 pupils 396 345 334 396 877 44 2,392
31 - 35 pupils 27 23 28 55 117 2 252
36 or more pupils 2 1 2 0 0 0 5
Total 779 674 656 793 2,003 89 4,994
Number of pupils in classes of:
Up to 20 pupils 1,845 1,387 1,826 1,893 6,925 336 14,212
21 - 25 pupils 5,821 5,258 4,371 5,478 13,200 491 34,619
26 - 30 pupils 11,165 9,756 9,387 11,213 24,696 1,268 67,485
31 - 35 pupils 847 729 889 1,749 3,709 63 7,986
36 or more pupils 74 38 77 0 0 0 189
Total 19,752 17,168 16,550 20,333 48,530 2,158 124,491
Classes with over 30 pupils (b):
Number of classes 29 24 30 55 117 2 257
Number of pupils 921 767 966 1,749 3,709 63 8,175
Percentage of classes 3.7 3.6 4.6 6.9 5.8 2.2 5.1
Percentage of pupils 4.7 4.5 5.8 8.6 7.6 2.9 6.6
(a) Mixed Key Stage classes, with majority Key Stage 2 pupils.
(b) Of which 153 classes (with 4,845 pupils) were classes with exceptions.
Table 6: Junior Classes by year group, 2010
Year 3 Year 4 Year 5 Year 6 Mixed
Mixed Key
Stage (a) Total
Number of classes of:
Up to 20 pupils 108 94 90 118 461 19 890
21 - 25 pupils 228 204 191 226 615 34 1,498
26 - 30 pupils 364 308 328 395 972 47 2,414
31 - 35 pupils 30 28 34 44 95 3 234
36 - 40 pupils 1 1 0 0 0 0 2
Total 731 635 643 783 2,143 103 5,038
Number of pupils in classes of:
Up to 20 pupils 1,777 1,546 1,469 1,944 7,135 243 14,114
21 - 25 pupils 5,332 4,738 4,433 5,244 14,370 790 34,907
26 - 30 pupils 10,259 8,713 9,283 11,138 27,321 1,324 68,038
31 - 35 pupils 945 884 1,073 1,405 2,995 95 7,397
36 - 40 pupils 38 39 0 0 0 0 77
Total 18,351 15,920 16,258 19,731 51,821 2,452 124,533
Classes with over 30 pupils (b):
Number of classes 31 29 34 44 95 3 236
Ordinary Classes in Primary Schools
Here are the key points for all ordinary classes in primary schools:
• The average class size for all registered ordinary classes was 25.0 pupils at September 2011, higher than the September 2010 figure of 24.6 pupils.
• At September 2011, 4.4 per cent of all ordinary classes recorded contained more than 30 pupils, an increase from 3.8 per cent at September 2010.
[image:7.595.43.546.253.343.2]• At September 2011, 5.6 per cent of all primary school pupils were registered in classes of over 30 pupils, an increase from 5.0 per cent at September 2010.
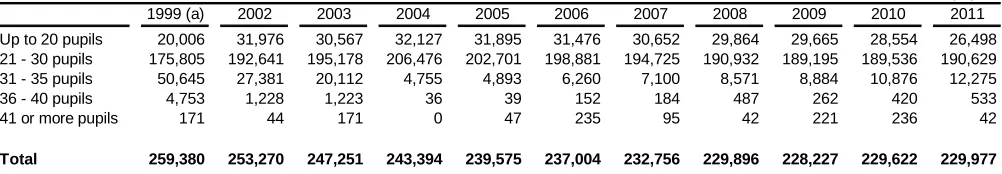
Table 7: Distribution of registered ordinary classes in primary schools in September
14 number of classes 1999 (a) 2002 2003 2004 2005 2006 2007 2008 2009 2010 2011 Up to 20 pupils 1,756 1,964 1,904 1,965 1,947 1,944 1,877 1,828 1,808 1,822 1,628 21 - 30 pupils 6,749 7,417 7,481 7,880 7,700 7,567 7,404 7,263 7,191 7,181 7,187
31 - 35 pupils 1,567 851 626 151 156 198 224 271 281 344 387
36 - 40 pupils 129 33 33 1 1 4 5 13 7 11
41 or more pupils 4 1 4 0 1 5 2 1 5 5 1
Total 10,205 10,266 10,048 9,997 9,805 9,718 9,512 9,376 9,292 9,363 9,217
(a) 1999 data includes mixed nursery/reception classes that were reported and excludes nursery and special classes. Data for all other years include all mixed nursery/reception classes and excludes nursery and special classes.
Table 8: Distribution of pupils in registered ordinary classes in primary schools in September number of pupils 1999 (a) 2002 2003 2004 2005 2006 2007 2008 2009 2010 2011 Up to 20 pupils 20,006 31,976 30,567 32,127 31,895 31,476 30,652 29,864 29,665 28,554 26,498 21 - 30 pupils 175,805 192,641 195,178 206,476 202,701 198,881 194,725 190,932 189,195 189,536 190,629 31 - 35 pupils 50,645 27,381 20,112 4,755 4,893 6,260 7,100 8,571 8,884 10,876 12,275
36 - 40 pupils 4,753 1,228 1,223 36 39 152 184 487 262 420 533
41 or more pupils 171 44 171 0 47 235 95 42 221 236 42
Total 259,380 253,270 247,251 243,394 239,575 237,004 232,756 229,896 228,227 229,622 229,977
[image:7.595.45.546.467.554.2]Table 9: Average class sizes of registered ordinary classes in primary schools in September
1999 (a) 2003 2004 2005 2006 2007 2008 2009 2010 2011
Percentage change 2010- 2011
Reception/Key Stage 1 classes:
Reception 23.5 23.6 23.5 23.5 23.2 23.8 23.9 24.4 24.3 25.0 3.0
Year 1 25.0 25.0 24.6 24.7 24.6 24.6 24.8 25.2 25.2 25.8 2.3
Year 2 25.3 25.4 25.2 25.2 24.6 24.9 24.6 24.8 24.9 25.5 2.3
Mixed year 22.8 22.7 22.4 22.7 22.9 22.7 23.0 23.4 23.7 24.2 2.4
Total 24.0 24.0 23.7 23.8 23.7 23.8 23.9 24.3 24.4 25.0 2.5
Key Stage 2 classes:
Year 3 27.2 25.7 25.5 25.5 25.1 24.9 25.1 24.8 25.1 25.4 1.0
Year 4 27.7 25.9 25.7 25.6 25.8 25.6 25.2 25.4 25.1 25.5 1.6
Year 5 27.6 26.0 25.3 25.6 25.8 25.9 25.8 25.2 25.3 25.2 -0.2
Year 6 27.3 25.8 25.1 25.4 25.6 25.8 26.0 25.6 25.2 25.6 1.8
Mixed year 25.2 24.0 24.0 24.1 24.0 24.3 24.2 24.2 24.2 24.2 0.2
Total 26.7 25.1 24.9 25.0 24.9 25.0 25.0 24.8 24.7 24.9 0.8
22.9 22.9 23.4 23.3 24.3 23.4 24.1 23.1 23.6 24.3 2.9
25.4 24.6 24.3 24.4 24.4 24.5 24.5 24.6 24.6 25.0 1.6
(a) 1999 data includes mixed nursery/reception classes that were reported and excludes nursery and special classes. Data for all other years include all mixed nursery/reception classes and excludes nursery and special classes. Mixed Key Stage
Notes
1. Coverage, content and timeliness
The 2011 September Class Size Count took place on Tuesday 20 September 2011. A copy of the data collection form and accompanying guidance can be found here:
http://wales.gov.uk/topics/statistics/about/data-collection/schools/septembercount/?lang=en All maintained primary schools with pupils on roll at 20 September 2011 have supplied data.
Information at local authority (LA) level is published alongside this release, available to download on the web.
2. Policy / operational context 2.1 Infant classes
The ‘September Class Size Count’ was introduced in September 1999 to collect information on ordinary registered classes to provide information to monitor the Government pledge to reduce infant classes to 30 pupils or fewer by September 2001.
The Schools Standards and Framework Act 1998 and associated regulations placed a statutory duty on local authorities and governing bodies to limit the size of Reception classes to 30 from September 1999; Reception and Year 1 classes from September 2000 and Reception, Year 1 and Year 2 from 2001. Mixed year or mixed Key Stage classes are subject to the limit, where the majority of the class is made up of pupils in the appropriate year groups; this includes mixed nursery/reception classes.
Between September 1998 and August 2001 grants were made available to all 22 local authorities to employ additional teachers and build new classrooms in order to reduce infant class sizes. A commensurate level of funding was then transferred to the Local Government Revenue Settlement.
2.2 Junior classes
The September Class Size Count also collects information on junior classes (classes of 8 to 11 year olds). The Welsh Government set a target to reduce junior classes in line with infant classes by September 2003, with an interim target of no classes of over 35 by September 2002.
Between 2001-02 and 2005-06, special grant funding was paid to local authorities to assist with the reduction of junior class sizes to 30 or fewer in accordance with the Welsh Government's target of
eliminating junior class sizes of more than 30. Since 2006-07, this funding was transferred to the Revenue Support Grant.
3. Exceptions to the Class Size Limit
Both infant and junior classes with one teacher are allowed to have more than 30 children in very specific circumstances. These are called exceptions. Exception categories for infant classes are defined in the Schedule to the Education (Infant Class Sizes) (Wales) Regulations 1998, as amended by the
Education (Infant Class Sizes) (Wales) (Amendment) Regulations 2009. Exception categories for junior classes are not set out in regulations but are enforced as part of the data collection.
A full list of the exception categories for both infant and junior classes can be found here:
http://wales.gov.uk/topics/statistics/about/data-collection/schools/septembercount/?lang=en
Education Statistics outputs, in which we asked for feedback on the quality of the outputs. A summary of responses has been published and is available here:
http://wales.gov.uk/consultations/statistics/education/?lang=en
4.1 Relevance
The statistics are used both within and outside the Welsh Government to monitor educational trends and as a baseline for further analysis of the underlying data. Some of the key users are:
• • • • • • • •
Ministers and the Members Research Service in the National Assembly for Wales; Local authorities;
Wales Audit Office;
The Department for Education and Skills in the Welsh Government; Other areas of the Welsh Government;
The research community;
Students, academics and universities; Individual citizens and private companies.
These statistics are used in a variety of ways. Some examples of these are: • to monitor against infant class size legislation;
• to monitor against junior class size targets; • advice to Ministers;
• to inform the education policy decision-making process in Wales; • contributes to the National Performance Indicators;
• to assist in educational research.
4.2 Accuracy
The Welsh Government works closely with LAs in order to ensure all data are validated before tables are published. Data is collated into an electronic return and submitted to the Welsh Government through DEWi, a secure online data transfer system developed by the Welsh Government.
4.3 Timeliness and Punctuality
DEWi was available for uploading files from September when the forms were sent out, with LAs asked to submit data to include all registered classes (apart from nursery and special classes) in all primary schools in their authority on Tuesday 20 September 2011. LAs were then asked to load their data onto DEWi by 7 October.
Improvements in the data collection method and procedures and considerable effort by colleagues in local authorities and schools have resulted in fewer errors being introduced from inputting the data.
4.4 Accessibility and Clarity
This Statistical First Release is pre-announced and then published on the Statistics section of the Welsh Government website. It is accompanied by more detailed tables at Local Authority level.