www.ncsl.org.uk
RESEARCH
All school leaders
Schools learning from their best
The Within School Variation (WSV) project
Introduction 1
Within School Variation: the extent 2
Within School Variation: the causes 4
Within School Variation: the problems in addressing it 5
The chronology of the project 6
The project results: outcome changes 9
What worked: the project levers 12
Conclusions and policy implications 18
References 22
Appendix One: data sources and methods of analysis 23
Appendix Two: WSV schools 26
The core mantra of educational policy and practice for virtually two decades has been to improve schools. There have been national programmes based on geographical areas (for example, Education Action Zones, Excellence in Cities), programmes across all schools such as the National Primary and Secondary Strategies, and programmes in which individual schools, headteachers and teachers have attempted to improve school organisation and ethos, and to improve student learning and teachers’ teaching, either by self inventing various effectiveness and improvement initiatives, or by bringing ones to their schools that have been taken ‘off the shelf’.
Overall, the effects of all these attempts can be probably judged as disappointing. National standards of education judged by test and examination results have been increasing, but not at a rate to hit the government’s optimistic targets. There remains variation between schools, between teachers within schools, and of course substantial variation between students from different backgrounds, all of which may have been only marginally affected by educational reform.
This report focuses on the results of what is a novel way of improving school quality, in which the system of schools itself learns from its own best people and practices rather than being encouraged to follow central guidance, policy or advice. This project is beyond the focus of much present educational policy on ‘schools helping other schools’ through federations, twinned schools and the use of superheads from one school to turn around whole groups of them, and instead focuses on what an individual school can do to learn from itself. Moving on from ‘school–to-school’, this report focuses on the practicality of a ‘within school’ perspective and associated policies.
Most schools in England have in recent years been made aware of what variation lies within them by a whole range of educational policies that have emerged, related to:
•∑ theprovision of more dataon the academic outcomes of schools, often related to subject sub-divisions within schools;
•∑ theopening up of the classroomto others such as parents, helpers, assistants, other teachers and student teachers, who may now see what goes on inside the educational ‘black box’ in ways that were unusual before;
•∑ theroutine use of classroom observation, pupil voice surveys and indeed much school based in-service education;
•∑ theincreased attention given to the views of educational consumers, such as parents and pupils, who are often very sensitive to variation in their interaction with different teachers within their childrens’ schools.
But it is one thing to recognise that the variation is there, and another thing to use it in ways that could promote educational improvement. Some individual schools have managed this but thus far there has been no route map to tell schools what may work in this area, what may not work and what the foundations are on which school practice could be built.
Over the past two or three decades, variation within schools, rather than between them, has been occasionally remarked on, but only recently has it come into major focus. For example, Fitzgibbon (1985) reported on differences between mathematics departments that were large even after value added estimates were made, and indeed her own philosophy of empowering teachers with quality data had the learning from, and reduction in, within school variation (WSV) at its heart.
However, it took the announcement of the Programme for International Student Assessment (PISA) results, published by the Organisation for Economic Co-operation and Development (OECD), to fully bring this issue into the professional spotlight. In the PISA results, 80 per cent of the variation between the pupils in their achievement lay within schools, fully four times as much as lay between them (20 per cent), a finding that was markedly different to many OECD societies’ results, and which put the UK towards the very top of the WSV table.Some societies, like Germany for example, had a very small amount of variance within schools, with the greater amount laying between them.
Quite what the explanation of the UK performance was is still unclear. In a comprehensive system like that of the UK there are no selective types of schools that, as in Germany, would inflate the ‘between school’ statistics. Perhaps the strong influence of social class in the UK would minimise the effect of school differences, and maximise the effects within a school, any school.
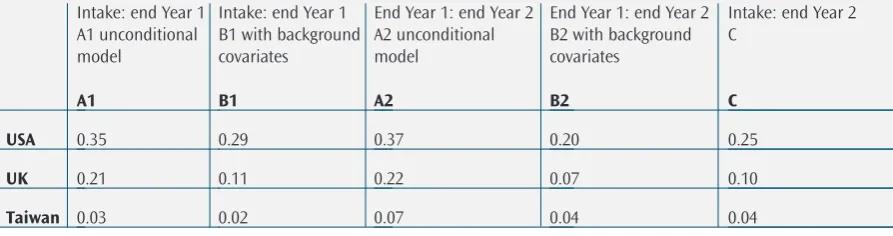
It is also possible that there might be some structural looseness in the UK system by comparison with those of other countries. This unreliability or variability is shown in Table 1 below – compare the variance at school level shown in the column looking at pupils aged 7 intake scores to later scores (marked ‘C’) in the UK, USA and Taiwan for example, which shows that the school ‘level’ in these analyses is more constant and less variable in Taiwan than in the UK and USA.
[image:4.595.127.574.639.757.2]It is also possible that the historic relative autonomy of schools from society, local authorities from state control, schools from local education authorities and teachers/departments from school management control, created a system of multiple autonomies and unreliability that might explain the UK results.
Table 1:Percentages of variance in mathematics achievement to be explained at school level before and after correction for student background variables, for selected countries.Source: Reynolds et al (2002)
Within School Variation: the extent
USA
UK
Taiwan
Intake: end Year 1 A1 unconditional model A1 0.35 0.21 0.03 0.03
Intake: end Year 1 B1 with background covariates
B1
0.29
0.11
0.02
End Year 1: end Year 2 A2 unconditional model A2 0.37 0.22 0.07
End Year 1: end Year 2 B2 with background covariates
B2
0.20
0.07
0.04
Intake: end Year 2 C
C
0.25
0.10
Contemporary data certainly suggest that WSV continues to be large. Using data from the Fischer Family Trust, and looking at the 65–75 per cent of secondary schools where pupils’ progress in Key Stage 3 is roughly in line with national expectations, if one takes six groups of pupils (boys/girls in the three core subjects), then:
•∑ 80 per cent of all schools show value added significantly higher than might be expected for one or more groups;
•∑ over a three-year period 50 per cent of schools have at least one subject in which progress would put them in the top 20 per cent nationally in the subject concerned.
(See Reynolds 2004 for further details.)
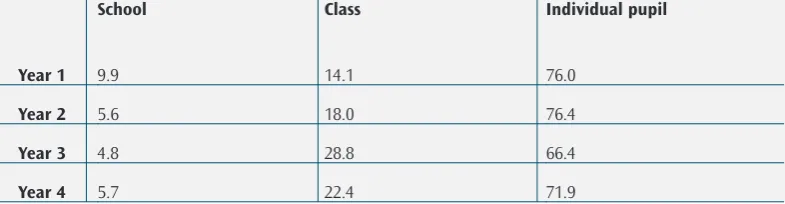
Our own research on primary schools also shows the power of within school factors. Table 1 shows the variance in pupil mathematics scores that is explained by individual background factors (the customary 75–80 per cent) and by educational organisations and processes (in this case a slightly higher 20–30 per cent of total variance than is usually seen in such studies, perhaps explicable by the use of mathematics as the outcome factor, on which educational effects are much higher than reading ability).
[image:5.595.77.470.538.640.2]The class ‘level’ related to the practices of individual teachers explains considerably more variation than the school ‘level’, a very similar picture of WSV to the secondary departmental data(for full data see Reynolds et al in press).
Table 2:Variance at the school, classroom and pupil levels on mathematics achievement.Note: Year above is the year of the study itself.
Year 1
Year 2
Year 3
Year 4
School
9.9
5.6
4.8
5.7
Class
14.1
18.0
28.8
22.4
Individual pupil
76.0
76.4
66.4
The factors responsible for this variation in performance within both primary and secondary schools would seem to be the following:
•∑ individual variation in teacher competence that is not sufficiently reduced by initial training or subsequent continuing professional development (CPD);
•∑ unreliable implementation of national strategies, school improvement programmes and the like in which the gap between the ‘floor’ of less competent teachers and the ‘ceiling’ of more competent teachers widens as the programmes tend to maximise pre-existing variation;
•∑ the effects of recent increased pressures in education leading to enhanced difficulties in ‘coping’ for the less competent teachers, while the more competent ‘thrive on chaos’, generating enhanced differentiation between professionals.
Interestingly, the school effectiveness knowledge base suggests that the schools that are consistent outperformers are intolerant of large negatives, reduce variation in teacher performance and are reliable and consistent. It is more ineffective schools that show the largest range of WSV.
It is also interesting that the school improvement knowledge base suggests that gains vary more within improvement projects than between them, and that schools achieve greater gain by pursuing any project thoroughly rather than by choosing one project over another, the ‘fidelity of implementation’ issue.
Historical barriers to dealing with WSV may be the following:
•∑ Weak school management that finds it hard to confront the issue and to develop mechanisms to learn from best practice.
•∑ False modesty on the part of effective teachers/departments, perhaps associated with a misplaced egalitarianism that does not reward helping other practitioners who are less effective because this would mean marking the less effective out and labelling them.
•∑ Small schools in which the range of excellence between teachers may be less and therefore more difficult to use, and the one/two-person departments that may make performance evaluation by subject a highly personal activity.
•∑ The absence of systems to ‘buddy’ the less good with the better, because of the difficulty of the intense micro-political issues in this area.
•∑ Budget/time constraints that make it difficult to create these skill sharing systems since they require time, space and buy-out of teaching for observation/debriefing etc.
•∑ The difficulty of separating out the personal reasons for some teachers’/departments’ more effective practice from the methods that are being used, since all factors appear confounded with each other.
•∑ The difficulty in secondary schools of getting departments to see any utility in swapping practice when the subject cultures of departments are so strong (For example ‘it is not like that in art!’).
•∑ The practice of using exceptional individuals as the models for others when the exceptional may often be idiosyncratic, and utilising their character as much as any distinctive methods. The exceptional may also be so far in advance of the remainder of the staff in a school that they cannot actually be imitated.
In spite of these difficulties that are inevitable in attempting to learn from WSV, this is exactly what we attempted to do.
WSV emerged as of interest to national educational policy makers in 2001, due to the PISA results noted earlier. David Miliband, Minister for School Standards, asked officials within the Department for Education and Skills (DfES as was) what was known on the subject, and became even more interested when they reported that little work was ongoing.
David Reynolds, interested in WSV because of its links with the unreliability of school organisation that was the opposite side of the coin of high reliability schools, presented the most recent data showing the importance of teacher variation in primary schools from the Gatsby-funded mathematics research and the evidence on secondary WSV, to a number of internal DfES committees.The decision was taken to form a joint project between the DfES (through The Innovation Unit) and the National College for School Leadership (NCSL), overseen by a steering group of DfES and NCSL representation, with David Reynolds in a consultancy role.
The project began with schools that were already working with the NCSL’s Leadership Network, a group of mostly high achieving schools (in raw results terms) and extremely able headteachers who were engaged in high-quality, interactive networking that had created a high-quality network of practitioners. Put simply, the network was helping good schools to get better, although the network itself was attempting to broaden its constituency.
These schools comprised about two thirds of the first group of schools that became known as ‘Phase One’ schools, that ran the project in their school for the school years 2003/04, 2004/05 and 2005/06, although the 2003/04 school year was one of preparation and design for the project rather than action, as we will see later. These schools, however, were joined by a number of others that were in ‘challenging circumstances’, with more disadvantaged intakes and in some but not all cases a history of special measures, fractured leadership, high levels of staff turnover and poor results.
In most cases, these additional schools came into the project based on the arrival of new, mostly highly competent headteachers whose job it was to turn these schools around.
These new heads came into the Leadership Network mostly sponsored by already existing heads, who knew the quality of the new recruits. Others of the Phase Two schools were not in such circumstances.
These two rather different kinds of schools created a ‘bi-polar distribution’ of schools of both excellence and challenge, but on key indicators such as free school meal rates and even on raw pupil results, the schools as a group were very close to the national average for all schools. Phase One secondary schools, for example, had a mean free school meal rate of 21 per cent, compared with a national average of about 18 per cent, and the percentage of pupils gaining 5 or more passes at GCSE grades A*-C was 53 per cent in 2003, exactly the same as the national rate.
Also, whereas the Leadership Network schools were volunteers attracted by an open invitation to all schools in the Network to become involved in the project if they were interested in WSV, and were in many cases already doing WSV-related work, some of the other schools did not appear to be doing much school improvement at all historically, let alone WSV work.
The chronology of the project
The sample of ‘volunteers attracted because they had already started work on WSV’, and ‘schools with no interest in WSV historically but probably possessing a lot of it’, despite again its bipolar nature, was probably not greatly different from the average ‘improvement readiness’, as it were, of the total English school population.
Phase One began with an opening conference in September 2003, and with only halting progress initially. WSV was the new educational ‘kid on the block’, and whereas in such areas as school effectiveness research or school improvement designs more generally, there are bodies of knowledge that exist to guide practitioners and researchers about ‘what works’, in the case of WSV there was no such guide.
There was no alternative but to openly say to schools that the first year of the project, 2003/04, was to be used to ‘let a thousand flowers bloom’, and schools were encouraged to search for ideas, to try things out and, in a phrase, design the WSV project ‘in flight’.
The individual school-based, innovative designs for WSV interventions that were developed soon became a foundation for all schools, as a number of initial project conferences were held (in December 2003 and July 2004) to share emerging ideas about those things which seemed to be working. However, the planning year 2003/04 in general showed:
•∑ a low level of understanding of WSV as a concept, and practically;
•∑ a very slow start in many schools, not unrelated to competing pressures;
•∑ a lack of clarity about exactly what the focus of the interventions should be;
•∑ a confusion of WSV initiatives with general school improvement work, and also an absence of clarity about exactly how these two things might have differed;
•∑ a difficulty in getting into WSV at all, because of, for example, the absence of WSV initiatives in 2003/04 development plans and the pressure of already existing activities that were in the development plans.
Some schools never really recovered from this first year paralysis, an inevitable consequence of letting schools go without a clear route map. In some, WSV was merely an event when in order for it to have an impact it needed to be a programme.
In general, from spring 2004, the pace of the project quickened for the 16 secondary and 9 primary schools, and most schools picked up momentum greatly. This was maintained by national project meetings for all the schools, the exemplary work of the national and regional co-ordinators of the NCSL Leadership Network, and special meetings of regional groups of schools in Summer Term 2004 and 2005, involving in the case of the latter for the first time the Phase Two schools.
The steering group also met three to four times per year in school years 2003/04, 2004/05 and 2005/06, and the NCSL’s research group gave exemplary leadership and support.
The project was further widened in scope in 2005 with the addition of a further 28 Phase Two primary and secondary schools, each to be partnered by one of the Phase One schools that were by autumn 2005 moving into their second action year of the project.
The aim was to ‘double test’ the ideas that would be emerging from Phase One about the factors that worked in reducing WSV and upping pupil achievement, and also to further test whether there were any factors in the nature of the working arrangements between Phase One and Phase Two schools that could be seen as working.
For the new Phase Two and the Phase One schools there were national conferences in school year 2005/06, regional events in spring 2006, continued visits from regional co-ordinators and also the beginning of the activities whereby Phase One brought on Phase Two. Phase One schools formally finished the project with the 2006 public examinations taken in summer 2006 although WSV actions continued. For Phase Two schools, these examination results were their first to be taken while in the project.
There are, of course, many objectives that are given to schools for them to aim for in terms of their pupils’ development. Social outcomes such as positive self-esteem, or economic productivity, are both goals that have been extensively emphasised in recent years, and of course in the Every Child Matters agenda.
However, in this project, we made the academic achievement of pupils the prime focus of our attention for a number of reasons. Academic outcomes were those where we had the best data – across schools in the project – and we were able to compare our schools with the national totality of schools. Academic outcomes are of primary importance in determining the trajectory of children’s lives. And, of course, since we wanted to explore the relevance of WSV for the national educational policy-making agenda, we wanted to focus on what policy makers would pay some attention to, and on what was the focus of national policies.
We therefore commissioned an evaluation of the project’s effects by an outsider with no project connections to obtain a totally unbiased and neutral perspective, although this only began with the summer 2005 examination cycle, and concluded with the summer 2006 results that became available in 2007.
Note that a number of analyses are available:
•∑ for primary schools, progress between Key Stages 1 and 2
•∑ for secondary schools, progress in Key Stage 3
•∑ for secondary schools, progress in Key Stages 2 and 4
•∑ for secondary schools, progress in Key Stages 3 and 4
All these analyses were undertaken on a value added basis, with the gain over time of individual pupils looked at and the existing differences between schools or Years in schools stripped out or controlled for. In all the four groups above, we focus on value added (whether academic outcomes have improved) and WSV (whether there is a reduced variation between subjects in the value added). Put simply, we were interested in excellence (value added) and equity (WSV), and raising the bar of excellence and reducing the range of equity.
The results for Phase One schools in the 2005 data, when they had been participating in the project for one planning year (2003/04) and one action year (2004/05), were disappointing, although given the trajectory shown for other school improvement interventions, not surprising. For the primary schools, 5 out of 10 schools showed an increase in value added (albeit small in most cases), and half showed an increase in WSV, with an overall small positive effect in both cases. For secondary schools, in Key Stage 3 the results were similar, with 7 out of 15 schools showing value added gain and 5 a reduction in WSV.
For Key Stages 3 to 4, a majority (9/14) of schools showed an increase in WSV and half a reduction in value added pupil progress, a disappointing finding. For Key Stages 2 to 4, however, more schools (7/12) showed a reduction in WSV than not, but more also showed a reduction in value added pupil progress (9/12) than not. Again, these findings were disappointing.
Two further analyses were undertaken that had little effect on the overall picture. For Key Stages 3 to 4, an analysis was done that did not measure the mean difference between ‘actual’ and ‘expected’ scores but instead looked at the difference related to the total numbers of pupils taking the subject. For Key Stages 2 to 4, and Key Stage 3 on its own, an analysis was done that looked not at the range between the best and the worst subject scores but at the maximum negative difference from the mean value added score. Neither of these alternative measures made any material difference to the original conclusions.
The 2006 examination data were released in spring 2007 and showed a more promising picture. For the primary schools, looking from 2003 to 2006 about half the schools had shown a decrease in WSV scores and about two thirds an improvement in value added scores. There was little difference between Phase One and Phase Two schools.
For the secondary schools, the results were more encouraging. At Key Stage 3 a large number (8/10) of Phase One schools reduced WSV and half improved value added. For Key Stages 2 to 4,
a large number (8/10) of Phase One schools showed a reduction in WSV between the start and the end of the project, and 6 of the schools showed an increase in value added scores. For Key Stages 3 to 4, 7 out of 12 Phase One schools reduced WSV and 9 out of 12 improved value added. For the Phase Two schools, neither in Key Stages 2 to 4, in Key Stages 3 to 4, nor in Key Stage 3, was there comparable evidence of effect on WSV or value added.
For the data for 2003–06, covering two to three years of the project, we thought it was appropriate to employ limited statistical methods to test out the findings in the datasets. This involved making an estimate of the probability of obtaining the mostly positive results by chance, a standard statistical procedure. The conventional measure that is used to calculate that the result could not have been achieved by chance is a probability of 0.5 or less (the significance level).
If we apply these statistical methods to the data from the secondary schools of Phase One, then we get the following picture:
Key Stage 3
Key Stages 3 to 4
Key Stages 2 to 4
Value added
5/10 not significant
9/12 close to significant
6/10 not significant
WSV
8/10 significant
7/12 not significant
Note that, using the most stringent tests, 2 (and close to 3) changes are statistically significant, in addition to the practically significant and educationally significant scale of the results as expressed in terms of the proportion of schools improving.
Note also that the key or foundational Key Stages 2 to 4 indicator, which most schools focused on and which encompass the Key Stage 3 and Key Stage 3 to 4 indicators, is positive. And note also that for the secondary schools of Phase One, no performance data has ever been negative overall, whereby a majority of a group of schools does worse at the end of the project. The worst result for the schools is for half to improve: the best results are for 75–80 per cent to improve, looking at both value added improvements and reduction in WSV.
Some further analysis was undertaken to see if there was indeed a relationship between the value added and WSV changes. If not, then any improvement in excellence (value added) could not be related to a reduction in difference (WSV), and could therefore clearly not relate to any possible WSV programme effects.
The hypothesis was that there should be a negative relationship between schools’ changes over time in that reducing WSV would be expected to generate increasing value added. The linear correlations are as follows, for the whole sample of primary and secondary schools in both phases, given that it is a whole sample issue:
The pattern of the data across the four age phases strongly suggests that there is a relationship between WSV and value added change and that when there is movement of outcomes it is in the expected direction. The WSV and value added changes are linked, and therefore reducing WSV will be associated with an improvement in value added outcomes.
Key Stage 3
Key Stages 3 to 4
Key Stages 2 to 4
Key Stages 3 to 4
–0.62
0.19
–0.63
These results show a picture that is quite encouraging, even though it might have been somewhat predictable. The primary schools achieved less than the secondaries in terms of increasing value added and reducing WSV, and this may be due to:
•∑ the absence in these schools of building blocks of more than one (unlike departments in secondary schools);
•∑ the consequent conflation of WSV initiatives with individual teachers’ performance and development issues;
•∑ an absence of a focus on subject variation beyond the three core subjects, in marked contrast to the secondary sector who had been publishing (and in some cases evaluating and acting on) multiple subject performance data in the annual reports to parents made compulsory in the Conservative government’s educational reforms of the 1990s;
•∑ an historically liberal educational orientation that preferred to see the staff of a school as a collective group who should not be marked out as different, or variable, from each other;
•∑ the presence of an average staff size (10–15 in most cases) that meant it was difficult to fragment it, or treat it, or analyse it in any differentiated way, unlike a secondary school of on average 70–80 teachers.
But for a particular group of Phase One secondary schools, something had clearly happened to make the project work. Originally it had been intended to rate or rank what each of the schools in this group had achieved on a number of dimensions, such as the particular area of the project they had impacted most on, or the phasing of the initiative in terms of which area of the project they had impacted on first.
But reading of the case study material that had been provided by schools (a three foot high pile!) suggested that differences between schools were less evident than a quite standard use of a technology of reducing WSV and raising value added that applied across all schools. It is with this that we deal here, looking at six areas of activity in these schools.
School ethos and culture
Attention to this was seen as critical across the group of schools, since attempting to do work on WSV that necessarily involved collaboration, within an educational setting that did not foster it, would have been impossible, and possibly educationally dangerous. Schools specifically attempted to:
•∑ start small but quickly scale up by either using one or two departments to start things off, or with one issue across all departments;
•∑ use within school training events to build a coalition for support of the project;
•∑ use re-titling (such as departments becoming ‘attainment teams’) to symbolise change;
What worked: the project levers
•∑ use participation in project events and meetings with other schools in the project to build networks across individual schools that would give esteem to those participating;
•∑ use able, or aspirant, staff in schools as pioneers, given that this would maximise the chance of success;
•∑ use the national scale and potential international significance of the project to motivate participation;
•∑ ensure very full provision of knowledge about the project within schools;
•∑ use off site events that ensured staff were free from the ‘furniture’ of the school, given that WSV is part of any school furniture.
Data usage
The project did provide the group of schools with more data on their academic achievement outcomes in the value added format provided by the Fischer Family Trust, although many schools had been getting these data before. This data went to schools in both spring 2005 and 2006.
Additionally, some schools added further data from indicator systems that they heard of from other schools in the project. However, the great majority of schools sought to improve the use of existing data by more specifically developing it into useful management information that would benefit pupils and the school. This involved:
•∑ encouraging the sharing of data between and within departments, and from any feeder schools;
•∑ developing clarity about what data should be used for;
•∑ monitoring at the point of outcomes, involving sampling pupils’ work;
•∑ using data to build a ‘coalition for change’ in the schools and to build morale through showing improvement;
•∑ using data to track pupils against expectations;
•∑ using data to identify the ‘excellent’ departments (and for that matter ‘the less excellent’) who could be used in whole-school work;
•∑ developing better systems of prediction of grades and performance, identification of grades and underperformance etc;
•∑ analysing data at Year level in addition to cross-Year departmental level, for all Years;
•∑ collecting data on new areas in addition to that of academic achievement, such as pupil attitudes and valuing qualitative as well as quantitative data;
•∑ more informed use of existing national data sources;
Teaching and learning
The focus of the project on a level closer to the classroom than that of the school clearly encouraged a focus on teaching and learning issues in these schools. This was shown in:
•∑ the development of high-quality observational systems, used by peers with peers, that gathered high-quality data on teaching behaviours, pupil behaviours, classroom processes, learning and the climate in different classrooms;
•∑ encouraging pupils to feed back their opinions on their own learning-related issues as well as on their teaching;
•∑ attempting to specify within and across subjects what might be the core classroom-related teacher behaviours;
•∑ encouraging discussion of teaching in departments and across the school;
•∑ attempting to enrich teaching through the use of new curriculum developments;
•∑ attempting greater consistency in teaching behaviours and especially in the expectations of pupils, within and across departments;
•∑ encouraging, using effective ‘lead’ departments, the use of novel methods of teaching and learning;
•∑ encouragement of a common language for the description of teaching and learning across departments;
•∑ developing academic tutoring within pastoral teams.
Middle management training
Virtually every one of these secondary schools launched initiatives with their departmental heads. In most schools, these roles had been historically poorly resourced and indeed sometimes regarded as an infliction on the people holding them rather than as a management tier offering an opportunity for personal and professional development. These initiatives were specifically:
•∑ changing philosophy from being purely middle managers to being middle leaders;
•∑ training of middle managers, particularly in areas such as coaching/mentoring, data usage, classroom observation etc, not just using exceptional individuals as models but using all middle managers on the sound basis that all had learned one good piece of professional practice to share;
•∑ ‘buddying’ or ‘matching’ of middle managers with others specially chosen to permit transfer of skills, attitudes and behaviours rapidly;
•∑ using key personnel – heads of department respected by the wider staff group – to start the ball rolling;
•∑ extending the focus to heads of Year, or heads of house, and ensuring the same programmes were created for them as for heads of department;
•∑ disaggregating data to subject level to permit fine-grained analysis;
•∑ inspection of pupil performance and its variation across subjects.
Pupil voice
The involvement of pupils in furnishing data on learning in these schools is a further example of what happens when the lever of the department, or the individual teacher, or the pastoral /tutoring team is being addressed rather than that of the school, given the closeness of these levers to teaching and learning. Specific initiatives involved:
•∑ greater involvement of pupils in planning for their future achievement;
•∑ pupil-based surveys of learning styles;
•∑ pupil-based surveys of teaching.
Standard operating procedures
As schools explored the variation in their gains across different departments and years shown by their use of data systems, and attempted to focus on training of middle managers and their departments, many of them moved towards tighter specification of systems, procedures and responses to pupil needs in an attempt to iron out WSV.
The experience of the work on data that most schools began with was that there was huge variation in what was regarded as the normal procedures in what happened to the data, what was meant by data-related words and indeed what ‘data’ was. Most schools used in-service sessions, based on a cascade from the departments or parts of the pastoral structure that were exemplary in their use of data, to ensure that there was reliability and consistency in these issues, and most schools gained remarkable improvements, with limited efforts and limited time. This encouraged a broader focus on other areas:
•∑ on ensuring all departments and Year teams had consistency in other areas in their expectations and procedures;
•∑ reducing the isolation of staff by promoting team approaches and networking;
The process of change
The description of the levers of change that the successful Phase One secondary schools
employed should not delude us into thinking that getting these levers in place was unproblematic. The process of change is complex, more so within today’s schools than at any other time in educational history because of the speed of technological change and the historic absence of any proven principles of managing educational change other than the simple. Our group of schools varied – rightly – in how they handled change in accordance with their own culture, context and catchment area.
But a number of clear principles of how to handle change in the complex, potentially fraught and delicate area of WSV were clear:
•∑ The introduction of WSV-related change requires a systematic audit of individual school’s presenting cultures, organisational factors, past attempts (if any) to deal with the issue and indeed the present scale of WSV itself.
•∑ Change should be contextually specific to each school, who will each have their own entry points into the WSV area and issues. These could be micro (the issue of variation in coursework marking standards, say) or macro (departmental/academic Year variation in pupil outcomes), according to context.
•∑ The core issue in managing change is to hold on to the necessary collegiality which is needed to collaboratively generate change, while at the same time recognising the variation within schools by individuals and departments that is necessary to generate professional learning.
•∑ Holding on to that collegiality, and maintaining enthusiasm for WSV activities, is best shown when existing training days and resources are utilised, rather than the imposition of an additional burden through special, additional sessions. Besides, the argument that WSV, and reducing it, is a core mainstream issue can only be sustained if the training activities related to it are themselves mainstreamed rather than bolted on.
•∑ Change may be bitty, messy and chaotic at first, and progress will come in bursts and fits and starts, but the vision of learning from WSV and not being afraid of it needs to be held on to. Only headteachers, and to an extent, middle management leadership, can do that.
•∑ Clarity about what change related to WSV means is essential to avoid WSV-related issues being seen as part of general school improvement activities, when in fact, they are anything but.
•∑ While each school is different, there is much sense in beginning the WSV work by ensuring that data about WSV, of the highest quality, is available to begin the professional conversation within schools, and to identify the sources of strength to be benchmarked against.
•∑ Relatedly, WSV needs to be seen as a programme of interacting factors and not a series of unconnected one-offs. This necessitates more than badging and labelling of activities to get professional support and understanding, and requires a level of conceptual understanding within the senior management of schools getting in to WSV.
•∑ School underachievement may be the peg on which WSV can be hung in many schools but in schools which are already overachieving, then other hooks (accelerated learning, for example) may be needed.
•∑ Schools are likely to need multiple sources of support from external agencies (other schools, Higher Education, local authorities) to enable WSV initiatives to take place successfully, given their novelty.
Overall, much was learned within the WSV Project that could act as a foundation for further work in this area. We now have a toolkit of successful approaches to learning from WSV that could be used by all schools. It is important that the work of the primary schools in the project is better understood and that the experience of Phase Two schools is also charted in detail so that knowledge can be further advanced as these schools participate for as long as Phase One schools did. It is also important that wide dissemination of our results is undertaken to a number of constituencies:
•∑ to policy makers, who will be interested in the relevance of WSV work to the personalisation agenda, itself disaggregating pupils’ within school experience substantially;
•∑ to practitioners, who will be interested in the examples of practices that appear to be associated with raising the bar and reducing the range.
In conclusion, what we have found was that across all our schools any reduction in WSV
is linked with an improvement in value added, so schools embarking on the journey of reducing WSV can be certain that it will be productive on results.
We also found a group of secondary schools who, in three years, had developed approaches which, judged by their data viewed overall, were impacting on value added and WSV successfully. For a group of schools resourced by only additional resources of £1,500 per school per year, on top of whatever they and the Leadership Network were able to contribute in time and in kind as it were, this was an extraordinarily valuable achievement, of national and international significance.
The ‘micro-level’ educational policy implications of the work are important for practice in that:
•∑ While it might not be possible to have policies for what happens in individual classrooms, this might be feasible at the subject departmental level or academic Year level in a secondary school or the Year level in a primary school. Targeting these means that policy can get far closer to what ought to be the real focus, the classroom level, than if it only addresses the school level.
•∑ While not every school is effective, all schools will have within themselves some practice that is relatively more effective than elsewhere in the school. Every school can therefore look for generally applicable good practice from within its own internal conditions.
•∑ It might well be that one limitation to whole-school self-evaluation and improvement is that headteachers are often overloaded, because of having to deal with problems that should fall to middle managers and so lack the time to think strategically. Targeting sub-groups within the school could get round that.
•∑ Within-school units of policy intervention such as Years or subjects are smaller and, therefore, potentially more open to being changed than those at whole-school level.
Conclusions and policy implications
•∑ Teachers in general, and those teachers in less effective schools in particular, seem to be more influenced by classroom-based policies that are close to their focal concerns of teaching and curriculum and less by policies that are managerial and orientated to the school level.
•∑ The WSV Project hopefully moves us closer to a world where no school needs to wait for another school to help it out, since it can help itself by looking at its own best people and learn from them. This world is one where a school’s departments and teachers cannot use excuses such as “it’s the pupils” for their performance, since they have generally the same pupils. This world is one where excellence is regarded not as something to be hidden, but something to be learned from, for the benefit of all. This world could be attained, quickly.
•∑ More generally, the work on WSV has ‘macro-level’ implications for both educational policies and for public policy reform. In the case of educational policies, the past decades have seen a number of attempts to improve schools through different kinds of programmes. Firstly, there was the influence of the school effectiveness movement in the 1990s, which provided to practitioners in schools the famous checklists of eight, ten, fifteen or twenty things that the effective or high added value schools do, from having effective management to generating a climate of high expectations.
•∑ This phase, although useful, had a number of limitations, however. It was based on giving schools, from outside as it were, ideas about what to do and there was subsequently no ‘ownership’ by the school and its teachers. And as more and more schools now do what the knowledge suggests they should be doing – from ensuring the entrance hall displays the details of the languages spoken in the school to ensuring that there are formal organisational structures to involve parents – the prospects of any future return on further concern with these issues is limited.
•∑ The next two phases of educational reform were also limited in their effectiveness. The specification of what schools should be doing by the state – in the prescriptive practices outlined in the Literacy, Numeracy and Secondary Strategies – gives perhaps a short-term boost to teaching skills and test scores, but does not provide for the long-term development of the profession. The use of school-to-school methods is likewise probably not in the long term hugely powerful – schools can be geographically far apart, are often psychologically distant from each other, with different cultures, and often used to employing excuses as to why they should not take up the methods of operation of the school down the road (“they would say that with their catchment area wouldn’t they!”).
•∑ Likewise, the potential for networking between schools, school federations and the like is probably difficult to deliver if schools are competing against each other in educational markets.
•∑ However, no one would suggest that school-to-school is not useful. At the level of subject specialisms, contact between departments in the same subject in different schools can be really powerful, indeed sometimes transformative. And there are many examples of schools picking up useful ideas they would not have thought of themselves from their
•∑ WSV is very much the ‘new kid on the block’ that may, or may not, develop into producing its own ‘phase’. Perhaps it might be sensible to propose a continuation of school-to-school to give subject support in secondary schools at the same time as schools start investigating their own conditions internally. Perhaps there isa case for differentiated models whereby some schools begin with WSV, some with school-to-school collaboration and some do both at onceright from the start, the precise mix and phasing to depend on the particular state that individual schools are at.
•∑ At the very least, it would be sensible to see if WSV might, with profit, influence national publication of information on schools’ results, with perhaps a dispersal or range measure being introduced alongside the customary measures, which would be applied to the GCSE three core subjects and at other stages as appropriate. Further promotion of WSV activities could move beyond this, to generation of toolkits to enable schools to focus on the issues, and learn constructively.
•∑ More generally, there may be lessons from the WSV Project for the direction of public sector reform. This has involved a focus on trying to improve service delivery through improved pre-service, initial training across many professions, but has been less sure-footed when it comes to maximising knowledge transfer of good practice subsequently.
•∑ Organisation-to-organisation transfer is thought to have been maximised by varying the external contingencies within which state welfare works, as with the use of the private sector to lever up standards in the public sector, or the use of performance information and public choice to expose poor performance.
•∑ Yet while such policies may encourage welfare organisations and professionals to work harder, they may not generate smarter working unless the people and organisations have more effective ‘technologies of practice’, as it were, on which to draw. Getting these to move between schools, or hospitals, or prisons when all organisations have relatively
impermeable cultures, boundaries and defences is the problem.
•∑ It involves charting the views of consumers directly, gathered at the point of service delivery. And finally, it involves attempting to use the naturally occurring variation that exists within organisations for the benefit of the organisation’s effectiveness by not sweeping it under the carpet, butby creating an engine of improvement that operates independently of outside organisations.
Fitzgibbon, C, 1985,A-level results in comprehensive schools: ‘the COOMBSE Project,’ Year One, Oxford Review of Education, 11 CD: 43–58.
Reynolds, D, Creemers, B P M, Stringfield, S, Teddlie, C, and Schaffer, G, eds, 2002,World Class Schools: International Perspectives on School Effectiveness, London, Routledge/Falmer.
Reynolds, D, 2004,Within-school variation: its extent and causes, A background paper for DfES, presented to the National Within School Variation Conference, July (can be viewed at
www.highreliabilityschools.com; click on ‘Within School Variation’).
Reynolds, D, Muijs, D and Park, J, in press, Educational Effectiveness: Pupils, Schools, Programmes and Policiescan be viewed atwww.highreliabilityschools.com; click on ‘Bodies of Knowledge’ then ‘Brand New Research’ then ‘Chapter Six’.
Description of WSV measure
The basic principle was to determine the difference between the average progress made by pupils in the most successful subject and the average progress made by pupils in the least successful subject within a school.The term ‘success’ in this instance is used to describe how well pupils achieve compared to how well they would be expected to achieve; it is used to describe the ‘value added’ within a subject. Hence, a subject within which weak pupils progress well compared to their expectations would constitute a successful subject. However, a subject within which able pupils progress poorly compared to their expectations would constitute a less successful subject.
It is perfectly feasible for a school to improve over time by improving the progress made by its pupils, while at the same time the difference between the success rates of subjects could remain static or even increase.The purpose of a WSV measure is to provide an indicator of these differences.A school that is judged to be performing well, but that has a large WSV, could inherently improve its performance further by improving its less successful subjects.
Key Stage 2 details
At Key Stage 2 national test results are only available for the core subjects English, mathematics and science. The Fischer Family Trust provide estimates of levels (‘fine grade’ levels) for each of these subjects together with reading and writing based on prior attainment, pupil age and gender, and a number of contextual factors. This is the Fischer Family Trust ‘school extended’ model. They also provide ‘fine grade’ levels based on actual individual test scores. In this analysis, individual progress is measured as the difference between the actual fine grade and the school extended fine grade expectation. A pupil making expected progress would have a value added score of zero. A pupil making better than expected progress would have a positive value added score, whereas a pupil making less than expected progress would have a negative value added score. The average value added score for a subject within a school is the average of these pupil value added scores for the subject. Hence a successful subject would have a positive value added score.
The WSV measure at Key Stage 2 is simply the difference between the highest and lowest value added scores for English, mathematics, science, reading and writing.
Key Stage 3 details
A pupil making better than expected progress would have a positive value added score, whereas a pupil making less than expected progress would have a negative value added score. The average value added score for a subject within a school is the average of these pupil value added scores for the subject. Hence a successful subject would have a positive value added score.
The WSV measure at Key Stage 3 is simply the difference between the highest and lowest value added scores for English, mathematics and science.
Key Stage 4 details
The situation at Key Stage 4 is somewhat more complex since many subjects are studied. The National Consortium for Examinations Results (NCER) provide value added data for progress from average Key Stage 3 points score to GCSE grade in many subjects. These are single national lines taking no account of gender, pupil age or any contextual factors. However, prior attainment is by far the most important single indicator of likely future performance and the NCER value added data have formed the basis of the Key Stage 4 analysis.
The actual attainment of a pupil in a subject is the grade achieved converted into a points score using the Section 96 points score definitions. The expectation in a subject has been taken as the median score nationally for pupils starting with the same Key Stage 3 points score as provided by NCER. The individual pupil value added score in a subject is the difference between the actual and expected attainment. The school value added score for a subject is the average of the individual pupil scores in that subject.
There are two significant issues associated with this approach. Firstly, NCER do not provide value added data for all subjects at Key Stage 4. In many cases, a sensible equivalent can be substituted, for example, performance studies can be substituted for drama. However, it is often not possible to make a substitution. For example, which subject national data should be substituted for Russian? Secondly, the cohort size for subjects at Key Stage 4 within a school varies enormously. It is possible that the value added score for small cohorts could be heavily influenced by one or two pupils. Subjects matching either of these criteria within a school have been discounted when determining the WSV measure.
The WSV measure for Key Stages 3 to 4 has been taken as the difference between the highest and lowest value added scores after discounting small cohorts (less than 10 pupils) and subjects for which there is no equivalent national data. Quite often subjects are discounted as a result of both factors mentioned.
There is also the possibility of looking at variation between Key Stages 2 and 4. However, NCER only provide national lines for the core subjects of English, mathematics and science. The science national line is an averaged science score.
The same process can be performed as from Key Stages 3 to 4, but only outcomes in the core subjects can be included in the WSV measure. Science is slightly complicated in that several subjects are often taken at Key Stage 4. The only science subjects considered were double science, single science, biology, chemistry and physics. Value added scores for these subjects were ignored if the cohort was small.
Comparative data
For comparison purposes, the improvement in pupil performance of the schools was also determined.
At Key Stages 2 and 3 the measure of pupil performance across a school was taken as the average of the value added scores for English, mathematics and science. The increase in this measure over time is then a measure of the improvement of a school.
At Key Stage 4, various measures could be used to determine pupil performance. Since the progress made by pupils in each subject was determined from the supplied NCER data it was decided to use the NCER data that matched individual capped total point scores to Key Stages 2 and 3 results as the performance measure.
Parkview Primary School Springwood Drive, Oakwood, Derby Derbyshire DE21 2RQ 01332 835439 LA: Derby Manorfields Primary School Penningtons Bishops Stortford Hertfordshire CM23 4LE 01279 757193 LA: Hertford
Lent Rise Primary School Coulson Way Burnham, Slough Berkshire SL1 7NP 01628 662913 LA: Buckinghamshire Christ Church Primary School
1 Robinson Street Chelsea, London SW3 4AA 020 7352 5708 LA: Kensington and Chelsea Mortimer Primary School Mortimer Road South Shields Tyne and Wear NE34 ORW 0191 4554504 LA: South Tyneside
Pownall Green School
Bramhall Lane South, Bramhall Stockport Cheshire SK7 2EB 0161 4391105 LA: Stockport
St Vincents Catholic Primary School
Finlay Avenue, Penketh Warrington Cheshire WA5 2PN 01925 726544 LA: Warrington Southway Primary School Bampflyde Way, Southway Plymouth Devon PL6 6SR 01752 706360 LA: Plymouth Hatfield Primary School
Hatfield House Lane Sheffield
South Yorkshire S5 6HY 0114 2456871 LA: Sheffield
Appendix Two: WSV schools – Phase One
Biddenham Upper School Biddenham Turn Bedford Bedfordshire MK40 4AZ 01234 342521 LA: Bedfordshire
King Edward VII School Burton Road Melton Mowbray Leicestershire LE13 1DR 01664 851010 LA: Leicestershire
Jack Hunt School
Ledbury Road Peterborough Cambridgeshire PE3 9PN 01733 263526
LA: City of Peterborough
Grangefield School
Oxbridge Avenue Stockton on Tees Teesside TS18 4LE 01642 353637 LA: Leeds Houghton Kepier School Dairy Lane
Houghton le Spring Tyne and Wear DH4 5BH 0191 5536528 LA: Sunderland Fallibroome High School Priory Lane Macclesfield Cheshire SK10 4AF 01625 827898 LA: Cheshire Kingsbridge College Balkwill Road Kingsbridge Devon TQ7 1PL 01548 852641 LA: Devon
Norton Hill School
Chorlton Road
Midsomer Norton, Avon BA3 4AD
01761 412557
LA: Bath and North East Somerset South Dartmoor Community College Balland Lane Ashburton, Devon TQ13 7EW 01364 652230 LA: Devon
Hillcrest School and Community College Simms Lane Netherton, Dudley West Midlands DY2 0PB 01384 816500 LA: Dudley Lawrence Sheriff School Clifton Road Rugby Warwickshire CV21 3AG 01788 542074 LA: Warwickshire Brighouse High School Finkil Street Brighouse West Yorkshire HD6 2NV 01484 710408 LA: Calderdale Thomas Sumpter School Chandos Road Scunthorpe North Lincolnshire DN17 1HA 01724 868666 LA: North Lincolnshire
Frederick Gough School
Grange Lane South Bottesford, Scunthorpe Lincolnshire
DN16 3NG 01724 860151 LA: North Lincolnshire
Bishopsford Community School Lilleshall Road Morden London SM4 6DU 0208 6871157 LA: Merton
West Oaks School
Lansbury Lawrence Primary School
Cordelia Street London E124 6DZ 020 7987 4589 LA: Tower Hamlets
St Aloysius RC Voluntary Aided
Junior School
Argyle Street, Hebburn Tyne and Wear NE31 1BQ 0191 4832274 LA: South Tyneside
Mablins Lane Primary
School Mablins Lane Crewe Cheshire CW1 3YR 01270 580437 LA: Cheshire Oughtrington Primary School Howard Avenue Lymm Cheshire WA13 9EH 01925 752086 LA: Warrington Thornbury Primary School Miller Way Plymouth Devon PL6 8UL 01752 302600 LA: Plymouth
Green Acres School
Keresforth Hill Road Barnsley South Yorkshire S70 6RG 01226 287165 LA: Barnsley Prince Edward Primary School
747 City Road Sheffield South Yorkshire S12 2AA 0114 2281900 LA: Sheffield Cranford Park Primary School
Harlinton, Phelps Way Middlesex
B3 4LQ 0208 5733453 LA: Hillingdon
The Arnewood School
Gore Road New Milton Hampshire BH25 6RS 01425 625405 LA: Hampshire Chenderit School Archery Road Middelton Cheney Banbury Oxfordshire OX17 2QR 01295 711567 LA: Northamptonshire George Spencer School
Arthur Mee Road Stapleford, Nottingham Nottinghamshire NG9 7EW 0115 9170100 LA: Nottinghamshire Birchwood High School Parsonage Lane Bishops Stortford Hertfordshire CM23 5BD 01279 655936 LA: Hertfordshire
Denbigh High School
Alexandra Avenue Luton Bedfordshire LU3 1HE 01582 736611 LA: Luton Highfield School Highfield
Letchworth Garden City Hertfordshire SG6 3QA 01462 620500 LA: Hertfordshire Walton Community School Mountsteven Avenue Peterborough Cambridgeshire PE4 6HX 01733 772501 LA: Peterborough George Mitchell School Farmer Road Leyton London E10N 5DN 020 8539 6198 LA: Waltham Forest
Washington School
Spout Lane Washington Tyne and Wear NE37 2AA 0191 4160000 LA: Sunderland Allertonshire School Brompton Road Northallerton North Yorkshire DL6 1ED 01609 772888 LA: North Yorkshire
Appendix Two: WSV schools – Phase Two
Henbury High School Whirley Road Macclesfield Cheshire SK10 3JP 01625 422115 LA: Cheshire Coombeshead School Coombeshead Road Newton Abbott Devon TQ12 1PT 01626 201800 LA: Devon Somervale School Redfield Road Midsomer Norton Radstock , Avon BA3 2JH 01761 414276
LA: Bath and North East Somerset Teignmouth Community College Exeter Road Teignmouth Devon TQ14 9HZ 01626 774091 LA: Devon Old Swinford Hospital School Heath Lane
Old Swinford, Stourbridge West Midlands
DY8 1QX 01384 817300 LA: Dudley
Stratford High School
Alcester Road Stratford upon Avon Warwickshire CV37 9DH 01789 268051 LA: Stratford Thorns Community College Stockwell Avenue Brierley Hill West Midlands DY5 2NU 01384 816225 LA: Dudley Hipperholme and Lightcliffe School Stoney Lane Hipperholme, Halifax West Yorkshire HX3 8TL 01422 201028 LA: Calderdale North Axholme School
Wharf Road, Crowle Scunthorpe North Lincolnshire DN17 4HU 01724 710368 LA: North Lincolnshire
Tong School Westgate Hill Tong Street West Yorkshire BD4 6NR 01274 681455 LA: Bradford Northallerton College
W: www.ncsl.org.uk