RESEARCH
Longitudinal study of DNA methylation
during the first 5 years of life
Rocio G. Urdinguio
1,4, María Isabel Torró
2,3, Gustavo F. Bayón
1, Julio Álvarez‑Pitti
2,3, Agustín F. Fernández
1,
Pau Redon
2,3, Mario F. Fraga
1,4*and Empar Lurbe
2,3*Abstract
Background: Early life epigenetic programming influences adult health outcomes. Moreover, DNA methylation levels have been found to change more rapidly during the first years of life. Our aim was the identification and char‑ acterization of the CpG sites that are modified with time during the first years of life. We hypothesize that these DNA methylation changes would lead to the detection of genes that might be epigenetically modulated by environmental factors during early childhood and which, if disturbed, might contribute to susceptibility to diseases later in life. Methods: The study of the DNA methylation pattern of 485577 CpG sites was performed on 30 blood samples from 15 subjects, collected both at birth and at 5 years old, using Illumina® Infinium 450 k array. To identify differentially methylated CpG (dmCpG) sites, the methylation status of each probe was examined using linear models and the Empirical Bayes Moderated t test implemented in the limma package of R/Bioconductor. Surogate variable analysis was used to account for batch effects.
Results: DNA methylation levels significantly changed from birth to 5 years of age in 6641 CpG sites. Of these, 36.79 % were hypermethylated and were associated with genes related mainly to developmental ontology terms, while 63.21 % were hypomethylated probes and associated with genes related to immune function.
Conclusions: Our results suggest that DNA methylation alterations with age during the first years of life might play a significant role in development and the regulation of leukocyte‑specific functions. This supports the idea that blood leukocytes experience genome remodeling related to their interaction with environmental factors, underlining the importance of environmental exposures during the first years of life and suggesting that new strategies should be take into consideration for disease prevention.
© 2016 The Author(s). This article is distributed under the terms of the Creative Commons Attribution 4.0 International License (http://creativecommons.org/licenses/by/4.0/), which permits unrestricted use, distribution, and reproduction in any medium, provided you give appropriate credit to the original author(s) and the source, provide a link to the Creative Commons license, and indicate if changes were made. The Creative Commons Public Domain Dedication waiver (http://creativecommons.org/ publicdomain/zero/1.0/) applies to the data made available in this article, unless otherwise stated.
Background
DNA methylation is an epigenetic mechanism that regu-lates different genome functions, including gene expres-sion, which may intervene in physiological events such as cell lineage determination, cell differentiation, cell maturation and tissue-specific gene expression [1, 2]. Much of a person’s epigenomic pattern is established during embryogenesis and early development of the fetus
[3]. However, genomic DNA methylation is known to be sensitive to environmental stimuli and changes during lifetime and with aging [4]. Some epigenomic modifica-tions over time are important in development, but oth-ers occur stochastically [5, 6]. These alterations in DNA methylation patterns have been suggested to account for many age-related diseases [7–10]. For instance, age-asso-ciated alterations in DNA methylation have been found to be involved in the initiation and progression of cancer and certain chronic diseases [11].
The relationship between DNA methylation levels and age has already been demonstrated [12–16]. In fact, the use of DNA methylation data has been proposed as a method of measuring biological aging and it is possible to predict the age of a tissue based on its methylation
Open Access
*Correspondence: mffraga@cinn.es; empar.lurbe@uv.es 2 Servicio de Pediatría, Consorcio Hospital General Universitario, Universidad de Valencia, Avda. Tres Cruces s/n, 46014 Valencia, Spain 4 Nanomaterials and Nanotechnology Research Center (CINN)‑Spanish Council for Scientific Research (CSIC), (CINN‑CSIC), Avenida de la Vega 4‑6, 33940 El Entrego, Spain
pattern at specific CpG sites [12, 13, 17–19]. However, most studies exploring age-associated DNA methyla-tion changes have been carried out on adults and have focused on aspects such as cell senescence, longevity, cancer, stem cell functions and chronological age [18, 20–25]. Reports on DNA methylation patterns during early childhood are still scarce [26–30]. The characteriza-tion of DNA methylacharacteriza-tion patterns during the first years of life is an ongoing task, and data from longitudinal studies are more revealing. DNA methylation levels have been shown to change rapidly during early development, with more pronounced changes in the immediate post-natal years, while methylation levels at many sites tend to stabilize beyond age 7 [31].
Additionally, early life conditions can predispose the fetus to a range of adult health outcomes, and DNA methylation seems to play an important role in this pro-cess [32, 33]. For instance, the time immediately before and after birth may be a sensitive period related to pro-gramming cardiometabolic risk [34, 35]. Adult health outcomes are therefore determined not only by conven-tional risk factors experienced in adult life, but also by early life programming [36], which has been shown to be mediated by DNA methylation [37].
Due to the influence of early life epigenetic program-ming on health outcomes and the fact that DNA methyl-ation levels seem to change more rapidly during the first years of life, the identification of CpG sites that are modi-fied by age in infants would lead to the detection of genes that might be epigenetically modulated by environmental factors during early childhood. If disturbed, these might contribute to susceptibility to specific diseases later in life [38, 39].
Thus, the aims of this study were: (1) the identification of CpG sites with changes in DNA methylation levels measured longitudinally between cord blood samples and peripheral blood samples at 5 years after birth in a group of 15 children. Children who were small (SGA), appro-priate (AGA), and large for gestational age (LGA), and normal weight or overweight/obese at 5 years old were included; and (2) the characterization of the genomic distribution and functional relationships of age-modified CpG sites during early childhood.
Results
In order to identify DNA methylation changes with time during the first 5 years of life, the methylation patterns of 484103 CpG sites in cord and 5-year-old blood samples from the same 15 subjects were compared. We found that the DNA methylation levels of 6641 CpG sites changed as a function of age. Specifically, 2443 probes (36.79 %) were hypermethylated with time, corresponding to 1407 genes; and 4198 probes (63.21 %) corresponding to 2640
genes, were hypomethylated with time. Hierarchical clus-tering of all samples using the dmCpGs enabled each sample to be correctly classified into its corresponding age group (Fig. 1).
To characterize these dmCpG sites from a func-tional genomics point of view, we first determined their distribution within the different regions of the CpG islands [40]. Hypermethylated probes were enriched in CpG island shores, while hypomethylated CpG sites were enriched in non CpG islands (CGIs) (Pearson’s Chi squared test; p < 0.001, OR = 1.60 and p < 0.001, OR = 1.91, respectively) (Fig. 2a). In terms of genomic location, hypermethylated CpG sites were enriched mainly in exons (Pearson’s Chi squared test; p < 0.001, OR = 1.37), and hypomethylated probes in introns
[image:2.595.306.538.303.619.2](Pearson’s Chi squared test; p < 0.001, OR = 1.41) (Fig. 2b). There was no statistically significant relation-ship between both hyper- and hypomethylated CpG sites and their respective distances to centromeres. On the other hand, only hypomethylated probes have a statisti-cally significant change in their distance to telomeres (Fig. 3), but with a minimal effect size measured by Cliff’s Delta (D) (Wilcoxon test; p < 0.001, D = −0.0017), which seems to be non-biologically relevant.
To distinguish the chromatin marks associated with the dmCpG sites showing changes over time, the DNA sequences identified in our study were analyzed against previously reported data on a collection of histone modi-fications and chromatin modifiers in 10 different cell types obtained from healthy individuals, (see “Methods” sec-tion), where hematologic cells are also represented. In the present study, we found statistically significant asso-ciations of hypermethylated CpGs with the repressive his-tone mark H3K27me3 and the polycomb group protein EZH2 in most differentiated ENCODE cell lines (Fisher’s exact test; p < 0.05) (Fig. 4). This is in line with previously published data [41, 42]. Similarly, hypomethylated probes were here associated with regions enriched in H3K4me1 (Fisher’s exact test; p < 0.05) (Fig. 4). This has been shown previously, where age-associated changes of DNA meth-ylation were studied in differentiated and adult stem cells [41].
The analysis of the gene ontology (GO) of the genes associated with the differentially methylated probes showed that both hyper- and hypomethylated genes were significantly enriched (FDR <0.05) in specific GO terms of biological processes, molecular functions and cellular components (Tables 1, 2). Hypermethylated genes were
associated with biological processes related to develop-ment and cell adhesion, with molecular functions related to sequence-specific DNA binding, and cellular compo-nents such as dendrite or axon (Table 1). On the other hand, hypomethylated genes were associated with bio-logical processes related to immune system regulation, with molecular functions related to antigen binding and intracellular signalling, and with cellular components related to the MHC protein complex and cytoskeleton (Table 2).
To analyze whether methylation changes with time were associated with birth weight or being overweight at 5 years of age, the comparative analysis was per-formed considering these two variables. No significant DNA methylation changes were found in relation to SGA group, or to being overweight at 5 years old (nor-mal weight/overweight). It was not possible to determine whether there was an association between the SGA and being overweight at 5 years old, due to the fact that none of the individuals that were overweight at 5 years old belonged to the group of subjects who were SGA.
Discussion
The present longitudinal study focuses on the dynam-ics and the context of DNA methylation changes dur-ing early childhood in peripheral blood leukocytes. Data were compiled from 30 blood samples corresponding to 15 individuals at two time points (umbilical cord at birth, and 5 years after birth). It was shown that DNA methyla-tion levels are modified as a funcmethyla-tion of age in 6641 CpG sites, most of them being hypomethylated. In hyper- and hypomethylated CpG sites, DNA methylation changes were significantly associated with intragenic regions, with exons and introns respectively. This implies that these DNA methylation changes are non-randomly dis-tributed and specifically occur in discrete regions of the genome.
To further examine the features of the identified dmCpGs, the GO terms related to the genes associated with the differentially methylated probes were charac-terized. Both hyper- and hypomethylated sites were sig-nificantly enriched in specific GO terms of biological processes, molecular functions and cellular components. Specifically, it was found that genes with age-hyper-methylated CpG sites were enriched in biological pro-cesses related to different tissue morphogenesis and development. This is in line with previous studies where increased DNA methylation was involved in silencing developmental genes [43].
Regarding hypomethylation with age, this study sup-ports findings from previous resup-ports where CpG sites, which are age-hypomethylated in the first 2 or 5 years following birth, are enriched in immune-related
Fig. 2 Genomic characterization of the dmCpGs with time. a Stacked
bar chart describing the proportion of CpG sites in the selected
subsets of interest according to their CpG Island status and relative to the background Illumina® 450 k (All) proportions. Hypermethylated probes are enriched in CpG island shores while hypomethylated CpG sites are enriched in non CpG islands (CGIs) (Pearson’s Chi squared test; p < 0.001, OR = 1.60 and p < 0.001, OR = 1.91, respectively). b
[image:3.595.59.290.88.187.2]genes [26, 29]. Taking into account that a decrease in DNA methylation levels at promoter regions is known to enable gene expression [44], DNA methyla-tion changes with age during the first years of life in human leukocytes may be closely associated with cell differentiation, and commitment to lymphoid and myeloid lineages [45]. These results thus denote that differences in DNA methylation associated with age may not only be triggered by stochastic DNA methyla-tion changes [24, 46], but may also be related to the immune system function [26]. Additionally, age-hypo-methylated CpGs sites were enriched in genes related to the MHC protein complex. This finding is in line with a recent study in samples from birth to 5 years old, where DNA methylation levels in class I and class II MHC molecules were found to decrease with age [26].
To explain the mechanisms that mediate the DNA methylation changes observed during aging, an increas-ing number of studies have focused on the identification of the factors determining the dynamics of DNA meth-ylation. For instance, genes that are hypermethylated in blood during aging have been recently associated with the presence of bivalent chromatin domains in embry-onic stem cells [21, 42, 47, 48], as well as with repressive histone marks (H3K27me3/H3K9me3) in differentiated cells [41, 42]. The results of the present study indicate the presence of the same repressive histone marks found in differentiated cells in the sequences that are hyper-methylated with time during the first 5 years of life in leukocytes. This finding supports the notion that these repressive histone marks are related to DNA methylation gain during aging, independent of the type of cell or its potential, as previously described [41].
[image:4.595.57.539.87.426.2]The present data also show a strong enrichment in the active chromatin mark H3K4me1 in age-hypomethylated sequences, which is in line with the data provided for hypomethylated sequences in MSCs and differentiated cells during aging [41]. This finding points towards this histone modification being of use as a cell-type-inde-pendent chromatin signature of DNA hypomethylation during aging. Additionally, a recent study indicated cor-respondence of H3K4me1 with enhancers [49], and an association between DNA hypomethylation within spe-cific transposable elements and tissue-spespe-cific enhancer marks [50]. This suggests that H3K4me1-associated DNA hypomethylation could play a role in tissue-specific epi-genetic gene regulation and the deregulation of gene expression during aging [51]. More studies, however, are required to clarify the mechanisms managing the meth-ylation machinery to the age-modified loci during this time window.
A major issue in age-related DNA methylation stud-ies is hematologic cell heterogeneity [52, 53], due to the fact that DNA methylation is usually measured in unfrac-tionated blood. In order to adjust the model of analysis, a Surogate Variable Analysis (SVA)-based approach was applied, as described in Leek et al. [54] (see “Methods” section for details). This ensured that cell heterogeneity
had a minimal impact on the blood DNA methylation data.
One limitation of the present study was that between-group differences with respect to variables such as SGA or being overweight at 5 years of age could not be adequately evaluated. This was due to the number of individuals belonging to each category analyzed being insufficient or too unequally distributed between groups to allow for comparisons and analysis. A larger number of individuals should be incorporated to a future study to address this issue.
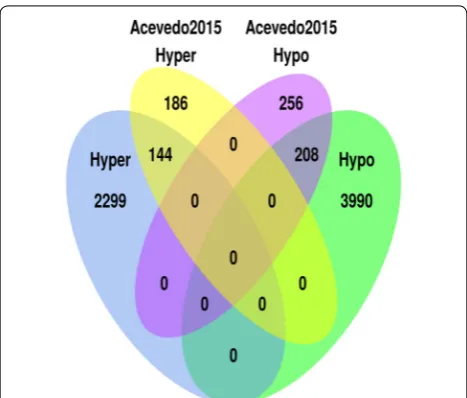
Several studies have explored DNA methylation pat-terns during early childhood [26–31]. For instance, blood samples from 3 months and 5 years of age were analyzed using the HumanMethylation450 BeadChip in the lon-gitudinal study performed by Acevedo et al. [26]. This provided a total of 794 CpG sites where 330 CpG sites (41.5 %) were age-methylated and 464 CpG sites (58.4 %) were age-demethylated. When comparing with their results, it was found that 144 (43.64 %) of their hyper-methylated and 208 (44.83 %) of their hypohyper-methylated probes were identified by the present study (Fig. 5). Com-mon GO terms (related to MHC protein complex) were also found when analyzing probes that were hypomethyl-ated in both studies (Table 2). Furthermore, the tendency
Fig. 4 Heatmaps showing the association between the location of hypermethylated (a) and hypomethylated (b) CpG sites and enriched regions for several chromatin marks and cell lines. Chromatin marks peak location information for each cell line was extracted from the ENCODE BROAD Histone project information available at the UCSC Genome Browser. Associations between CpG site and chromatin mark peak locations were tested using a Fisher’s exact test. P values were adjusted for multiple comparisons and only those falling under a 0.05 FDR threshold are shown as colored
spots in the heatmap. The base‑2 logarithm of the odds ratio (OR) was used as a measure of effect size. Associations with higher effect sizes are
[image:5.595.58.540.88.305.2]of a loss of methylation with age was corroborated in our set of samples. Additionally, other studies have identi-fied different regions with changes in DNA methylation with age [27–31]. The possible differences in the CpG sites found in the literature could be explained due to dis-parities in the cell type (buccal epithelium, mononuclear cells, blood…), methodologies (HumanMethylation450 and/or 27 BeadChip), ages included in the study, meth-ods of analysis, or purpose of the studies, for instance.
Methods
Selection of participants
Parents of newborns born at term (gestational age ≥37 weeks) in the General Hospital, University of
Valencia, Spain, after uncomplicated pregnancies and in the absence of perinatal illness were randomly invited to participate in the study. Exclusion criteria were multiple gestations, cesarean section, and that parents were plan-ning to move out of the area after delivery. Gestational age at birth was ascertained according to the method of Ballard et al. [55], and the general characteristics of ges-tation and delivery for each participant were obtained from routine obstetrical records. Subjects were divided according to birth weight (BW) and gestational age— SGA, <10th percentile for their sex; AGA, between 10th– 90th percentile; and LGA, >90th percentile [56]. The subjects were followed-up at 5 years of age and all meas-urements were taken at birth and at 5 years. At birth all parents gave informed consent for their children to par-ticipate in the study, and the Committee for the Protec-tion of Human Subjects of the Hospital General approved the study according to the Declaration of Helsinki.
Anthropometric parameters
At 5 years, body weight was recorded to the nearest 0.1 kg using a standard beam balance scale with the sub-jects wearing light indoor clothing and no shoes. Height was recorded to the nearest 0.5 cm using a standardized wall-mounted height board. Body mass index (BMI) and the corresponding standard deviation were calculated, with BMI being the weight in kilograms divided by the square of the height in meters. Subjects with a BMI rang-ing from the 85th to 95th percentile were defined as being overweight [57] while they were defined as obese when having a BMI above the 95th percentile [58].
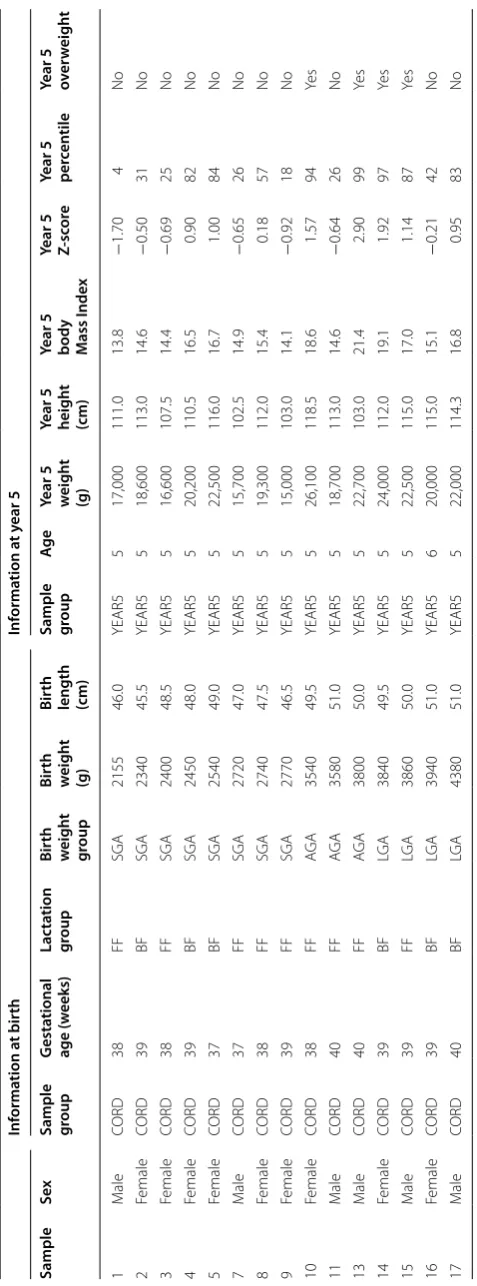
In total, 15 subjects were enrolled in this study. Eight of the 15 subjects (53.3 %) (2 boys/6 girls) were SGA and the other seven (46.7 %) (4 boys/3 girls) were AGA or LGA. Four individuals were overweight/obese at 5 years old (BMI between 17 and 21.4), none of whom were SGA (Table 3).
Sample collection, DNA extraction, and quantification Blood samples were collected from 15 subjects at the two testing times. First, cord blood samples were taken at birth, and second, peripheral venous blood samples were taken from each child during their fifth year of life. Genomic DNA was extracted with the RealPure kit (RealPure, REAL, Durviz, Ref: RBMEG01) and quantified with the Nanodrop-2000C Spectrophotometer. A DNA quality check was performed with Quant-iT PicoGreen dsDNA reagent.
Table 1 Gene ontology analysis of hypermethylated GpG sites from birth to 5 years of age (with RR >2 and Q Value <0.001)
RR relative risk is a measure of effect size describing the change of proportions between our selected set of genes and a given term
Q value Q value is the result from the adjustment of P values in order to control the false discovery rate (FDR) using the Benjamini-Hochberg method
Onthology Term RR Q_value
Biological_process Digestive tract morpho‑
genesis 6.3551 2.25E−05 Biological_process Homophilic cell adhesion 4.6179 7.02E−09 Biological_process Digestive tract development 3.6972 0.0001 Biological_process Locomotory behavior 3.6791 1.77E−07 Biological_process Cell–cell adhesion 3.6197 1.63E−07 Biological_process Digestive system develop‑
ment 3.3312 0.00035 Biological_process Hindbrain development 3.1444 0.00072 Biological_process Cell fate commitment 2.7058 0.00011 Biological_process Behavior 2.4935 2.83E−08 Biological_process Embryonic organ morpho‑
genesis 2.4633 0.00027 Biological_process Single‑organism behavior 2.3998 3.88E−05 Biological_process Cell adhesion 2.3899 4.55E−13 Biological_process Regionalization 2.381 0.00015 Biological_process Biological adhesion 2.3795 4.55E−13 Biological_process Brain development 2.2605 4.09E−08 Biological_process Pattern specification process 2.2365 5.37E−05 Biological_process Central nervous system
development 2.2029 5.18E−10 Biological_process Muscle structure develop‑
ment 2.1471 0.00017 Biological_process Embryonic morphogenesis 2.1396 1.59E−05 Biological_process Embryonic organ develop‑
ment 2.0979 0.00047 Biological_process Skeletal system development 2.0909 0.00035 Molecular_function Sequence‑specific DNA
binding 2.0117 2.71E−06 Cellular_component Dendrite 2.3717 1.38E−05 Cellular_component Axon 2.2741 0.00099 Cellular_component Somatodendritic compart‑
[image:6.595.58.288.120.517.2]Illumina® Infinium 450 k data preprocessing
The study of the DNA methylation pattern of 485577 CpG sites was performed using Illumina® Infinium 450 k array and the IDAT files from the microarray were pro-cessed further using the R/Bioconductor package minfi
[59]. In order to adjust for the different probe design types present in the 450 k architecture, red and green signals from the IDAT files were corrected using the SWAN algorithm [60]. No background correction or control probe normalization was applied. Probes where at least two samples had detection p values over 0.01 were filtered out. In accordance with Du et al. [61], both Beta values and M values were computed and employed across the analysis pipeline. M values were used for all the statistical analyses, assuming homoscedasticity, while Beta values were mostly used for the intuitive interpreta-tion and visualizainterpreta-tion of the results.
Batch effect correction
Surrogate Variable Analysis (SVA) [54] was employed to capture the heterogeneity of the underlying methylation
data and to account for possible batch effects or con-founding variables that might be of interest. Coefficients for the detected surrogate variables (SVs) were later added to the phenotypical data and included in the defi-nition of a model in order to detect differentially meth-ylated probes (DMPs). The R/Bioconductor package sva
[62] implementation was used to estimate the number of SVs and their coefficients, using both age group (new-borns/five year olds) and gender as covariates of interest, and only one intercept term as a null background model. Multidimensional scaling (MDS) was employed as a visu-alization tool whenever there was a need to illustrate the influence of possible confounders on the data.
White blood cell heterogeneity adjustment
Cellular heterogeneity is a main source of variation in Epigenomic studies [63]. Each cell type has a different Epigenomic profile, and variations of the different sub-populations can often be confounded with the pheno-type of interest, resulting in a higher rate of both false positives and negatives. This is especially true when using Table 2 Gene ontology analysis of hypomethylated GpG sites from birth to 5 years of age (with RR >2 and Q value <0.01)
RR relative risk is a measure of effect size describing the change of proportions between our selected set of genes and a given term
Q value Q value is the result from the adjustment of P values in order to control the false discovery rate (FDR) using the Benjamini-Hochberg method
Onthology Term RR Q_value
[image:7.595.61.539.100.427.2]whole blood as our main tissue, due to its highly variable subpopulation composition. This is especially relevant if we take into account the number of Epigenomic stud-ies that have been published and that use whole blood as their main tissue.
One of the most common approaches to dealing with blood cellular heterogeneity is the Houseman method [53], which uses a methylation database of several, pure-lineage samples in order to compute an approximation to the real subpopulation percentages. Using this informa-tion, the method is able to adjust the original methylation dataset and generate a new one where the confounder influence has been removed. Several other methods have been proposed that expand on this concept, and some of them do not even require having a purified samples methylation database in advance [64].
However, there are also other approaches to the detec-tion of confounding factors that do not need informadetec-tion about the Epigenomic profiles of the different cell sub-types. SVA [54], for example, is a general framework for the detection of structured variability patterns over the residuals of a previously fitted model using the main phe-notype of interest. In general, SVA is not only able to cap-ture the variation due to cellular heterogeneity, but also due to other factors, some of them possibly unknown to the researcher.
After an exploratory analysis of the data, it was decided to use SVA to capture the main confounding factors in
our dataset, and to include them in our model. This resulted in a better fitted model than those based on the Houseman method alone, which suggested that in our case SVA is able to capture the cellular subpopulations proportion variations occurring in our data.
Detection of differentially methylated probes
Significant methylation of a probe was determined by the moderated t test implemented in the R/Bioconduc-tor package limma [65]. A linear model, with methylation level as response and all the combinations of age group, birth weight and overweight at 5 years as the main covar-iate of interest, was fitted to the methylation data. Sur-rogate Variables generated using SVA and information regarding the gender and pair ID of the samples was also included in the model definition. Contrasts were then defined as the linear combinations of the different val-ues the main covariate of interest could take, in order to represent the different questions arising from the model design. Each contrast generated a coefficient and P value for each probe. P values were corrected for multiple test-ing ustest-ing the Benjamini-Hochberg method for control-ling the false discovery rate (FDR). A FDR threshold of 0.05 was employed to determine DMPs.
Histone enrichment analysis
In order to analyze the enrichment of histone marks for a subset of probes, the information contained in the UCSC Genome Browser Broad Histone track from the ENCODE Project was used. Histone mark peaks were downloaded for every combination of cell line and anti-body. For each track, a 2 × 2 contingency table was built to represent the partition of the whole set of possible probes in the microarray with respect to their member-ship of the subset of interest and the overlap between the probes and the histone peaks. A Fisher’s exact test was used to determine whether there was a significant enrich-ment of the selected histone mark for the subset of inter-est. P values were adjusted for multiple comparisons using the Benjamini-Hochberg method for controlling the FDR. A significance level of 0.05 was used to deter-mine whether the given combination of histone mark and cell line presented a significant change in proportion. Additionally, the base-2 logarithm of the odds ratio (OR) was used as a measure of effect size.
Genomic region analysis
The probes in the microarray were assigned to a genomic region according to their position relative to the tran-script information extracted from the R/Bioconductor package TxDb.Hsapiens.UCSC. hg19.knownGene (pack-age version 3.0.0). A probe was said to be in a promoter
[image:8.595.57.291.86.285.2]Table 3 C linic al inf orma
tion of the 15 subjec
ts enr
olled in this study
FF for mula f eeding , BF br eastf eeding , SG A small f or gesta tional age , AG A appr opr ia te f or gesta tional age , LG A lar ge f or gesta tional age Inf orma tion a t bir th Inf orma tion a t y ear 5 Sample Sex
Sample group
G esta tional age (w eeks) Lac ta tion gr oup Bir th w eigh t gr oup Bir th w eigh t (g) Bir th
length (cm) Sample group
Ag
e
Year 5 weigh
t
(g)
Year 5 heigh
t
(cm)
Year 5 body Mass I
nde
x
Year 5 Z-sc
or
e
Year 5 per
cen
tile
Year 5 over
[image:9.595.181.420.84.728.2]region if it was located in a region up to 2 kb upstream of the transcription start site (TSS) of any given tran-script. Similarly, a set of mutually exclusive regions were defined inside the transcripts, namely 5UTR, 3UTR, first exon, exon and intron. A probe could only belong to one of these categories, and when anyone overlapped with two or more of these regions in different transcripts, it was assigned to the region with the higher level of prec-edence (i.e. in the same order as stated above). If a probe was not assigned to any of these special regions, it was labeled by default as intergenic. A contingency table was built for each of the subsets, partitioning the complete set of probes according to membership of a given category and the subset of interest. A Pearson’s χ2 test was used to determine if there was a significant change in proportion between the number of probes marked as belonging to a given region inside and outside the subset of interest. A significance level of 0.05 and the effect size as measured by the odds ratio (OR) were employed for this test.
CpG Island status analysis
The CpG island locations used in the analyses were obtained from the R/Bioconductor package FDb.Infini-umMethylation.hg19 [66]. The generation procedure of these CpG Islands is described by Wu et al. [40] CpG shores were defined as the 2kbp regions flanking a CpG island. CpG shelves were defined as the 2kbp region either upstream or downstream of each CpG shore. Probes not belonging to any of the regions previously mentioned were assigned to the special category non-CpG island. Each probe was assigned to only one of the categories. A 4 × 2 contingency table was constructed for every subset of probes in order to study the association between the given subset and the different CpG island categories. A Chi squared test was used to determine whether any of the categories had a significant associa-tion with the given subset. For each of the CpG island status levels, a 2 × 2 contingency table was defined and another Chi squared test was used to independently eval-uate the association of the given subset with each status level. A significance level of 0.05 was employed for all tests. Effect size was reported as the Odds Ratio for each of the individual tests.
Gap distance analysis
Distance from both the centromere and telomere was measured for each of the probes in the Human Meth-ylation450 microarray. In order to find significant dif-ferences between the probes inside the subset of interest and those in the background, a Wilcoxon non-paramet-ric test was used. Again, a significance level of 0.05 was employed for all tests, and Cliff’s Delta (D) was used as a measure of effect size.
Microarray background correction
Although it is sometimes referred to as a genome wide solution, the Infinium450 k microarray only covers a fraction of the entire genome. In its 27 k predeces-sor, the probes were mainly located at gene promoter regions, while in addition to the promoter probes, the Infinium450 k includes probes located inside genes and in intergenic regions [67]. The irregular distribu-tion of probes can lead to unwanted biases when study-ing whether a selected subset of probes is enriched with respect to any functional or clinical mark. In this study, a reference to the background distribution of features was included in every type of statistical test performed in order to prevent the conclusions from being driven by the irregular distribution of probes. In qualitative tests (CpG island status, genomic region and histone mark enrichment), the contingency matrix was built to repre-sent the background distribution of the microarray. Thus any significant result would indicate a departure from the fixed background distribution, and so avoid any manu-facturer bias.
Gene ontology analysis and annotation
Probe sets were converted to gene sets by using the annotation information present in the R/Bioconductor package TxDb.Hsapiens.UCSC.hg19.knownGene ( Carl-son M. TxDb.Hsapiens.UCSC.hg19.knownGene: Annota-tion package for TxDb object(s).). A probe was assigned to a gene if the probe was contained within the union of all the genomic regions represented by the different transcripts belonging to that gene, or in a 2kbp region upstream of the corresponding TSS. Probes converted in this way can be assigned to zero (intergenic probes) or more genes. After gene conversion, each subset of inter-est was analyzed using the HOMER software tool [68]. The software was configured to use the whole set of genes represented in the HumanMethylation450 architecture as a background. HOMER tested the genes in each sub-set of interest against 21 different databases, including the Gene Ontology (GO) Biological Process, Molecular Function and Cellular Component ontologies, as well as KEGG and Reactome pathway databases, among others.
Conclusions
window of opportunity in childhood and indicate that blood leukocytes experience a genome remodeling, which is related to interaction with environmental fac-tors. This underlines the importance of environmental exposures during the first years of life and highlights the need to take this into consideration in new strategies for disease prevention.
Data access
The Illumina® Infinium 450 k DNA methylation data sets from this study have been submitted to the NCBI Gene Expression Omnibus (GEO; http://www.ncbi.nlm.nih. gov/geo/) under accession number GSEXXXXX (Sub-Series GSEXXXXX and GSEXXXXX).
Authors’ contributions
RGU, MFF, GFB, and AFF carried out the methylation studies and participated in drafting the manuscript. RGU, MFF, GFB and AFF performed the statistical analysis. EL conceived of the study and participated in its design and coordi‑ nation of the manuscript. MIT and JAP participated in collecting and qualify‑ ing mothers and children. PR performed critical revision of the manuscript. All authors read and approved the final manuscript.
Author details
1 Cancer Epigenetics Laboratory, Institute of Oncology of Asturias (IUOPA), HUCA, Universidad de Oviedo, Oviedo, Spain. 2 Servicio de Pediatría, Consorcio Hospital General Universitario, Universidad de Valencia, Avda. Tres Cruces s/n, 46014 Valencia, Spain. 3 CIBER Fisiopatología Obesidad y Nutrición (CB06/03), Instituto de Salud Carlos III, Madrid, Spain. 4 Nanomaterials and Nanotechnol‑ ogy Research Center (CINN)‑Spanish Council for Scientific Research (CSIC), (CINN‑CSIC), Avenida de la Vega 4‑6, 33940 El Entrego, Spain.
Acknowledgements
We thank Ronnie Lendrum for editorial assistance. This work has been financially supported by Plan Nacional de I + D+I 2008–2011/2013–2016/ FEDER (PI14/01781 and PI11/00144 to M.I.T., J.A., P.R., and E.L.; PI12/01080 to M.F.F.; and PI11/01728 to AF.F.); the Fundación Cientifica de la AECC (to R.G.U.); Centros de Investigación Biomédica en Red de Fisiopatología Obesidad y Nutrición (CB06/03), Instituto de Salud Carlos III (to M.I.T., J.A., P.R., and E.L.); IUOPA (to G.F.B.); and Fundación Ramón Areces (to M.F.F). A.F.F. is sponsored by ISCIII‑Subdirección General de Evaluación y Fomento de la Investigación (CP11/00131). The IUOPA is supported by the Obra Social Cajastur, Spain.
Competing interests
The authors declare that they have no competing interests.
Received: 17 February 2016 Accepted: 18 May 2016
References
1. Ji H, Ehrlich LI, Seita J, Murakami P, Doi A, Lindau P, Lee H, Aryee MJ, Irizarry RA, Kim K, et al. Comprehensive methylome map of lineage com‑ mitment from haematopoietic progenitors. Nature. 2010;467:338–42. 2. Nagae G, Isagawa T, Shiraki N, Fujita T, Yamamoto S, Tsutsumi S, Nonaka A,
Yoshiba S, Matsusaka K, Midorikawa Y, et al. Tissue‑specific demethylation in CpG‑poor promoters during cellular differentiation. Hum Mol Genet. 2011;20:2710–21.
3. Reik W. Stability and flexibility of epigenetic gene regulation in mam‑ malian development. Nature. 2007;447:425–32.
4. Jaenisch R, Bird A. Epigenetic regulation of gene expression: how the genome integrates intrinsic and environmental signals. Nat Genet. 2003;33(Suppl):245–54.
5. Feil R, Fraga MF. Epigenetics and the environment: emerging patterns and implications. Nat Rev Genet. 2012;13:97–109.
6. Fraga MF. Genetic and epigenetic regulation of aging. Curr Opin Immu‑ nol. 2009;21:446–53.
7. Bjornsson HT, Cui H, Gius D, Fallin MD, Feinberg AP. The new field of epi‑ genomics: implications for cancer and other common disease research. Cold Spring Harb Symp Quant Biol. 2004;69:447–56.
8. Heyn H, Moran S, Esteller M. Aberrant DNA methylation profiles in the premature aging disorders Hutchinson‑Gilford Progeria and Werner syndrome. Epigenetics. 2013;8:28–33.
9. Timp W, Feinberg AP. Cancer as a dysregulated epigenome allowing cellular growth advantage at the expense of the host. Nat Rev Cancer. 2013;13:497–510.
10. Feinberg AP. Epigenomics reveals a functional genome anatomy and a new approach to common disease. Nat Biotechnol. 2010;28:1049–52. 11. Wilson AS, Power BE, Molloy PL. DNA hypomethylation and human
diseases. Biochim Biophys Acta. 2007;1775:138–62.
12. Florath I, Butterbach K, Muller H, Bewerunge‑Hudler M, Brenner H. Cross‑ sectional and longitudinal changes in DNA methylation with age: an epigenome‑wide analysis revealing over 60 novel age‑associated CpG sites. Hum Mol Genet. 2014;23:1186–201.
13. Horvath S. DNA methylation age of human tissues and cell types. Genome Biol. 2013;14:R115.
14. Weidner CI, Wagner W. The epigenetic tracks of aging. Biol Chem. 2014;395:1307–14.
15. West J, Widschwendter M, Teschendorff AE. Distinctive topology of age‑ associated epigenetic drift in the human interactome. Proc Natl Acad Sci USA. 2013;110:14138–43.
16. Xu Z, Taylor JA. Genome‑wide age‑related DNA methylation changes in blood and other tissues relate to histone modification, expression and cancer. Carcinogenesis. 2014;35:356–64.
17. Bocklandt S, Lin W, Sehl ME, Sanchez FJ, Sinsheimer JS, Horvath S, Vilain E. Epigenetic predictor of age. PLoS ONE. 2011;6:e14821.
18. Hannum G, Guinney J, Zhao L, Zhang L, Hughes G, Sadda S, Klotzle B, Bibikova M, Fan JB, Gao Y, et al. Genome‑wide methylation profiles reveal quantitative views of human aging rates. Mol Cell. 2013;49:359–67. 19. Weidner CI, Lin Q, Koch CM, Eisele L, Beier F, Ziegler P, Bauerschlag DO,
Jockel KH, Erbel R, Muhleisen TW, et al. Aging of blood can be tracked by DNA methylation changes at just three CpG sites. Genome Biol. 2014;15:R24.
20. Bell JT, Tsai PC, Yang TP, Pidsley R, Nisbet J, Glass D, Mangino M, Zhai G, Zhang F, Valdes A, et al. Epigenome‑wide scans identify differentially methylated regions for age and age‑related phenotypes in a healthy age‑ ing population. PLoS Genet. 2012;8:e1002629.
21. Heyn H, Li N, Ferreira HJ, Moran S, Pisano DG, Gomez A, Diez J, Sanchez‑ Mut JV, Setien F, Carmona FJ, et al. Distinct DNA methylomes of newborns and centenarians. Proc Natl Acad Sci USA. 2012;109:10522–7.
22. Johnson KC, Koestler DC, Cheng C, Christensen BC. Age‑related DNA methylation in normal breast tissue and its relationship with invasive breast tumor methylation. Epigenetics. 2014;9:268–75.
23. Talens RP, Christensen K, Putter H, Willemsen G, Christiansen L, Kremer D, Suchiman HE, Slagboom PE, Boomsma DI, Heijmans BT. Epigenetic vari‑ ation during the adult lifespan: cross‑sectional and longitudinal data on monozygotic twin pairs. Aging Cell. 2012;11:694–703.
24. Teschendorff AE, West J, Beck S. Age‑associated epigenetic drift: implica‑ tions, and a case of epigenetic thrift? Hum Mol Genet. 2013;22:R7–15. 25. West J, Beck S, Wang X, Teschendorff AE. An integrative network algo‑
rithm identifies age‑associated differential methylation interactome hot‑ spots targeting stem‑cell differentiation pathways. Sci Rep. 2013;3:1630. 26. Acevedo N, Reinius LE, Vitezic M, Fortino V, Soderhall C, Honkanen H, Vei‑
jola R, Simell O, Toppari J, Ilonen J, et al. Age‑associated DNA methylation changes in immune genes, histone modifiers and chromatin remodeling factors within 5 years after birth in human blood leukocytes. Clin Epige‑ netics. 2015;7:34.
27. Alisch RS, Barwick BG, Chopra P, Myrick LK, Satten GA, Conneely KN, Warren ST. Age‑associated DNA methylation in pediatric populations. Genome Res. 2012;22:623–32.
in early life and pair‑specific effects of discordance. Genome Biol. 2013;14:R42.
29. Martino DJ, Tulic MK, Gordon L, Hodder M, Richman TR, Metcalfe J, Prescott SL, Saffery R. Evidence for age‑related and individual‑specific changes in DNA methylation profile of mononuclear cells during early immune development in humans. Epigenetics. 2011;6:1085–94. 30. Wang D, Liu X, Zhou Y, Xie H, Hong X, Tsai HJ, Wang G, Liu R, Wang X. Indi‑
vidual variation and longitudinal pattern of genome‑wide DNA methyla‑ tion from birth to the first two years of life. Epigenetics. 2012;7:594–605. 31. Simpkin AJ, Suderman M, Gaunt TR, Lyttleton O, McArdle WL, Ring SM,
Tilling K, Davey Smith G, Relton CL. Longitudinal analysis of DNA methyla‑ tion associated with birth weight and gestational age. Hum Mol Genet. 2015;24:3752–63.
32. Barker DJ, Gluckman PD, Godfrey KM, Harding JE, Owens JA, Robin‑ son JS. Fetal nutrition and cardiovascular disease in adult life. Lancet. 1993;341:938–41.
33. Burdge GC, Lillycrop KA. Nutrition, epigenetics, and developmental plasticity: implications for understanding human disease. Annu Rev Nutr. 2010;30:315–39.
34. Lurbe E, Carvajal E, Torro I, Aguilar F, Alvarez J, Redon J. Influence of concurrent obesity and low birth weight on blood pressure phenotype in youth. Hypertension. 2009;53:912–7.
35. Lurbe E, Garcia‑Vicent C, Torro MI, Aguilar F, Redon J. Associations of birth weight and postnatal weight gain with cardiometabolic risk parameters at 5 years of age. Hypertension. 2014;63:1326–32.
36. Singhal A, Lucas A. Early origins of cardiovascular disease: is there a unify‑ ing hypothesis? Lancet. 2004;363:1642–5.
37. Rangel M, dos Santos JC, Ortiz PH, Hirata M, Jasiulionis MG, Araujo RC, Ierardi DF. Franco Mdo C: modification of epigenetic patterns in low birth weight children: importance of hypomethylation of the ACE gene promoter. PLoS ONE. 2014;9:e106138.
38. Morales E, Bustamante M, Vilahur N, Escaramis G, Montfort M, de Cid R, Garcia‑Esteban R, Torrent M, Estivill X, Grimalt JO, Sunyer J. DNA hypomethylation at ALOX12 is associated with persistent wheezing in childhood. Am J Respir Crit Care Med. 2012;185:937–43.
39. Perera F, Tang WY, Herbstman J, Tang D, Levin L, Miller R, Ho SM. Relation of DNA methylation of 5′‑CpG island of ACSL3 to transplacental exposure to airborne polycyclic aromatic hydrocarbons and childhood asthma. PLoS ONE. 2009;4:e4488.
40. Wu H, Caffo B, Jaffee HA, Irizarry RA, Feinberg AP. Redefining CpG islands using hidden Markov models. Biostatistics. 2010;11:499–514.
41. Fernandez AF, Bayon GF, Urdinguio RG, Torano EG, Garcia MG, Carella A, Petrus‑Reurer S, Ferrero C, Martinez‑Camblor P, Cubillo I, et al. H3K4me1 marks DNA regions hypomethylated during aging in human stem and differentiated cells. Genome Res. 2014;25:27–40.
42. Rakyan VK, Down TA, Maslau S, Andrew T, Yang TP, Beyan H, Whittaker P, McCann OT, Finer S, Valdes AM, et al. Human aging‑associated DNA hypermethylation occurs preferentially at bivalent chromatin domains. Genome Res. 2010;20:434–9.
43. Oda M, Yamagiwa A, Yamamoto S, Nakayama T, Tsumura A, Sasaki H, Nakao K, Li E, Okano M. DNA methylation regulates long‑range gene silencing of an X‑linked homeobox gene cluster in a lineage‑specific manner. Genes Dev. 2006;20:3382–94.
44. Thomas RM, Sai H, Wells AD. Conserved intergenic elements and DNA methylation cooperate to regulate transcription at the il17 locus. J Biol Chem. 2012;287:25049–59.
45. Bocker MT, Hellwig I, Breiling A, Eckstein V, Ho AD, Lyko F. Genome‑wide promoter DNA methylation dynamics of human hematopoietic progeni‑ tor cells during differentiation and aging. Blood. 2011;117:e182–9. 46. Issa JP. Aging and epigenetic drift: a vicious cycle. J Clin Invest.
2014;124:24–9.
47. Fernandez AF, Assenov Y, Martin‑Subero JI, Balint B, Siebert R, Taniguchi H, Yamamoto H, Hidalgo M, Tan AC, Galm O, et al. A DNA methylation fingerprint of 1628 human samples. Genome Res. 2012;22:407–19. 48. Teschendorff AE, Menon U, Gentry‑Maharaj A, Ramus SJ, Weisenberger
DJ, Shen H, Campan M, Noushmehr H, Bell CG, Maxwell AP, et al.
Age‑dependent DNA methylation of genes that are suppressed in stem cells is a hallmark of cancer. Genome Res. 2010;20:440–6.
49. Rada‑Iglesias A, Bajpai R, Swigut T, Brugmann SA, Flynn RA, Wysocka J. A unique chromatin signature uncovers early developmental enhancers in humans. Nature. 2010;470:279–83.
50. Xie M, Hong C, Zhang B, Lowdon RF, Xing X, Li D, Zhou X, Lee HJ, Maire CL, Ligon KL, et al. DNA hypomethylation within specific transposable element families associates with tissue‑specific enhancer landscape. Nat Genet. 2013;45:836–41.
51. Bahar R, Hartmann CH, Rodriguez KA, Denny AD, Busuttil RA, Dolle ME, Calder RB, Chisholm GB, Pollock BH, Klein CA, Vijg J. Increased cell‑ to‑cell variation in gene expression in ageing mouse heart. Nature. 2006;441:1011–4.
52. Guintivano J, Aryee MJ, Kaminsky ZA. A cell epigenotype specific model for the correction of brain cellular heterogeneity bias and its application to age, brain region and major depression. Epigenetics. 2013;8:290–302. 53. Houseman EA, Accomando WP, Koestler DC, Christensen BC, Marsit CJ,
Nelson HH, Wiencke JK, Kelsey KT. DNA methylation arrays as surrogate measures of cell mixture distribution. BMC Bioinformatics. 2012;13:86. 54. Leek JT, Storey JD. Capturing heterogeneity in gene expression studies by
surrogate variable analysis. PLoS Genet. 2007;3:1724–35.
55. Ballard JL, Novak KK, Driver M. A simplified score for assessment of fetal maturation of newly born infants. J Pediatr. 1979;95:769–74.
56. Battaglia FC, Lubchenco LO. A practical classification of newborn infants by weight and gestational age. J Pediatr. 1967;71:159–63.
57. Kuczmarski RJ, Ogden CL, Guo SS, Grummer‑Strawn LM, Flegal KM, Mei Z, Wei R, Curtin LR, Roche AF, Johnson CL. CDC Growth Charts for the United States: methods and development. Vital Health Stat. 2000;11(2002):1–190.
58. Barlow SE. Expert committee recommendations regarding the preven‑ tion, assessment, and treatment of child and adolescent overweight and obesity: summary report. Pediatrics. 2007;120(Suppl 4):S164–92. 59. Aryee MJ, Jaffe AE, Corrada‑Bravo H, Ladd‑Acosta C, Feinberg AP, Hansen
KD, Irizarry RA. Minfi: a flexible and comprehensive bioconductor pack‑ age for the analysis of Infinium DNA methylation microarrays. Bioinfor‑ matics. 2014;30:1363–9.
60. Makismovic J, Gordon L, Oshlack A. SWAN: subset‑quantile within array normalization for Illumina Infinium HumanMethylation450 BeadChips. Genome Biol. 2012;13(6):R44.
61. Du P, Zhang X, Huang C‑C, Jafari N, Kibbe WA, Hou L, Lin SM. Comparison of Beta‑value and M‑value methods for quantifying methylation levels by microarray analysis. BMC Bioinformatics. 2010;11:587.
62. Leek JT, Johnson WE, Parker HS, Jaffe AE, Storey JD. The sva package for removing batch effects and other unwanted variation in high‑through‑ put experiments. Bioinformatics. 2012;28:882–3.
63. Jaffe AE, Irizarry RA. Accounting for cellular heterogeneity is critical in epigenome‑wide association studies. Genome Biol. 2014;15:R31. 64. Houseman EA, Molitor J, Marsit CJ. Reference‑free cell mixture
adjustments in analysis of DNA methylation data. Bioinformatics. 2014;30:1431–9.
65. Smyth GK. Limma: linear models for microarray data. In: bioinformatics and computational biology solutions using R and bioconductor. New York: Springer. 2005; 397–420.
66. Triche TJ Jr, Weisenberger DJ, Van Den Berg D, Laird PW, Siegmund KD. Low‑level processing of Illumina Infinium DNA Methylation BeadArrays. Nucleic Acids Res. 2013;41:e90.
67. Dedeurwaerder S, Defrance M, Calonne E, Denis H, Sotiriou C, Fuks F. Evaluation of the Infinium Methylation 450 K technology. Epigenomics. 2011;3:771–84.