S H O R T R E P O R T
Open Access
Different conceptual constructs for modelling
sedentary behaviour and physical activity: the
impact on the correlates of behaviour
Nana Kwame Anokye
1*and Emmanuel Stamatakis
2,3,4Abstract
Background:Research on the correlates of physical activity (PA) and sedentary behaviour (SB) to date has used independent prediction equations for each behaviour, without considering that they are both part of the same continuum of movement. This assumption of independence might lead to inaccurate estimates because common underlying latent variables may simultaneously influence the propensity to engage in PA and SB. This study tests empirically the interdependent nature of PA and SB by comparing independent equations (current approach in the literature), and joint estimators (a novel but unexplored approach). Using Health Survey for England 2008 data, accelerometry-accessed PA and SB were separately modelled (using ordinary least squared regressions - OLS) and then jointly (using seemingly unrelated regressions -SUR). We tested for diagonality, specification, and goodness of fit.
Findings:The best fit models were the ones that allowed for interdependence of the two movement-related behaviours (rho=−0.156;p< 0.001). The SUR showed more favourable properties compared to OLS models; producing lower standard errors and more consistent and efficient coefficients. The efficiency gain was more pronounced in the SB equation (Chi2= 92.75;p< 0.001).
Conclusion:Evidence from a large national population-wide accelerometry study suggests that accounting for the interdependent nature of PA and SB in prediction equations leads to more efficient modelling estimates. Further research using different samples is, however, required to fully understand the magnitude of efficiency gains accruable from using the joint estimators.
Background
Physical activity (PA) is an important health behaviour that is linked to cardiometabolic disease risk including obesity [1]. Sedentary behaviour (SB), any low-energy-expenditure activities (≤1.5 MET) in a sitting or reclining posture (e.g. computer use, watching television, driving a car) [2], has been shown to be linked to health risks, even among people who engage in some PA [3-5]. Research to date has been treating PA and SB as distinct entities, al-though they are part of the same continuum and the above studies [3-5] highlighted some complex interrela-tionships between them.
In the literature, prediction equations for PA and SB have largely been guided by a key assumption that indi-viduals engage in PA and SB at two discrete time points and when they choose to do one they don’t think of the other. In other words, the two behaviours are independ-ent of each other. This has led many analysts to consider single-equation models, regressing for instance time spent on PA and SB separately on potential correlates [6]. As researchers don’t always observe variables that may have synergies between the decisions to engage in PA and SB, such as environmental factors (e.g. neigh-bourhood safety), just accounting for observables to study one behaviour at a time, ignoring the other, may be erroneous. This assumption of independence may be limiting because one could argue that individuals’ time allocation in various activities are optimised by their
* Correspondence:[email protected] 1
Health Economics Research Group (HERG), Brunel University, Uxbridge, Middlesex, London UB8 3PH, UK
Full list of author information is available at the end of the article
satisfaction space and available time. People could know a prioripossible scenarios in which they want to do vari-ous activities and gain a defined level of satisfaction. Pre-dicting equations for PA and SB may therefore be interrelated to some extent and a failure to account for such inter-correlation could lead to inefficient estimates be-cause it does not make optimal use of all available informa-tion [7]. Our earlier empirical work using populainforma-tion-based accelerometry data show a low-to-moderate correlation (rho =−0.28) between moderate to vigorous PA and SB [8], suggesting that this area can be subjected to further empir-ical testing.
In the present study, we empirically tested the inter-dependent nature of PA and SB. We compare two differ-ent modelling frameworks, namely independdiffer-ent equations (which is current approach in the literature), and joint es-timators (which is a promising and novel, but yet unex-plored approach) using objectively-assessed PA and SB.
Methods Data
The data source was the 2008 Health Survey for England (HSE08) which had a special focus on PA and SB. HSE08 was a cross sectional survey that drew a roughly nationally representative sample of people residing in private households in England. The sampling was based on a multi-stage stratified random sampling design that used the postcode address file as a sampling frame. A randomly selected sample of 4,507 adults (16 plus years) wore the accelerometer (Actigraph model GT1M, Pensacola, FL,USA). Respondents were to wear (at the waist) the Actigraph during waking hours for 7 con-secutive days. Daily use was considered ‘valid’ if the Actigraph was worn for at least 10 hours. Kinesoft soft-ware (3.0.98) was used to analyse the raw accelerometry data to generate standardised measures. Further details on the survey and use of accelerometer in the HSE 2008 can be found elsewhere [9].
Like previously [8], moderate to vigorous physical activ-ity (MVPA) was defined as a minutely count of ≥2020 counts/minute and SB was defined as the number of daily minutes with a minutely accelerometry count of <200 counts/minute. We have previously found that in this data-set using different cut off points for sedentary time (e.g. 100 cpm cut point) makes virtually no difference for ana-lysis related to SB [8].
The explanatory factors we included are variables that are commonly correlated with PA and SB [10,11]. These included socio-demographic variables (age, income, sex, education, ethnicity, marital status, employment status, ac-cess to vehicle), household characteristics (number of chil-dren and adults in household), health indicators (having a limiting long-standing illness,), health behaviours (smok-ing and alcohol drink(smok-ing status) and season of the year
participants were measured. At the area level, included correlates were region of residence (strategic health authourity) and urbanisation.
Statistical analysis
Two multivariable modelling frameworks were used to es-timate the factors that are associated with MVPA and SB. First, following the current empirical approach in the lit-erature, separate OLS models were fitted for MVPA and SB respectively, assuming that MVPA and SB are inde-pendent. The estimates from such an approach served as baseline for us to test the joint nature of the two lifestyle choices. The assumption underlying this approach was that the error terms of both equations were not correlated [7]. The second approach fitted a seemingly unrelated re-gression model (SUR), which jointly and simultaneously estimates equations for MVPA and SB. This estimator ac-counts for the correlation between both equations. In practice, the seemingly unrelated model is estimated using two joint linear models that indicate an individual’s par-ticipation in MVPA(Y1) and SB (Y2) correspondingly:
Y1¼X1β1þε1 ð1Þ
Y2¼X2β2þε2 ð2Þ
where X1 and X2 are regressors of PA and SB
respect-ively. X1≠X2and we also require T > Ki(where T = total
observations; Ki= total regressors).
ε¼ ε1;ε2
regressors are assumed to be strictly exogenous:
E εX1;X2
¼0
For any given equation the disturbance is homoscedastic and that the errors terms are uncorrelated across observa-tions but correlated across Eqs. (1) and (2). Therefore:
E ε1ε2X1;X2
¼σ12IT
Comparative analysis of the SUR and OLS was con-ducted with a number of indicators. Using the test for diagonality, Breusch Pagan test, we examined whether SUR compared with the OLS leads to efficiency gain. This test produces a LM statistic that adds the squared correlations between the residual vectors for equations (for MVPA, and SB), with a null hypothesis of diagonality, zero contemporaneous covariance between the distur-bances of the two equations [12]. The size of standard er-rors of estimated parameters of both equations was also compared in relative terms (specified as: (StandardErrorOLS
-StandardErrorSUR/StandardErrorSUR)*100)). The Hausman
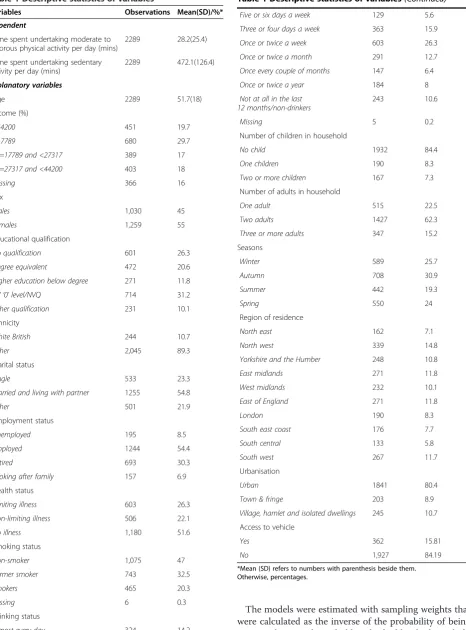
The models were estimated with sampling weights that were calculated as the inverse of the probability of being a respondent in a household multiplied by the household Table 1 Descriptive statistics of variables
Variables Observations Mean(SD)/%*
Dependent
Time spent undertaking moderate to vigorous physical activity per day (mins)
2289 28.2(25.4) Time spent undertaking sedentary
activity per day (mins)
2289 472.1(126.4)
Explanatory variables
Age 2289 51.7(18) Income (%)
>44200 451 19.7
<17789 680 29.7
>/=17789 and <27317 389 17
>/=27317 and <44200 403 18
missing 366 16
Sex
Males 1,030 45
Females 1,259 55
Educational qualification
No qualification 601 26.3
Degree equivalent 472 20.6
Higher education below degree 271 11.8
‘A’/‘0’level/NVQ 714 31.2
Other qualification 231 10.1
Ethnicity
White British 244 10.7
Other 2,045 89.3
Marital status
Single 533 23.3
Married and living with partner 1255 54.8
Other 501 21.9
Employment status
Unemployed 195 8.5
Employed 1244 54.4
Retired 693 30.3
Looking after family 157 6.9
Health status
Limiting illness 603 26.3
Non-limiting illness 506 22.1
No illness 1,180 51.6
Smoking status
Non-smoker 1,075 47
Former smoker 743 32.5
Smokers 465 20.3
Missing 6 0.3
Drinking status
Almost every day 324 14.2
Table 1 Descriptive statistics of variables(Continued)
Five or six days a week 129 5.6
Three or four days a week 363 15.9
Once or twice a week 603 26.3
Once or twice a month 291 12.7
Once every couple of months 147 6.4
Once or twice a year 184 8
Not at all in the last 12 months/non-drinkers
243 10.6
Missing 5 0.2
Number of children in household
No child 1932 84.4
One children 190 8.3
Two or more children 167 7.3
Number of adults in household
One adult 515 22.5
Two adults 1427 62.3
Three or more adults 347 15.2
Seasons
Winter 589 25.7
Autumn 708 30.9
Summer 442 19.3
Spring 550 24
Region of residence
North east 162 7.1
North west 339 14.8
Yorkshire and the Humber 248 10.8
East midlands 271 11.8
West midlands 232 10.1
East of England 271 11.8
London 190 8.3
South east coast 176 7.7
South central 133 5.8
South west 267 11.7
Urbanisation
Urban 1841 80.4
Town & fringe 203 8.9
Village, hamlet and isolated dwellings 245 10.7 Access to vehicle
Yes 362 15.81
No 1,927 84.19
weight which accounts for non-responding households [9]. As individuals are nested within households, the models were estimated with cluster (household identifier) to allow the errors associated with individuals residing in a house-hold to correlate with each other.
The PA data was log-transformed using the default loga-rithmic scale of [u = log10] to improve normality of its dis-tribution. Marginal effects (or elasticity for continuous correlates) were computed to show relative impact of a correlate on MVPA or SB. In the case of equations for MVPA, marginal effects were expressed as exponential values because the associated geometric means (as showed by the marginal effect) arising from log transformed dependent variables has to be converted to the arithmetic mean for comparison with the original data for interpret-ation. The t-test was used to examine whether missing data occurred completely at random. If not at random, missing values for explanatory variables were treated as
separate categories and included in the models in order to avoid biased estimates [13]. The threshold for statistical significance was set at≤5 % in all analyses. Multiple com-parisons were adjusted for using Bonferroni correction. All analyses were undertaken using Stata version 13.
Results
Description of sample
[image:4.595.59.537.343.716.2]Descriptive statistics for the variables are presented in Table 1. A total of 2,289 adults had valid accelerometry data and were included in the analyses. On the average, people spent 28 minutes/day participating in MVPA, and 472 mi-nutes undertaking SB per valid day. The mean age of sam-ple was 52 (SD = 18) years. Most were female (55%), married and living with their partners (55%) and employed (54%). Few were obese (BMI≥30 kg/m2) or current smokers (20%), while the large majority were drinkers (89%), defined as drinking alcohol at once or twice a year.
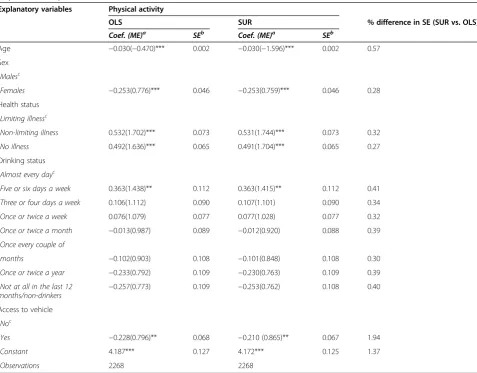
Table 2 Estimation results of seemingly unrelated regression model (SUR) and ordinary least square (OLS): physical activity
Explanatory variables Physical activity
OLS SUR % difference in SE (SUR vs. OLS)
Coef. (ME)a SEb Coef. (ME)a SEb
Age −0.030(−0.470)*** 0.002 −0.030(−1.596)*** 0.002 0.57 Sex
Malesc
Females −0.253(0.776)*** 0.046 −0.253(0.759)*** 0.046 0.28 Health status
Limiting illnessc
Non-limiting illness 0.532(1.702)*** 0.073 0.531(1.744)*** 0.073 0.32
No illness 0.492(1.636)*** 0.065 0.491(1.704)*** 0.065 0.27 Drinking status
Almost every dayc
Five or six days a week 0.363(1.438)** 0.112 0.363(1.415)** 0.112 0.41
Three or four days a week 0.106(1.112) 0.090 0.107(1.101) 0.090 0.34
Once or twice a week 0.076(1.079) 0.077 0.077(1.028) 0.077 0.32
Once or twice a month −0.013(0.987) 0.089 −0.012(0.920) 0.088 0.39
Once every couple of
months −0.102(0.903) 0.108 −0.101(0.848) 0.108 0.30
Once or twice a year −0.233(0.792) 0.109 −0.230(0.763) 0.109 0.39
Not at all in the last 12
months/non-drinkers −
0.257(0.773) 0.109 −0.253(0.762) 0.108 0.40 Access to vehicle
Noc
Yes −0.228(0.796)** 0.068 −0.210 (0.865)** 0.067 1.94
Constant 4.187*** 0.127 4.172*** 0.125 1.37
Observations 2268 2268
a
Coefficient (Marginal Effects/Elasticity);b
Standard Error;c
Only three variables (income, smoking status, and drinking status) had missing observations. ‘Income’had the highest number of missing observations (n= 366), whereas ‘drinking status’ had the lowest (n= 5). Daily MVPA of respondents with missing values were different from those without (income: 26.28(SD = 1.25) vs 28.61 (0.56), p value = 0.107; smoking status: 60.33(SD = 23.41) vs 28.15(0.53), p value = 0.002; drinking status: 76.60(SD = 28.18) vs 28.13(0.53), p value <0.001).
Comparison of modelling frameworks
Tables 2 and 3 show estimates for the results of SUR and OLS models for MVPA, and SB respectively. The MVPA equation was found to be correlated with that of SB equation (r=−0.156; P <0.001), with the Breusch-Pagan test for independence of the residual vectors of both equa-tions suggesting such correlation is not by chance.
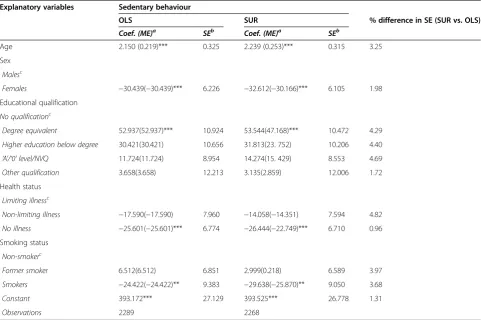
Second, further evidence of efficiency gains via the SUR can be ascertained by comparing standard errors. The magnitude of reduction in standard errors achieved via SUR was found to be relatively more for the estimated pa-rameters of SB equation compared to the MVPA one (see sixth columns of Tables 2 and 3).
Third, the Hausman specification test suggested that for SB, the parameters of the SUR model were systematically different from those of the OLS (Chi2= 92.75; P <0.001) and produced better consistent and efficient estimates. Both models, however, yielded similar coefficients in the case of MVPA. Table 2 shows both SUR and OLS indicate that older individuals, females, and individuals with access to vehicles were associated with lower levels of MVPA. Conversely, individuals who had non-limiting illness (or no illness) undertook more PA per day. Compared with individuals who drank alcohol almost every day, people who drank on 5 or 6 days/week spent more time under-taking MVPA (ME = 1.415 to 1.438). The correlates of SB differed from that of MVPA in terms of type of correlates as well as direction of correlation (when same correlates were found across both behaviours; except for gender). As shown on Table 3, SB was positively correlated with age, and educational qualification. Females, individuals in bet-ter health, and smokers spent less SB time.
Discussion
[image:5.595.57.539.396.716.2]This is the first study, to our knowledge, to conduct an empirical test as to which of the two conceptual
Table 3 Estimation results of seemingly unrelated regression model (SUR) and ordinary least square (OLS): sedentary behaviour
Explanatory variables Sedentary behaviour
OLS SUR % difference in SE (SUR vs. OLS)
Coef. (ME)a SEb Coef. (ME)a SEb
Age 2.150 (0.219)*** 0.325 2.239 (0.253)*** 0.315 3.25 Sex
Malesc
Females −30.439(−30.439)*** 6.226 −32.612(−30.166)*** 6.105 1.98 Educational qualification
No qualificationc
Degree equivalent 52.937(52.937)*** 10.924 53.544(47.168)*** 10.472 4.29
Higher education below degree 30.421(30.421) 10.656 31.813(23. 752) 10.206 4.40
‘A’/‘0’level/NVQ 11.724(11.724) 8.954 14.274(15. 429) 8.553 4.69
Other qualification 3.658(3.658) 12.213 3.135(2.859) 12.006 1.72 Health status
Limiting illnessc
Non-limiting illness −17.590(−17.590) 7.960 −14.058(−14.351) 7.594 4.82
No illness −25.601(−25.601)*** 6.774 −26.444(−22.749)*** 6.710 0.96 Smoking status
Non-smokerc
Former smoker 6.512(6.512) 6.851 2.999(0.218) 6.589 3.97
Smokers −24.422(−24.422)** 9.383 −29.638(−25.870)** 9.050 3.68
Constant 393.172*** 27.129 393.525*** 26.778 1.31
Observations 2289 2268
a
Coefficient (Marginal Effects/Elasticity);b
Standard Error;c
constructs (i.e. whether PA and SB are jointly deter-mined or independent) is likely to be more efficient modelling framework. A search of SCOPUS (largest bib-liographic database) and PUBMED, conducted in May 2014, located no applications of joint estimators for PA and SB, although two previous studies have applied SUR to PA and sport or diet [14,15]. The findings from the ana-lysis in this study showed a contemporaneous correlation between the errors terms of equations for SB and PA, sug-gesting that the two movement behaviours are inter-dependent and hence the utility of the SUR particularly for SB (albeit small efficiency gains).
In addition, the SUR provided relatively less uncertain coefficients than the OLS estimator, especially in the case of SB. Therefore, joint estimators were found in this study to be a more efficient modelling framework than the current approach in the literature (single estimators). Not-ably, if there was no evidence of a contemporaneous cor-relation between the SB and MVPA equations, the SUR would have been equivalent to equation by equation via OLS. Nonetheless, the SUR would have still been worth-while because it has an attractive feature of allowing restric-tions to be imposed and appropriate tests conducted across parameters in the different equations. For example, joint sig-nificance tests for variables that are common to both equa-tions could be undertaken.
Our analysis is not free from an important limitation though; but we judge that the implications of this limita-tion for our conclusions if any are only minimal. For ex-ample, our analysis had unequal observations on which the MVPA and SB equations were estimated (the former had 20 less observations). Noted by McDowell [16], fit-ting a SUR on equations that have varying number of observations could lead to loss of information because observations that are unavailable for both equations are discarded, potentially leading to more uncertain esti-mates. In our case, because the excluded observations were not systematically different from the included ones and fitting the equations on the full set of imputed ob-servations resulted in similar findings, it is unlikely that the current conclusions would change if actual informa-tion were available on those 20 observainforma-tions.
Notwithstanding the limitation, the findings from this study do offer an important consideration for future re-search on SB and PA. The key message here is that to achieve more efficient and tighter estimates, analysis of the correlates of PA and SB in particular ought to use simultaneous joint equations that account for the inter-correlation between PA and SB. Further research using different samples is, however, required to fully under-stand the magnitude of efficiency gains accruable from using the joint estimators. Only by examining this, will we be in a position to accurately determine the import-ance of joint estimators in this area.
Conclusion
This is the first study examining the efficiency gains ac-cruable to joint estimators (e.g. SUR based analysis) into the associated factors of PA and SB. However, it would be important to replicate these results in other datasets in order to provide firmer conclusions on the most ap-propriate modelling framework for analysing PA and SB.
Abbreviations
PA:Physical activity; SB: Sedentary behaviour; SUR: Seemingly unrelated regression; OLS: Ordinary least squares.
Competing interests
The authors declare that they have no competing interests.
Authors’contribution
NKA conceived concept of paper with inputs from ES. Dataset was prepared by both authors. NKA conducted the statistical analysis. Both authors drafted and reviewed the manuscript and approved the final draft. All authors read and approved the final manuscript.
Acknowledgments
We thank UK Data Archive, University of Essex, Colchester for providing us with the 2008 Health Survey for England (HSE) data. The survey was undertaken by National Centre for Social Research and University College London, Department of Epidemiology and Public Health and sponsored by the Information Centre for Health and Social Care. A draft version of this paper was discussed at the Health Economics Research Group’s (HERG) paper day, and we would like to thank participants, in particular Dr Subhash Pokhrel, for their valuable inputs. The views expressed in the publication are those of the authors and not necessarily those of the institutions.
Author details
1Health Economics Research Group (HERG), Brunel University, Uxbridge,
Middlesex, London UB8 3PH, UK.2Exercise and Sport Sciences, Faculty of
Health Sciences, University of Sydney, Sydney, Autralia.3Charles Perkins Centre, University of Sydney, Sydney, Australia.4Physical Activity Research
Group (UCL-PARG), Department of Epidemiology and Public health, University College London, London, UK.
Received: 30 June 2014 Accepted: 12 December 2014 Published: 16 December 2014
References
1. Henson J, Yates T, Biddle SJH, Edwardson CL, Khunti K, Wilmot EG, Gray LJ, Gorely T, Nimmo MA, Davies MJ:Associations of objectively measured sedentary behaviour and physical activity with markers of
cardiometabolic health.Diabetologia2013. doi:10.1007/s00125-013-2845-9. 2. Tremblay MS:Standardized use of the terms "sedentary" and "sedentary
behaviours".Appl Physiol Nutr Metab2012,37:540–542.
3. Chau JY, Grunseit AC, Chey T, Stamatakis E, Brown WJ, Matthews CE, Bauman AE, van der Ploeg HP:Daily sitting time and all-cause mortality: a meta-analysis.PLoS ONE2013,8(11):e80000. doi:10.1371/journal.pone.0080000. 4. Chomistek AK, Manson JE, Stefanick ML, Lu B, Sands-Lincoln M, Going SB,
Garcia L, Allison MA, Sims ST, LaMonte MJ, Johnson KC, Eaton CB:Relationship of sedentary behavior and physical activity to incident cardiovascular disease.J Am Coll Cardiol2013,61:2346–2353.
5. van der Ploeg HP, Chey T, Korda RJ, Banks E, Bauman A:Sitting time and all-cause mortality risk in 222 497 Australian adults.Arch Intern Med2012, 172:494–500.
6. Brodersen NH, Steptoe A, Williamson S, Wardle J:Sociodemographic, developmental, environmental, and psychological correlates of physical activity and sedentary behaviour at age 11 to 12.Ann Behav Med2005, 29:2–11.
7. Greene W:Econometric analysis.Internationalth edition. Pearson Prentice Hall: Upper Saddle River NJ; 2008.
9. Health and Social Care Information Centre on Health Survey for England -2008: physical activity and fitness: Report.London: 2009.
10. Biddle S, Cavill N, Gorely T, Griffiths M, Jago R, Oppert JM, Raats M, Salmon J, Stratton G, Vicente-Rodríguez G, Butland B, Prosser L, Richardson D:Sedentary behaviour and obesity: review of the current scientific evidence.
London: Department of Health; 2010.
11. van Stralen MM, De Vries H, Mudde AN, Bolman C, Lechner L:Determinants of initiation and maintenance of physical activity among older adults: a literature review.Health Psychol Rev2009,3:147–207.
12. Baum CF:An introduction to modern econometrics using Stata.Boston: Stata Press; 2006.
13. Petrou S, Kupek E:Social capital and its relationship with measures of health status: Evidence from the Health Survey for England 2003.
Health Econ2008,17(1):127–143.
14. Villar GJ, Lera-Lopez F, Suarez MJ:Estimation of a structural model of the determinants of the time spent on physical activity and sport: evidence for Spain.J Sports Econ2011,12:515–537.
15. Christian TJ:Trade-Offs between commuting time and health-related activities.J Urban Health2012,89:746–757.
16. McDowell A:From the help desk: seemingly unrelated regression with unbalanced equations.Stata J2004,4:442–448.
doi:10.1186/1756-0500-7-921
Cite this article as:Anokye and Stamatakis:Different conceptual constructs for modelling sedentary behaviour and physical activity: the impact on the correlates of behaviour.BMC Research Notes20147:921.
Submit your next manuscript to BioMed Central and take full advantage of:
• Convenient online submission
• Thorough peer review
• No space constraints or color figure charges
• Immediate publication on acceptance
• Inclusion in PubMed, CAS, Scopus and Google Scholar
• Research which is freely available for redistribution