RESEARCH
Identification of miRNA-mRNA
crosstalk in CD4
+
T cells during HIV-1 infection
by integrating transcriptome analyses
Qibin Liao
1,2†, Jin Wang
1†, Zenglin Pei
1, Jianqing Xu
1,2*and Xiaoyan Zhang
1,2*Abstract
Background: HIV-1-infected long-term nonprogressors (LTNPs) are characterized by infection with HIV-1 more than 7–10 years, but keeping high CD4+ T cell counts and low viral load in the absence of antiretroviral treatment, while loss of CD4+ T cells and high viral load were observed in the most of HIV-1-infected individuals with chronic progres-sors (CPs) However, the mechanisms of different clinical outcomes in HIV-1 infection needs to be further resolved. Methods: To identify microRNAs (miRNAs) and their target genes related to distinct clinical outcomes in HIV-1 infec-tion, we performed the integrative transcriptome analyses in two series GSE24022 and GSE6740 by GEO2R, R, Tar-getScan, miRDB, and Cytoscape softwares. The functional pathways of these differentially expressed miRNAs (DEMs) targeting genes were further analyzed with DAVID.
Results: We identified that 7 and 19 DEMs in CD4+ T cells of LTNPs and CPs, respectively, compared with uninfected controls (UCs), but only miR-630 was higher in CPs than that in LTNPs. Further, 478 and 799 differentially expressed genes (DEGs) were identified in the group of LTNPs and CPs, respectively, compared with UCs. Compared to CPs, four hundred and twenty-four DEGs were identified in LTNPs. Functional pathway analyses revealed that a close connec-tion with miRNA-mRNA in HIV-1 infecconnec-tion that DEGs were involved in response to virus and immune system process, and RIG-I-like receptor signaling pathway, whose DEMs or DEGs will be novel biomarkers for prediction of clinical outcomes and therapeutic targets for HIV-1.
Conclusions: Integrative transcriptome analyses showed that distinct transcriptional profiles in CD4+ T cells are asso-ciated with different clinical outcomes during HIV-1 infection, and we identified a circulating miR-630 with potential to predict disease progression, which is necessary to further confirm our findings in the future.
Keywords: HIV-1, Clinical outcome, Integrative transcriptome analyses
© The Author(s) 2017. This article is distributed under the terms of the Creative Commons Attribution 4.0 International License (http://creativecommons.org/licenses/by/4.0/), which permits unrestricted use, distribution, and reproduction in any medium, provided you give appropriate credit to the original author(s) and the source, provide a link to the Creative Commons license, and indicate if changes were made. The Creative Commons Public Domain Dedication waiver (http://creativecommons.org/ publicdomain/zero/1.0/) applies to the data made available in this article, unless otherwise stated.
Background
HIV-1 infection is characterized by the loss of number and dysfunction of CD4+ T cells and exhibits remark-able differences in clinical outcomes of treatment-naïve individuals [1]. As chronic progressors (CPs) or nor-mal progressors (NPs), the majority of HIV-1-infected patients with progressive virus replication have chronic
loss of CD4+ T cells and develop to AIDS in several years without any antiretroviral therapy (ART) [2, 3]. How-ever, long-term nonprogressors (LTNPs) (≈5% of HIV-1-infected individuals), without progression of AIDS, maintain normal counts of CD4+ T cells (>500 cells/μl) and low viral load (LVL) without ART for many years [4, 5]. Moreover, several studies have found that LTNPs display a higher level of HIV-specific CD4+ and CD8+ T cell responses than that in chronic progressors [6, 7], which greatly slows disease progression to AIDS [5, 8, 9]. Although there are some known protective fac-tors involved inHIV-1 disease progression or pathogen-esis, such as specific protective HLA-B*57/B*27 alleles
Open Access
*Correspondence: xujianqing@shphc.org.cn; zhangxiaoyan@shaphc.org
†Qibin Liao and Jin Wang contributed equally to this work
2 Institutes of Biomedical Sciences, Key Laboratory of Medical Molecular
Virology of Ministry of Education/Health, Fudan University, Shanghai, China
[10], the CCR5delta32 [11] and defective viruses [12] in LTNPs, the mechanisms of nonprogression in HIV-1 infection remains to be further explored.
MiRNAs are a class of small non-coding RNAs with the length of ≈22 nucleotides, which plays important roles in post-transcriptional regulation of genes. MiRNAs func-tion to pair to 3′-untranslated regions (3′-UTR) of target mRNA, and almost all of miRNAs result in decreased target mRNA levels and/or protein translated [13]. MiR-NAs have been demonstrated to suppress HIV-1 via decreasing HIV dependency factors (HDFs), miR-198 targets Cyclin T1 [14], miR-17/92 regulates P300/CBP-associated factor (PCAF) [15], and miR-15a/b, miR-16, miR-20a, miR-93, miR-106b bind to Pur-α and repress its expression [16]. It has also been proposed that miRNAs could either directly bind to HIV-1 RNA or affect cellular factors involved in HIV-1 replication [17]. MiRNAs can also modulate key regulatory molecules related to T cell exhaustion following HIV-1 infection [18]. MiR-9 regu-lates the expression level of Blimp-1 that considered as a T cell exhaustion marker [19], and let-7 miRNAs play a regulatory role in post-transcription of an immune inhib-itory molecule, IL-10 [20]. MiR-125b, miR-150, miR-223, miR-28 and miR-382 [21], and miR-29a [22] have high abundance in resting CD4+ T cells, which contributes to inhibition of HIV-1. Furthermore, several miRNAs in peripheral blood mononuclear cells (PBMC) and plasma can predict the disease progression of HIV-1 infection, such as 31, 200c, 526a, 99a, miR-503 [23], and miR-150 [24]. Therefore, identification of deregulated miRNA expression profiles in different clini-cal outcomes of HIV-1 infection may be useful for fur-ther understanding the possible mechanisms associated with disease progression, pathogenesis and immunologic control.
However, there is no evidence that miRNA-mRNA co-expression profiles in different clinical outcomes of HIV-1 infection. Considering that CD4+ T cells are target cells of HIV-1 and the CD4+ T cell counts is employed to surveiller disease progression, we integrated miRNA and transcriptomic expression profiles data of CD4+ T cells in two series selected from GEO datasets in order to identify miRNA-mRNA crosstalk in HIV-1 infection. We have found numerous HIV-1 disease progression and pathogenesis-associated miRNAs and differentially regu-lated genes, then we constructed functional network of potential miRNA-mRNA pairs. Identification of genetic and/or epigenetic biomarkers may not only facilitate understanding of interaction between HIV-1 and host CD4+ T cells, but lead to develop novel markers for pre-diction of disease progression or therapeutic targets for HIV-1.
Methods
Dataset collection
The series GSE6740 was downloaded from the Gene Expression Omnibus (GEO) datasets (http://www.ncbi. nlm.nih.gov/geo/), contained 15 gene chips from 5 unin-fected controls (UCs), 5 chronic progressors (CPs) and 5 long-term nonprogressors (LTNPs), which was ana-lyzed using the platform, GPL96 (HG-U133A) Affyme-trix Human Genome U133A Array. The series GSE24022 included miRNA microarray data of CD4+ T cells from 8 UCs, 7 LTNPs and 7 CPs, whose platform is Agi-lent-019118 Human miRNA Microarray 2.0 G4470B (miRNA ID version). These samples in the aforementioned series were divided into three comparison groups to per-form subsequent analyses: the group of LTNPs versus UCs, CPs versus UCs, and LTNPs versus CPs, respectively.
Analyses of differentially expressed miRNAs (DEMs) and prediction of target genes
For the aberrantly miRNA expression profile analyses, the web analytical tool, GEO2R, was applied to identify DEMs with fold change (FC) > 2.0 and an adjusted p value <0.01. GEO2R (http://www.ncbi.nlm.nih.gov/geo/ geo2r) is an R-based interactive web tool to identify dif-ferentially expressed genes via analyzing GEO data [25]. There are several softwares for prediction of miRNA targeting genes, but their algorithms are different and each of them has advantages and disadvantages. There-fore, it is necessary to combine with different software to reduce errors or biases. In this study, miRNA target genes were predicted using TargetScan v7.0 (http://www. targetscan.org/) [26] and miRDB v5.0 (http://www.mirdb. org/miRDB) [27]. Both of them utilize the latest miRNA data provided by miRBase v21. To reduce false-positive results, only common genes predicted by both softwares were chosen as target genes of deregulated miRNA for subsequent analysis.
Quality control, data preprocessing and analysis of differentially expressed genes (DEGs)
expressed genes (DEGs), which is a software package for constructing linear regression model [30]. The genes with FC > 1.5 and an adjusted p value <0.05 were regarded as DEGs.
Functional annotation and pathway enrichment analysis The dysregulated genes in different disease stages were extracted as DEGs, which needed further functional annotation. Only genes that exhibited significant expres-sion differences (p value <0.05 and FC > 1.5) were func-tionally annotated. These DEGs were analyzed using Database for Annotation, Visualization, and Integrated Discovery v6.7 (DAVID v6.7) that is a useful bioinformat-ics enrichment tool for GO terms, KEGG pathway, and gene-disease association (http://david.abcc.ncifcrf.gov/) [31]. To functionally annotate DEGs identified by the aforementioned three comparison groups, Kyoto Ency-clopedia of Genes and Genomes (KEGG) pathway and Gene Ontology (GO) were analyzed with DAVID v6.7 [32]. Cytoscape (http://www.cytoscape.org/) was used in miRNA-mRNA network analysis [33].
Results
Identification of DEMs for prediction of disease progression during HIV‑1 infection
Through a comprehensive analysis of miRNA expres-sion profiling in different disease stages following HIV-1
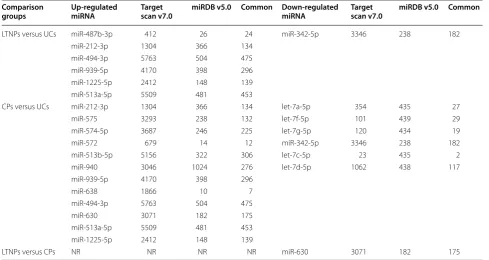
infection, a list of aberrantly expressed miRNAs was included (Table 1). With at least twofold change and FDR-adjust p value of <0.01, we identified that 7 differ-entially expressed miRNAs (DEMs) in LTNPs, whose miR-342 was down-regulated and 6 miRNAs (miR-487b, miR-212, miR-494, miR-939, miR-1225 and miR-513a) were overexpressed in the LTNPs, compared with UCs, except of miR-768-5p because it overlaps an annotated snoRNA (HBII-239). Twenty DEMs were identified between CPs and UCs. Twelve miRNAs were higher and 7 DEMs were down-regulated in UCs, compared with CPs, whereas miR-923 that appeared to be a frag-ment of the 28S rRNA was removed, and miR-768-5p overlapped an annotated snoRNA (HBII-239) was not included. However, only miR-487b was overexpressed in LTNPs when 5 up-regulated miRNAs that also found in the group of CPs versus UCs were excluded. In addi-tion, only miR-630 showed significantly differential expression among LTNPs, UCs and CPs, and the expres-sion level of miR-630 was higher in CPs than that in LTNPs and UCs. It is well known that miR-630 relates to tumor cell growth, proliferation and metastasis [34, 35], involves in growth arrest of cancer cells [36], and can server as a prognostic marker for colorectal cancer [37] and gastric cancer [38], which implies that miR-630 may be a potential biomarker for prediction of disease pro-gression during HIV-1 infection.
Table 1 Aberrantly expressed miRNAs and their predicted target gene numbers
LTNPs long-term nonprogressors, UCs uninfected controls, CPs chronic progressors, NR not report
Comparison
groups Up‑regulated miRNA Target scan v7.0 miRDB v5.0 Common Down‑regulated miRNA Target scan v7.0 miRDB v5.0 Common
LTNPs versus UCs miR-487b-3p 412 26 24 miR-342-5p 3346 238 182 miR-212-3p 1304 366 134
miR-494-3p 5763 504 475 miR-939-5p 4170 398 296 miR-1225-5p 2412 148 139 miR-513a-5p 5509 481 453
CPs versus UCs miR-212-3p 1304 366 134 let-7a-5p 354 435 27 miR-575 3293 238 132 let-7f-5p 101 439 29 miR-574-5p 3687 246 225 let-7g-5p 120 434 19 miR-572 679 14 12 miR-342-5p 3346 238 182 miR-513b-5p 5156 322 306 let-7c-5p 23 435 2 miR-940 3046 1024 276 let-7d-5p 1062 438 117 miR-939-5p 4170 398 296
miR-638 1866 10 7 miR-494-3p 5763 504 475 miR-630 3071 182 175 miR-513a-5p 5509 481 453 miR-1225-5p 2412 148 139
[image:3.595.55.545.455.715.2]Analyses of the gene expression profiles of DEMs predicted target genes
Firstly, TargetScan v7.0 and miRDB v5.0 were used to predict deregulated miRNA target genes, and the com-mon genes in both software were chosen. Totally, 1703 common genes were predicted as 7 DEMs target genes in the group of LTNPs versus UCs; 3006 common genes were predicted for 18 DEMs in the group of CPs versus UCs; and 175 target genes in the group of LTNPs versus CPs (Table 1).
After allowing for overlap between groups, 2629 target genes were predicted from differentially expressed miR-NAs, however, the predicted target gene expression pro-files still needed to be analyzed in order to elucidate the real miRNA-mRNA relationships in a pairwise manner. Next, we downloaded the series GSE6740 to perform identification of DEGs and functional annotation. To avoid the potential biases caused by inadequate quality of DNA array, both RLE and NUSE box plots were used to check the quality of these DNA arrays. Two DNA arrays
GSM155202 (C102, Fig. 1b-1) and GSM155224 (L128,
Fig. 1b-2) were excluded by the NUSE box plots analysis because of the arrays quality problems, which were not suitable for subsequent analysis. Finally, the gene expres-sion profiles were divided into three different comparison groups, LTNPs versus UCs, CPs versus UCs, and LTNPs versus CPs, respectively. We identified that 478 genes were differentially expressed in LTNPs and 9 genes (RHOB, NCOA6, ATP8B1, CCL4, SEC31B, PTGER2, AVPR1B, MPI, and LOC285830) were up-regulated in LTNPs, compared with UCs. Besides, 799 differentially expressed genes (DEGs) were identified in the group of CPs versus UCs, and 424 DEGs were found in the comparison group of LTNPs versus CPs. It’s worth noting that 184 unique DEGs were only identified in the group of LTNPs ver-sus CPs, including 38 up-regulated genes in LTNPs, such as CCL22, LILRB3, CCL7/MCP-3, TRAP1, TUBB1 and KLRG1; and 146 down-regulated genes, such as TMPO, BST2, RBX1, CCNA2, OAS2, FOXM1, EZH2, PAFF1, and so on, which may be involved in disease progression dur-ing HIV-1 infection (Additional file 2).
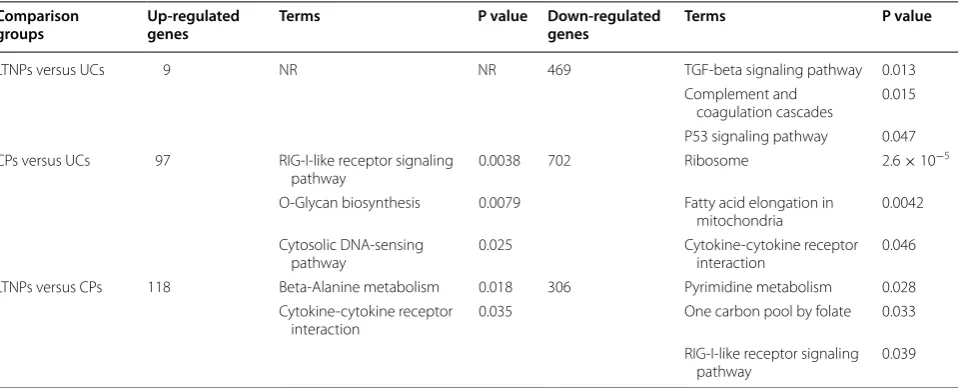
Functional pathway analysis of DEGs in HIV‑1 infection GO and KEGG pathway analyses were performed with DAVID v6.7 to analyzed the differentially expressed genes (Additional file 1), which revealed that the DEGs between LTNPs and UCs were significantly enriched in plasma membrane, cytoplasm and nucleoplasm, including 9
up-regulated genes (RHOB, NCOA6, ATP8B1, CCL4, SEC31B, PTGER2, AVPR1B, MPI, and LOC285830), which involved in plasma membrane part (GO:0044459, p value = 0.016) and plasma membrane (GO:0005886, p value = 0.022). Further, gene ontology biological process (GO BP) analysis indicated that, compared to UCs, DEGs were significantly enriched in CPs’ immune system pro-cess (GO:0002376, p value = 1.6 × 10⁻⁸), defense response (GO:0006952, p value = 6.1 × 10⁻⁵), response to other organism (GO: 0051707, p value = 3.3 × 10⁻¹³), response to biotic stimulus (GO: 0009607, p value = 2.7 × 10⁻¹²), response to virus (GO: 0009615, p value = 9.2 × 10⁻⁹), response to external stimulus (GO:0006954, p value = 2.6 × 10⁻⁵), and inflammatory response (GO:0006954, p value = 6.6 × 10⁻⁶). Additionally, GO BP analysis showed that DEGs between CPs and LTNPs were related to immune system process (GO:0002376, p value = 8.5 × 10⁻⁵), response to other organism (GO: 0051707, p value = 2.5 × 10⁻⁶), response to biotic stimu-lus (GO: 0009607, p value = 9.9 × 10⁻⁶), response to virus (GO: 0009615, p value = 2.5 × 10⁻⁶), response to external stimulus (GO:0006954, p value = 4.1 × 10⁻⁴), and inflam-matory response (GO:0006954, p value = 7.1 × 10⁻⁵), (Additional file 1). These results indicated that, in the CPs group, excessive immune activation may accelerate dis-ease progression in chronic infection (genes: OAS1, ISG15, IFIT1, IFI27, IFI44L, and so on. Additional file 2). Further-more, the DEGs between different groups were also sub-jected to KEGG pathway enrichment analysis. The KEGG pathway, RIG-I-like receptor signaling pathway was sig-nificantly enriched in CPs, compared to UCs (hsa04622, p value = 0.0038), and LTNPs (hsa04622, p value = 0.0039), revealing excessive innate immune response (genes: AZI2, DDX58, ISG15 and IRF7) in chronic infection compared to that in nonprogression or negative infection (Table 2).
Screening of inversely correlated miRNA‑mRNA pair candidates
Potential target genes identified based on microarray gene expression profiles were included in miRNA-mRNA crosstalk analysis if they met the two following crite-ria: (1) the expression level of miRNA and target genes are inversely correlated, because miRNAs function to degrade mRNA and/or inhibition of mRNA transla-tion; (2) and the expression of target genes showed at least 1.5-fold change in different comparison groups, and an adjusted p value <0.05. Compared to UCs, we acquired 34 putative down-regulated target genes from
(See figure on next page.)
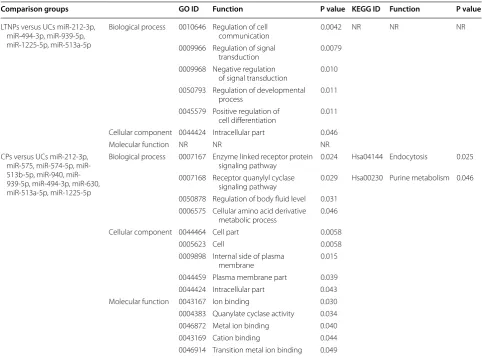
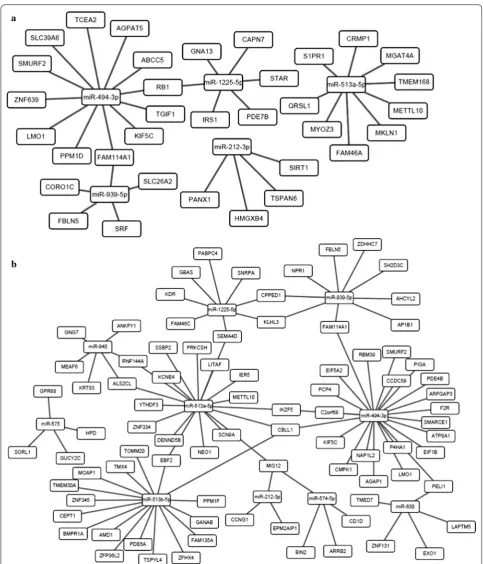
up-regulated miRNAs that were identified in LTNPs, and 84 underexpressed genes in CPs (Additional file 2). The functional annotation of putative target genes showed differentially enriched GO terms between LTNPs and CPs. The highly enriched BP terms include regulation of cell communication (GO: 0010646), regulation of sig-nal transduction (GO: 0009966), negative regulation of signal transduction (GO: 0009968), regulation of devel-opmental process (GO: 0050793), and positive regula-tion of cell differentiaregula-tion (GO: 0045579) in LTNPs but not UCs, while enzyme linked receptor protein signaling pathway (GO: 0007167), receptor quanylyl cyclase sign-aling pathway (GO: 0007168), regulation of body fluid level (GO: 0050878), and cellular amino acid derivative metabolic process (GO: 0006575) were enriched in CPs but not UCs. In addition, the most enriched MF terms were ion binding (GO: 0043167), quanylate cyclase activ-ity (GO: 0004383), metal ion binding (GO: 0046872), and cation binding (GO: 0043169) were in CPs, and KEGG pathway analysis found two pathways endocytosis and purine metabolism, indicating miRNA-regulated genes may be involved in metabolism of chronic progressors (Table 3). After combining the gene expression profiles of the miRNA-mRNA pair candidates, the interactive net-works of putative miRNA-mRNA pairs constructed with Cytoscape were shown in Fig. 2 and Additional file 3.
Discussion
In our study, we firstly analyzed the differentially miR-NAs profiles in LTNPs, CPs and UCs. Based on the cut-off value at >twofold change and the p value at <0.01, we investigated that 6 miRNAs were differentially expressed both in LTNPs and CPs, miR-342-5p (↓), miR-212-3p
(↑), miR-494-3p (↑), miR-939-5p (↑), miR-1225-5p (↑), an miR-513a-5p (↑) in LTNPs and CPs, compared with UCs, indicating these deregulated miRNAs may be
HIV-1-specific miRNAs of CD4+ T cells following HIV-1
infection. We also found that the expression levels of 575, 574-5p, 572, 513b-5p, miR-940 and miR-638 were higher in CPs than that in UCs, although they were not altered between LTNPs and CPs. Previous evidence indicated that suppressor of cytokine signaling 1 (SOCS1) protein is a target of miR-572 [39], and Miller et al. [40] have found that the expression level of suppressor of cytokine signaling 1 (SOCS1) protein in CD4+ T cells is lower in HIV-1 infected patients than that in healthy people, but SOCS1 mRNA level is higher in HIV-1 infection, indicating miR-572 may be related to sustained immune activation that promoted disease pro-gression and pathogenesis following HIV-1 infection by directly targeting SOCS1. Besides, miR-940 can inhibit the growth of pancreatic ductal adenocarcinoma via tar-geting MyD88 [41] that involved in IL-33 mediated type 1 helper T cells (Th1) differentiation [42] (Th1 is pivotal in cellular immunity). We confirmed that let-7 family was down-regulated in CPs compared with UCs, which is consistent to findings of Swaminathan et al. [20].
Next, we applied TargetScan v7.0 and miRDB v5.0 to predict target genes of differentially expressed miRNAs and 2629 unique target genes predicted from three dif-ferent comparison groups. Transcriptomic analysis of ex vivo CD4+ T cells from different clinical outcomes dur-ing HIV-1 infection, like LTNPs and CPs, we also found higher expression level of interferon-stimulated genes (ISGs), such as ISG-15 [43–45], IFI44, IFI44L, HERC6, IFI6, and so on, in CPs [46], indicating chronic immune Table 2 Enrichment of KEGG pathways with p < 0.05
KEGG Kyoto encyclopedia of genes and genomes, NR not report
Comparison
groups Up‑regulated genes Terms P value Down‑regulated genes Terms P value
LTNPs versus UCs 9 NR NR 469 TGF-beta signaling pathway 0.013 Complement and
coagulation cascades 0.015 P53 signaling pathway 0.047 CPs versus UCs 97 RIG-I-like receptor signaling
pathway 0.0038 702 Ribosome 2.6 × 10
−5
O-Glycan biosynthesis 0.0079 Fatty acid elongation in
mitochondria 0.0042 Cytosolic DNA-sensing
pathway 0.025 Cytokine-cytokine receptor interaction 0.046 LTNPs versus CPs 118 Beta-Alanine metabolism 0.018 306 Pyrimidine metabolism 0.028
Cytokine-cytokine receptor
interaction 0.035 One carbon pool by folate 0.033 RIG-I-like receptor signaling
[image:6.595.59.548.101.295.2]activation, which is also differentially expressed between pathogenic (rhesus macaques [47–49]) and non-patho-genic (sooty mangabeys [50] or African green monkeys [51]) SIV infection, demonstrated by highly enriched GO terms and KEGG pathways, including response to virus (GO: 0009615), immune system process (0002376), and RIG-I-like receptor signaling pathway (hsa04622). Our findings confirm earlier studies that showed that a chronic interferon response or immune activation contributed to CD4+ T cells loss, pathogenesis and immune exhaustion in HIV-1 chronic infection [43, 44, 52, 53]. Moreover, it has been shown that immune inhibitory molecules, including LAG-3 [54] and CD160 [55], have higher levels in CPs than in LTNPs and UCs and are involved in immune exhaus-tion that accelerated HIV-1 disease progression. Addiexhaus-tion- Addition-ally, we also identified 184 unique DEGs in LTNPs, which were involved in HIV/AIDS disease control or progres-sion, including 38 up-regulated genes such as CCL22 (a soluble HIV-suppressive factor [56], LILRB3 (related to immune protection for HIV-1 infection) [57] and CCL7/
MCP-3 (competed for HIV-1 gp120 binding) [58], and 146 down-regulated genes such as TMPO (involved in HIV-1 Tat-induced apoptosis of T cells) [59], BST2 (increased in SIV-infected rhesus monkeys) [60], RBX1 (involved in pro-teasomal degradation of APOBEC3G) [61], CCNA2 (con-tributed to loss of SAMHD1 ability to inhibit HIV-1) [62] and some unreported genes such as FOXM1, EZH2 and PAFF1 (Additional file 2).
Further, we analyzed negatively correlated miRNA-mRNA pair candidates, and the potential target genes were selected from the series GSE6740. We identified that thirty-four deregulated target genes with 5 up-regulated miRNAs were identified from the group of LTNPs ver-sus UCs, and eighty-four repressed target genes from 10 up-regulated miRNAs in the group of LTNPs versus UCs, whose expression of miRNA and target genes showed negative correlation. The functional annotation revealed that miRNA-regulated genes may be involved in meta-bolic processes in chronic infection. There are several studies that have shown that down-regulation of CPPED1 Table 3 Functional annotation of putative target genes with p < 0.05
KEGG Kyoto encyclopedia of genes and genomes, NR not report
Comparison groups GO ID Function P value KEGG ID Function P value
LTNPs versus UCs miR-212-3p, miR-494-3p, miR-939-5p, miR-1225-5p, miR-513a-5p
Biological process 0010646 Regulation of cell
communication 0.0042 NR NR NR 0009966 Regulation of signal
transduction 0.0079 0009968 Negative regulation
of signal transduction 0.010 0050793 Regulation of developmental
process 0.011 0045579 Positive regulation of
cell differentiation 0.011 Cellular component 0044424 Intracellular part 0.046 Molecular function NR NR NR CPs versus UCs miR-212-3p,
575, 574-5p, 513b-5p, 940, miR-939-5p, miR-494-3p, miR-630, miR-513a-5p, miR-1225-5p
Biological process 0007167 Enzyme linked receptor protein
signaling pathway 0.024 Hsa04144 Endocytosis 0.025 0007168 Receptor quanylyl cyclase
signaling pathway 0.029 Hsa00230 Purine metabolism 0.046 0050878 Regulation of body fluid level 0.031
0006575 Cellular amino acid derivative metabolic process 0.046 Cellular component 0044464 Cell part 0.0058
0005623 Cell 0.0058 0009898 Internal side of plasma
[image:7.595.56.539.100.457.2]Fig. 2 Genetic interactive networks for miRNA/mRNA pair candidates. a miRNA-mRNA interaction network from the group of LTNPs versus UCs;
[image:8.595.56.540.84.649.2]expression improves glucose metabolism in adipocyte [63]; PCP4 plays an anti-apoptotic role in human breast cancer cells [64], and CBLL1 promotes cell prolifera-tion in the early stages of tumor progression [65], whose genes were deregulated in CD4+ T cells of HIV-1-infected chronic progressors in our current study. We also dem-onstrate that the putative miRNA-mRNA pair candidates are involved in disease progression and pathogenesis. Inhibitory cytokine IL-10 contributes to dysregulated cytotoxic T cell function to HIV-1 infection, and IL-10 was verified to be the target gene of let-7 [20], which was down-regulated in CPs, compared with UCs. We have found that dysregulated CD100 in chronic HIV-1 infec-tion, which is the putative target gene of miR-1225a-5p or miR-513a-5p. Loss of Sema4D/CD100 expression plays key roles in dysfunctional immunity during HIV-1 infec-tion [66]. As the positive modulator of cellular apoptosis [67], MOAP1 was down-regulated in chronic infection, which implied that HIV-1 might employ cellular miRNAs to support persistent infection. The ubiquitin ligase Peli1 encoded by PELI1 inversely regulated T lymphocyte acti-vation [68], whose expression level was decreased in our study, partly indicating hyperactivation of CD4+ T cells related to pathogenesis in HIV-1 infection [69].
However, we understood that there were limitations in our bioinformatics-based study. There were only 22 subjects (7 LTNPs, 7 CPs and 8 health controls) in the series of GSE24022 for miRNAs analysis and 13 sub-jects (4 LTNPs, 4CPs and 5 normal controls) in the series GSE6740 for DEGs. It is necessary to recruit more sub-jects in the future. We also recognized that there were a few differences between two series including the duration of infection, the definitions of disease stages of HIV-1 infection and chronic progression, viral load and CD4+ T cell counts. Therefore, it is necessary to be confirmed whether the level of deregulated miRNAs and putative target genes expression is actually altered in distinct dis-ease progression of HIV-1 infection. The bioinformatics-based methods to obtain disease progression-related gene expression profiles and the interactive networks of miRNA-mRNA pair candidates via integrative analysis of miRNA-mRNA expression should be applied in inte-grative analyses of miRNA-mRNA expression profiles in different stages of HIV-1 infection, which will not only facilitate the understanding of the genetic basis of inter-action between HIV-1 and host cells, but lead to the development of genetic markers for prediction of disease progression and therapy of HIV-1 in the future.
Conclusions
In summary, our integrative bioinformatics study showed that distinct transcriptional profiles in CD4+ T cells, includ-ing microRNAs and mRNAs, associated with different
disease progression during HIV-1 infection, and identified a potential biomarker, miR-630, that may be employed to predict disease progression in HIV-1 infection.
Abbreviations
HIV-1: human immunodeficiency virus 1; AIDS: acquired immunodeficiency syndrome; LTNP: long-term nonprogressor; UC: uninfected control; NP: normal progressor; CP: chronic progressor; ART: antiretroviral therapy; LVL: low viral load; DAVID: database for annotation, visualization and integrated discovery; GEO: gene expression omnibus; miRNA: microRNA; LncRNA: long non-coding RNA; HDF: HIV dependency factors; PCAF: P300/CBP-associated factor; PBMC: peripheral blood mononuclear cell; DEM: differentially expressed miRNA; DEG: differentially expressed gene; GO: gene ontology; BP: biological process; MF: molecular function; CC: cellular component; KEGG: kyoto encyclopedia of genes and genomes; PLE: relative log expression; NUSE: normalized unscaled standard error; RMA: robust multi-array average; LIMMA: linear models for microarray data; FC: fold-change; SOCS1: suppressor of cytokine signaling 1; MyD88: myeloid differentiation factor 88; ISG: interferon-stimulated gene; ISG-15: interferon-stimulated gene 15; IFI44: interferon induced protein 44; IFI44L: interferon induced protein 44 like; HERC6: HECT and RLD domain containing E3 ubiquitin protein ligase family member 6; IFI6: interferon induced protein 6; Th1: type 1 helper T cell; CPPED1: calcineurin like phosphoesterase domain containing 1; PCP4: purkinje cell protein 4; CBLL1: cbl proto-oncogene like 1; Sema4D: semaphoring 4D; MOAP1: modulator of apoptosis 1.
Authors’ contributions
Conceived and designed the experiments: JW, XYZ. Performed the experi-ments: QBL, JW. Analyzed the data: QBL, JW. Contributed reagents/materials/ analysis tools: QBL, JW, ZLP, JQX. Wrote the paper: QBL, JW. All authors read and approved the final manuscript.
Author details
1 Shanghai Public Health Clinical Center, Fudan University, Shanghai, China. 2 Institutes of Biomedical Sciences, Key Laboratory of Medical Molecular
Virol-ogy of Ministry of Education/Health, Fudan University, Shanghai, China.
Acknowledgements
We gratefully appreciate Dr. Tong Pan’s help in discussion (Department of Bio-informatics and Computational Biology, The University of Texas MD Anderson Cancer Center, Houston, TX, 77030).
Competing interests
The authors declare that they have no competing interests.
Availability of data and materials
The datasets generated during and/or analyzed during the current study are available in the Gene Expression Omnibus (GEO) datasets (http://www.ncbi. nlm.nih.gov/geo/).
Funding
This work was supported by Chinese National Basic Research Key Pro-ject (2014CB542502) and National Natural Science Foundation of China (81561128008).
Received: 22 August 2016 Accepted: 3 February 2017 Additional files
Additional file 1. Classification of DEGs according to GO terms with p < 0.05.
Additional file 2. Differentially expressed genes identified from the series GSE6740.
References
1. Carrington M, Walker BD. Immunogenetics of spontaneous control of HIV. Annu Rev Med. 2012;63:131–45. doi:10.1146/ annurev-med-062909-130018.
2. O’Connell KA, Rabi SA, Siliciano RF, Blankson JN. CD4+ T cells from
elite suppressors are more susceptible to HIV-1 but produce fewer virions than cells from chronic progressors. Proc Natl Acad Sci USA. 2011;108(37):E689–98. doi:10.1073/pnas.1108866108.
3. Shen X, Nair B, Mahajan SD, Jiang X, Li J, Shen S, et al. New insights into the disease progression control mechanisms by comparing long-term-nonprogressors versus normal-progressors among HIV-1-positive patients using an ion current-based MS1 proteomic profiling. J Proteome Res. 2015;14(12):5225–39. doi:10.1021/acs.jproteome.5b00621. 4. Pantaleo G, Fauci AS. New concepts in the immunopathogenesis of HIV
infection. Annu Rev Immunol. 1995;13:487–512. doi:10.1146/annurev. iy.13.040195.00241-5.
5. Dyer WB, Zaunders JJ, Yuan FF, Wang B, Learmont JC, Geczy AF, et al. Mechanisms of HIV non-progression; robust and sustained CD4+ T-cell
proliferative responses to p24 antigen correlate with control of viraemia and lack of disease progression after long-term transfusion-acquired HIV-1 infection. Retrovirology. 2008;5:112. doi:10.1186/1742-4690-5-112. 6. Brenchley JM, Hill BJ, Ambrozak DR, Price DA, Guenaga FJ, Casazza JP, et al.
T-cell subsets that harbor human immunodeficiency virus (HIV) in vivo: implications for HIV pathogenesis. J Virol. 2004;78(3):1160–8.
7. Petrovas C, Mueller YM, Katsikis PD. HIV-specific CD8+ T cells: serial killers
condemned to die? Curr HIV Res. 2004;2(2):153–62.
8. Martinez V, Costagliola D, Bonduelle O, N’go N, Schnuriger A, Theodorou I, et al. Combination of HIV-1-specific CD4 Th1 cell responses and IgG2 antibodies is the best predictor for persistence of long-term nonprogres-sion. J Infect Dis. 2005;191(12):2053–63. doi:10.1086/430320.
9. Pancre V, Delhem N, Yazdanpanah Y, Delanoye A, Delacre M, Depil S, et al. Presence of HIV-1 Nef specific CD4 T cell response is associated with non-progression in HIV-1 infection. Vaccine. 2007;25(31):5927–37. doi:10.1016/j.vaccine.2007.05.038.
10. Descours B, Avettand-Fenoel V, Blanc C, Samri A, Melard A, Supervie V, et al. Immune responses driven by protective human leukocyte antigen alleles from long-term nonprogressors are associated with low HIV reser-voir in central memory CD4 T cells. Clin Infect Dis. 2012;54(10):1495–503. doi:10.1093/cid/cis188.
11. Dean M, Carrington M, Winkler C, Huttley GA, Smith MW, Allikmets R, et al. Genetic restriction of HIV-1 infection and progression to AIDS by a deletion allele of the CKR5 structural gene. Hemophilia Growth and Development Study, Multicenter AIDS Cohort Study, Multicenter Hemo-philia Cohort Study, San Francisco City Cohort, ALIVE Study. Science. 1996;273(5283):1856–62.
12. Lin PH, Lai CC, Yang JL, Huang HL, Huang MS, Tsai MS, et al. Slow immu-nological progression in HIV-1 CRF07_BC-infected injecting drug users. Emerg Microbes Infect. 2013;2(12):e83. doi:10.1038/emi.2013.83. 13. Guo H, Ingolia NT, Weissman JS, Bartel DP. Mammalian
microR-NAs predominantly act to decrease target mRNA levels. Nature. 2010;466(7308):835–40. doi:10.1038/nature09267.
14. Sung TL, Rice AP. miR-198 inhibits HIV-1 gene expression and replication in monocytes and its mechanism of action appears to involve repression of cyc-lin T1. PLoS Pathog. 2009;5(1):e1000263. doi:10.1371/journal.ppat.1000263. 15. Triboulet R, Mari B, Lin YL, Chable-Bessia C, Bennasser Y, Lebrigand K, et al.
Suppression of microRNA-silencing pathway by HIV-1 during virus repli-cation. Science. 2007;315(5818):1579–82. doi:10.1126/science.1136319. 16. Shen CJ, Jia YH, Tian RR, Ding M, Zhang C, Wang JH. Translation of
Pur-alpha is targeted by cellular miRNAs to modulate the differentiation-dependent susceptibility of monocytes to HIV-1 infection. FASEB J. 2012;26(11):4755–64. doi:10.1096/fj.12-209023.
17. Swaminathan G, Navas-Martin S, Martin-Garcia J. MicroRNAs and HIV-1 infection: antiviral activities and beyond. J Mol Biol. 2014;426(6):1178–97. doi:10.1016/j.jmb.2013.12.017.
18. Swaminathan S, Kelleher AD. MicroRNA modulation of key targets associated with T cell exhaustion in HIV-1 infection. Curr Opin HIV AIDS. 2014;9(5):464–71. doi:10.1097/coh.0000000000000089.
19. Seddiki N, Phetsouphanh C, Swaminathan S, Xu Y, Rao S, Li J, et al. The microRNA-9/B-lymphocyte-induced maturation protein-1/IL-2 axis is differentially regulated in progressive HIV infection. Eur J Immunol. 2013;43(2):510–20. doi:10.1002/eji.201242695.
20. Swaminathan S, Suzuki K, Seddiki N, Kaplan W, Cowley MJ, Hood CL, et al. Differential regulation of the Let-7 family of microRNAs in CD4+ T cells
alters IL-10 expression. J Immunol. 2012;188(12):6238–46. doi:10.4049/ jimmunol.1101196.
21. Huang J, Wang F, Argyris E, Chen K, Liang Z, Tian H, et al. Cellular microR-NAs contribute to HIV-1 latency in resting primary CD4+ T lymphocytes.
Nat Med. 2007;13(10):1241–7. doi:10.1038/nm1639.
22. Nathans R, Chu CY, Serquina AK, Lu CC, Cao H, Rana TM. Cellular microRNA and P bodies modulate host-HIV-1 interactions. Mol Cell. 2009;34(6):696–709. doi:10.1016/j.molcel.2009.06.003.
23. Zhang ZN, Xu JJ, Fu YJ, Liu J, Jiang YJ, Cui HL, et al. Transcriptomic analysis of peripheral blood mononuclear cells in rapid progressors in early HIV infection identifies a signature closely correlated with disease progres-sion. Clin Chem. 2013;59(8):1175–86.
24. Munshi SU, Panda H, Holla P, Rewari BB, Jameel S. MicroRNA-150 is a potential biomarker of HIV/AIDS disease progression and therapy. PLoS ONE. 2014;9(5):e95920. doi:10.1371/journal.pone.0095920.
25. Barrett T, Wilhite SE, Ledoux P, Evangelista C, Kim IF, Tomashevsky M, et al. NCBI GEO: archive for functional genomics data sets–update. Nucleic Acids Res. 2013;41:D991–5. doi:10.1093/nar/gks1193.
26. Agarwal V, Bell GW, Nam JW, Bartel DP. Predicting effective microRNA target sites in mammalian mRNAs. Elife. 2015;. doi:10.7554/eLife.05005. 27. Wang X. miRDB: a microRNA target prediction and functional
annota-tion database with a wiki interface. RNA. 2008;14(6):1012–7. doi:10.1261/ rna.965408.
28. Wilson CL, Pepper SD, Hey Y, Miller CJ. Amplification protocols introduce systematic but reproducible errors into gene expression studies. Biotech-niques. 2004;36(3):498–506.
29. Irizarry RA, Hobbs B, Collin F, Beazer-Barclay YD, Antonellis KJ, Scherf U, et al. Exploration, normalization, and summaries of high density oligonucleotide array probe level data. Biostatistics. 2003;4(2):249–64. doi:10.1093/biostatistics/4.2.249.
30. Smyth GK. Linear models and empirical bayes methods for assessing dif-ferential expression in microarray experiments. Stat Appl Genet Mol Biol. 2004;3:3. doi:10.2202/1544-6115.1027.
31. da Huang W, Sherman BT, Lempicki RA. Bioinformatics enrichment tools: paths toward the comprehensive functional analysis of large gene lists. Nucleic Acids Res. 2009;37(1):1–13. doi:10.1093/nar/gkn923.
32. Ashburner M, Ball CA, Blake JA, Botstein D, Butler H, Cherry JM, et al. Gene ontology: tool for the unification of biology: the Gene Ontology consor-tium. Nat Genet. 2000;25(1):25–9. doi:10.1038/75556.
33. Cline MS, Smoot M, Cerami E, Kuchinsky A, Landys N, Workman C, et al. Integration of biological networks and gene expression data using Cytoscape. Nat Protoc. 2007;2(10):2366–82. doi:10.1038/nprot.2007.324. 34. Cao JX, Lu Y, Qi JJ, An GS, Mao ZB, Jia HT, et al. MiR-630 inhibits prolifera-tion by targeting CDC7 kinase, but maintains the apoptotic balance by targeting multiple modulators in human lung cancer A549 cells. Cell Death Dis. 2014;5:e1426. doi:10.1038/cddis.2014.386.
35. Song YF, Hong JF, Liu DL, Lin QA, Lan XP, Lai GX. miR-630 targets LMO3 to regulate cell growth and metastasis in lung cancer. Am J Transl Res. 2015;7(7):1271–9.
36. Sakurai MA, Ozaki Y, Okuzaki D, Naito Y, Sasakura T, Okamoto A, et al. Gefitinib and luteolin cause growth arrest of human prostate cancer PC-3 cells via inhibition of cyclin G-associated kinase and induction of miR-630. PLoS ONE. 2014;9(6):e100124. doi:10.1371/journal.pone.0100124. 37. Chu D, Zheng J, Li J, Li Y, Zhang J, Zhao Q, et al. MicroRNA-630 is a
prognostic marker for patients with colorectal cancer. Tumour Biol. 2014;35(10):9787–92. doi:10.1007/s13277-014-2223-3.
38. Chu D, Zhao Z, Li Y, Li J, Zheng J, Wang W, et al. Increased microRNA-630 expression in gastric cancer is associated with poor overall survival. PLoS ONE. 2014;9(3):e90526. doi:10.1371/journal.pone.0090526.
39. Zhang X, Liu J, Zang D, Wu S, Liu A, Zhu J, et al. Upregulation of miR-572 transcriptionally suppresses SOCS1 and p21 and contributes to human ovarian cancer progression. Oncotarget. 2015;6(17):15180–93. doi:10.18632/oncotarget.3737.
40. Miller RC, Schlaepfer E, Baenziger S, Crameri R, Zeller S, Byland R, et al. HIV interferes with SOCS-1 and -3 expression levels driving immune activa-tion. Eur J Immunol. 2011;41(4):1058–69. doi:10.1002/eji.201041198. 41. Song B, Zhang C, Li G, Jin G, Liu C. MiR-940 inhibited pancreatic ductal
• We accept pre-submission inquiries
• Our selector tool helps you to find the most relevant journal
• We provide round the clock customer support
• Convenient online submission
• Thorough peer review
• Inclusion in PubMed and all major indexing services
• Maximum visibility for your research Submit your manuscript at
www.biomedcentral.com/submit
Submit your next manuscript to BioMed Central
and we will help you at every step:
42. Komai-Koma M, Wang E, Kurowska-Stolarska M, Li D, McSharry C, Xu D. Interleukin-33 promoting Th1 lymphocyte differentiation depend-ents on IL-12. Immunobiology. 2016;221(3):412–7. doi:10.1016/j. imbio.2015.11.013.
43. Sedaghat AR, German J, Teslovich TM, Cofrancesco J Jr, Jie CC, Talbot CC Jr, et al. Chronic CD4+ T-cell activation and depletion in human
immuno-deficiency virus type 1 infection: type I interferon-mediated disruption of T-cell dynamics. J Virol. 2008;82(4):1870–83. doi:10.1128/jvi.02228-07. 44. Catalfamo M, Wilhelm C, Tcheung L, Proschan M, Friesen T, Park JH, et al.
CD4 and CD8 T cell. immune activation during chronic HIV infection: roles of homeostasis, HIV, type I IFN, and IL-7. J Immunol. 2011;186(4):2106–16. doi:10.4049/jimmunol.1002000.
45. Scagnolari C, Monteleone K, Selvaggi C, Pierangeli A, D’Ettorre G, Mez-zaroma I, et al. ISG15 expression correlates with HIV-1 viral load and with factors regulating T cell response. Immunobiology. 2016;221(2):282–90. doi:10.1016/j.imbio.2015.10.007.
46. Hyrcza MD, Kovacs C, Loutfy M, Halpenny R, Heisler L, Yang S, et al. Distinct transcriptional profiles in ex vivo CD4+ and CD8+ T cells are
established early in human immunodeficiency virus type 1 infection and are characterized by a chronic interferon response as well as extensive transcriptional changes in CD8+ T cells. J Virol. 2007;81(7):3477–86.
doi:10.1128/jvi.01552-06.
47. Abel K, Alegria-Hartman MJ, Rothaeusler K, Marthas M, Miller CJ. The relationship between simian immunodeficiency virus RNA levels and the mRNA levels of alpha/beta interferons (IFN-alpha/beta) and IFN-alpha/ beta-inducible Mx in lymphoid tissues of rhesus macaques during acute and chronic infection. J Virol. 2002;76:8433–45.
48. Durudas A, Milush JM, Chen HL, Engram JC, Silvestri G, Sodora DL. Ele-vated levels of innate immune modulators in lymph nodes and blood are associated with more-rapid disease progression in simian immunodefi-ciency virus-infected monkeys. J Virol. 2009;83(23):12229–40. doi:10.1128/ JVI.01311-09.
49. Ren Y, Li L, Wan Y, Wang W, Wang J, Chen J, et al. Mucosal topical microbi-cide candidates exert influence on the subsequent SIV infection and sur-vival by regulating SIV-specific T cell immune responses. J Acquir Immune Defic Syndr. 2016;71(2):121–9. doi:10.1097/QAI.0000000000000851. 50. Bosinger SE, Li Q, Gordon SN, Klatt NR, Duan L, Xu L, et al. Global genomic
analysis reveals rapid control of a robust innate response in SIV-infected sooty mangabeys. J Clin Invest. 2009;119(12):3556–72. doi:10.1172/ JCI40115.
51. Jacquelin B, Mayau V, Targat B, Liovat AS, Kunkel D, Petitjean G, et al. Non-pathogenic SIV infection of African green monkeys induces a strong but rapidly controlled type I IFN response. J Clin Invest. 2009;119(12):3544–55. doi:10.1172/JCI40093.
52. Fraietta JA, Mueller YM, Yang G, Boesteanu AC, Gracias DT, Do DH, et al. Type I interferon upregulates Bak and contributes to T cell loss during human immunodeficiency virus (HIV) infection. PLoS Pathog. 2013;9(10):e1003658. doi:10.1371/journal.ppat.1003658.
53. Bosinger SE, Utay NS. Type I interferon: understanding its role in HIV pathogenesis and therapy. Curr HIV/AIDS Rep. 2015;12(1):41–53. doi:10.1007/s11904-014-0244-6.
54. Tian X, Zhang A, Qiu C, Wang W, Yang Y, Qiu C, et al. The upregulation of LAG-3 on T cells defines a subpopulation with functional exhaustion and correlates with disease progression in HIV-infected subjects. J Immunol. 2015;194(8):3873–82. doi:10.4049/jimmunol.1402176.
55. Wang L, Xu X, Feng G, Zhang X, Wang F. CD160 characterization and its association with disease progression in patients with chronic HIV-1 infec-tion. Zhonghua yi xue za zhi. 2014;94(20):1559–62.
56. Abdelwahab SF, Cocchi F, Bagley KC, Kamin-Lewis R, Gallo RC, DeVico A, Lewis GK. HIV-1-suppressive factors are secreted by CD4+ T cells during
primary immune responses. Proc Natl Acad Sci USA. 2003;100(25):15006– 10. doi:10.1073/pnas.2035075100.
57. Huang J, Burke PS, Cung TD, Pereyra F, Toth I, Walker BD. Leukocyte immunoglobulin-like receptors maintain unique antigen-presenting properties of circulating myeloid dendritic cells in HIV-1-infected elite controllers. J Virol. 2010;84(18):9463–71. doi:10.1128/JVI.01009-10. 58. Blanpain C, Migeotte I, Lee B, Vakili J, Doranz BJ, Govaerts C, et al. CCR5
binds multiple CC-chemokines: MCP-3 acts as a natural antagonist. Blood. 1999;94(6):1899–905.
59. Katsikis PD, García-Ojeda ME, Torres-Roca JF, Greenwald DR, Herzenberg LA, Herzenberg LA. HIV type 1 Tat protein enhances activation-but not Fas (CD95)-induced peripheral blood T cell apoptosis in healthy individu-als. Int Immunol. 1997;9(6):835–41.
60. Mussil B, Javed A, Töpfer K, Sauermann U, Sopper S. Increased BST2 expression during simian immunodeficiency virus infection is not a determinant of disease progression in rhesus monkeys. Retrovirology. 2015;12:92. doi:10.1186/s12977-015-0219-8.
61. Wang X, Wang X, Wang W, Zhang J, Wang J, Wang C, et al. Both Rbx1 and Rbx2 exhibit a functional role in the HIV-1 Vif-Cullin5 E3 ligase complex in vitro. Biochem Biophys Res Commun. 2015;461(4):624–9. doi:10.1016/j. bbrc.2015.04.077.
62. Cribier A, Descours B, Valadão AL, Laguette N, Benkirane M. Phos-phorylation of SAMHD1 by cyclin A2/CDK1 regulates its restriction activity toward HIV-1. Cell Rep. 2013;3(4):1036–43. doi:10.1016/j. celrep.2013.03.017.
63. Vaittinen M, Kaminska D, Kakela P, Eskelinen M, Kolehmainen M, Pihla-jamaki J, et al. Downregulation of CPPED1 expression improves glucose metabolism in vitro in adipocytes. Diabetes. 2013;62(11):3747–50. doi:10.2337/db13-0830.
64. Hamada T, Souda M, Yoshimura T, Sasaguri S, Hatanaka K, Tasaki T, et al. Anti-apoptotic effects of PCP4/PEP19 in human breast cancer cell lines: a novel oncotarget. Oncotarget. 2014;5(15):6076–86. doi:10.18632/ oncotarget.2161.
65. Abella V, Valladares M, Rodriguez T, Haz M, Blanco M, Tarrio N, et al. miR-203 regulates cell proliferation through its influence on Hakai expression. PLoS ONE. 2012;7(12):e52568. doi:10.1371/journal.pone.0052568. 66. Eriksson EM, Milush JM, Ho EL, Batista MD, Holditch SJ, Keh CE, et al.
Expansion of CD8+ T cells lacking Sema4D/CD100 during HIV-1 infection
identifies a subset of T cells with decreased functional capacity. Blood. 2012;119(3):745–55. doi:10.1182/blood-2010-12-324848.
67. Yan B, Zhao JL. miR-1228 prevents cellular apoptosis through target-ing of MOAP1 protein. Apoptosis. 2012;17(7):717–24. doi:10.1007/ s10495-012-0710-9.
68. Chang M, Jin W, Chang JH, Xiao Y, Brittain GC, Yu J, et al. The ubiquitin ligase Peli1 negatively regulates T cell activation and prevents autoim-munity. Nat Immunol. 2011;12(10):1002–9. doi:10.1038/ni.2090. 69. Hunt PW, Martin JN, Sinclair E, Bredt B, Hagos E, Lampiris H, et al. T
cell activation is associated with lower CD4+ T cell gains in human