O P I N I O N
Open Access
How many mosquito nets are needed to achieve
universal coverage? Recommendations for the
quantification and allocation of long-lasting
insecticidal nets for mass campaigns
Albert Kilian
1*, Marc Boulay
2, Hannah Koenker
3, Matthew Lynch
3Abstract
Background:Long-lasting insecticidal nets are an effective tool for malaria prevention, and“universal coverage” with such nets is increasingly the goal of national malaria control programmes. However, national level campaigns in several countries have run out of nets in the course of distribution, indicating a problem in the method used to estimate the quantity needed.
Presentation of hypothesis:A major reason for the shortfall in estimation is the mismatch between the
quantification factor used to plan procurement and the allocation algorithm used at community level, in particular the effect of needing to add an additional net to households with an odd number of inhabitants. To solve this problem a revised quantification factor is suggested.
Testing hypothesis:Based on data from a broad range of household surveys across Africa, the effect of odd-numbered households on numbers of nets distributed is estimated via two frequently used allocation methods. The impact of these algorithms on the proportion of households reaching a person to net ratio of 2:1, a frequently used marker of universal coverage is then calculated.
Implications:In order to avoid stock-outs of nets during national coverage campaigns, it is recommended to use a quantification factor of 1.78 people per net, with an additional allocation factor suggested to account for other common problems at the community level resulting in a final recommended ratio of 1.60 people per net. It is also recommend that community level allocation procedures be aligned with procurement estimates to reduce shortages of nets during campaign distributions. These analyses should enable programme managers to make evidence-based decisions and support a more efficient and effective use of LLIN distribution campaign resources.
Background
Insecticide treated nets (ITN) are an effective tool for pre-venting the transmission of malaria [1]. This is particularly the case since regular re-treatment of nets with insecticide has become unnecessary with the introduction of long-lasting insecticidal nets (LLIN) [2]. Recent efforts promot-ing the use of LLIN have shifted their emphasis from a focus on vulnerable populations to a broader objective of universal coverage, defined at the household level as the
use of insecticide-treated nets by all household members regardless of age or gender [3]. There is an emerging con-sensus that a ratio of at least one LLIN for every two household members is typically sufficient to achieve uni-versal coverage in a population [4].
Centralized mass distribution campaigns have served as the cornerstone of efforts to achieve universal coverage [5]. Recent evaluations of these campaigns support their effectiveness at broadening household ownership of LLIN, i.e. households with at least one LLIN increase substantially [6]. However, these campaigns at times fail to provide households with sufficient quantities of nets to reach the desired ratio of one LLIN per two household
* Correspondence: [email protected] 1
Malaria Consortium, Development House, 56-64 Leonard Street, London EC2A 4LT, UK
Full list of author information is available at the end of the article
members [7,8]. As a consequence, the effect of these campaigns on the proportion of all people sleeping under a LLIN often falls short of target levels.
Inadequate procurements may be one reason that these campaigns fail to provide households with a suffi-cient number of nets. The World Health Organization/ Global Malaria Programme (WHO/GMP) recommends dividing the estimated total population by a factor of two when calculating the total number of nets needed to achieve the desired ratio of 1 net per every two peo-ple [4]. In practice, this approach tends to underestimate the overall need for nets. In 2009, a pilot distribution campaign in Diébougou district, Burkina Faso estimated the total number of nets required for the campaign to be 56,191, based on the WHO approach plus a 10% margin of error. However, a subsequent registration of all sleeping places identified a total need of 67,404 nets, a 32% increase from the initial estimate [9]. A distribu-tion campaign by the Peace Corps in Velingara District, Senegal used the WHO approach, minus the nets dis-tributed the prior year to children under five years of age, to estimate that 70,486 LLIN would be sufficient to achieve universal coverage in the district. During the campaign, when nets were allocated to households based on the number of sleeping places, implementers learned that they needed a total of 115,619 LLIN, a 64% increase from the initial estimate (personal communica-tion: Debbie Gueye, United States Agency for
Interna-tional Development (USAID) Senegal). A similar
campaign in Uganda noted that the actual number of nets required for universal coverage was 30% greater than the estimate obtained using the WHO calculation (personal communication: Kojo Lokko, AFFORD Project).
Inefficient household allocation strategies may be a second factor limiting the ability of these campaigns to achieve universal coverage. Countries use a variety of approaches for allocating nets to households during their distribution campaigns. In some countries, cam-paigns distribute a fixed number of nets, typically two or three nets, to each household. In other countries, the number of nets allocated to a household varies by the size of the household or by the number of sleeping places in the household. This variation in approaches illustrates the lack of clarity in the current understand-ing regardunderstand-ing how best to allocate nets in support of universal coverage objectives.
Drawing on existing household survey data, this paper provides empirical support for an improved algorithm for estimating the number of LLIN needed to achieve universal coverage within a given population and evalu-ates the various approaches for allocating LLIN to speci-fic households. These analyses should provide guidance to programme managers to make evidence-based
decisions and support a more efficient and effective use of LLIN distribution campaign resources.
Presentation of the hypotheses Quantifying the procurement of LLIN
The current algorithm for calculating the number of LLIN necessary to provide one net for every two people in a population simply divides the total population size by a factor of two [4]. However, since an LLIN is indivisi-ble and incapaindivisi-ble of being shared between two different households, this approach systematically underestimates the demand in households with an uneven number of household members. For example, two three-person households would have a total population of six. Based on the current approach of dividing this population by two, managers would procure three LLIN to achieve universal coverage in these two households. In practice, however, one household would receive two nets with only one net remaining for the second household and the campaign would only achieve universal coverage in one of the two households.
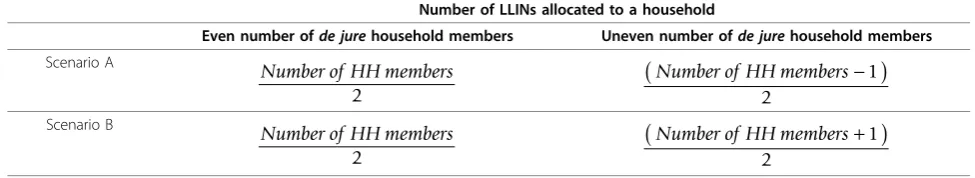
A more accurate algorithm would use a population-level divisor that accounts for the one additional LLIN required by households with an uneven number of members. To identify this divisor and assess the addi-tional coverage that would result from its use, two sce-narios were used to simulate the allocation of LLIN to households sampled in 12 Demographic and Health Sur-veys (DHS) [10] and six additional sub-national house-hold-based surveys [[7,8,11], unpublished data, Malaria Consortium). In both scenarios, households with an
even number of de jure members (i.e. all those who
usually live there but excluding temporary visitors) received a quantity of nets equal to half of the house-hold size. The number of nets allocated to househouse-holds
with an uneven number of de jure members differed
between the two scenarios. In Scenario A, households received a quantity of nets equal to half of the house-hold size minus 1; while in Scenario B, househouse-holds received a quantity of nets equal to half of the house-hold size plus 1. Table 1 provides the exact calculations used as allocation rules for the two scenarios.
this divisor could be used to calculate the number of nets needed for a campaign that did plan to provide an additional net to households with an uneven number of members.
Evaluating net allocation strategies
Strategies to allocate nets to households are guided by two primary questions. First, should the campaign allo-cate a fixed or varying number of nets to each house-hold? And, if households should receive a varying number of nets, should the number of nets allocated to the household be based on the number of people or the number of sleeping places within the household? At pre-sent, there is little empirical data upon which program managers can base their decisions to these questions.
The decision to allocate a fixed number of nets to each household seems based on the assumption that a single quantity can be identified that provides a substan-tial number of households with the correct number of nets, while minimizing the proportion of households that receive too many nets or too few nets. To test this assumption, the results of two fixed allocation cam-paigns, one providing two nets to each household and the other providing three nets, were assessed using the distribution of household sizes in the 18 datasets. Households were classified as receiving the correct number of nets if they received one net for every two people in the household (3-4 household members for the two-net campaign; 5-6 members for the three-net campaign). They were classified as receiving too many nets if they had fewer household members and were classified as receiving too few nets if they had more household members.
When the decision is made to vary the number of nets allocated to a household, the number of sleeping places within the household appears to be the logical metric to use to ensure that a mosquito net covers every person sleeping in the household. In practice, this approach presents some concerns. First, where individuals sleep on a variety of surfaces, the definition of a sleeping place may include areas in which several people sleep and that may be too large to be enclosed by a single net. Second, households from lower wealth quintiles may be more likely to have more individuals sharing fewer sleeping places. Use of sleeping places to allocate
nets then may result in an inequitable distribution of nets favouring households from higher wealth quintiles. To investigate these concerns, data from five surveys that measured both the number of household members and the number of sleeping places were analysed.
Testing the hypothesis
What divisor will provide the correct number of LLIN to achieve universal coverage?
Recent experience suggests that dividing the total popu-lation by two underestimates the total number of LLIN required to achieve universal coverage, defined as at least one net for every two people in a household. To test the hypothesis that this underestimate is attributed to the additional net required by households with an uneven number of members, simulated allocations of LLIN to households either ignored this additional need (Scenario A) or met this additional need (Scenario B). It was expected that Scenario B would be more likely than Scenario A to reach the household threshold of univer-sal coverage and that the mean number of persons per net in Scenario B would serve as a more effective popu-lation divisor for calculating the total number of nets needed to reach universal coverage.
Table 2 presents the results from the simulated alloca-tion of nets under Scenario A, in which households with
an uneven number ofde juremembers received a
quan-tity of nets equal to half of the household size minus 1. Following this allocation rule, only 50 to 60% of house-holds would receive at least one net for every two peo-ple and meet the threshold required for universal coverage. The mean number of persons per net ranged from 2.02 to 2.27, with a median score of 2.19. This
“LLIN allocation factor”is slightly higher than the num-ber (2.0) currently recommended by WHO, suggesting that the current approach should result in approxi-mately 60-70% of households reaching the threshold of one net for every two people that is required for univer-sal coverage.
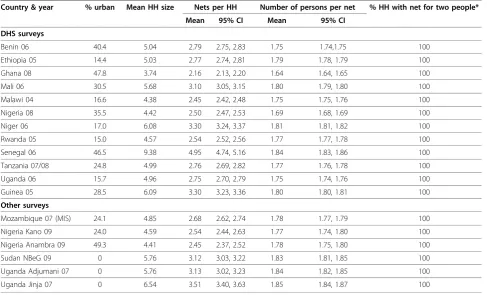
The results from the Scenario B simulation are pre-sented in Table 3. As expected, when households with
an uneven number ofde juremembers are allocated an
[image:3.595.53.541.102.191.2]additional net to accommodate the extra person, all households meet the threshold of one net for every two Table 1 Simulated allocation rules for Scenario A and Scenario B
Number of LLINs allocated to a household
Even number ofde jurehousehold members Uneven number ofde jurehousehold members
Scenario A
Number of HH members
2
Number of HH members−
(
1)
2
Scenario B
Number of HH members
2
Number of HH members+
(
1)
Table 2 Results from simulated allocation of LLINs using Scenario A allocation rule
Country & year % urban Mean HH size Nets per HH Number of persons per net % HH with net for two people*
Mean 95% CI Mean 95% CI
DHS surveys
Benin 06 40.4 5.04 2.36 2.32, 2.40 2.15 2.14, 2.16 56.7
Ethiopia 05 14.4 5.03 2.31 2.28, 2.34 2.22 2.21, 2.23 53.5
Ghana 08 47.8 3.74 1.81 1.78, 1.84 2.02 2.01, 2.03 64.3
Mali 06 30.5 5.68 2.64 2.59, 2.68 2.20 1.19, 2.22 53.3
Malawi 04 16.6 4.38 2.02 1.99, 2.04 2.20 2.19, 2.21 56.5
Nigeria 08 35.5 4.42 2.11 2.09, 2.14 2.05 2.04, 2.07 61.5
Niger 06 17.0 6.08 2.82 2.77, 2.88 2.21 2.20, 2.22 52.0
Rwanda 05 15.0 4.57 2.10 2.07, 2.12 2.22 2.21, 2.23 55.6
Senegal 06 46.5 9.38 4.49 4.29, 4.70 2.10 2.08, 2.12 54.6
Tanzania 07/08 24.8 4.99 2.32 2.25, 2.38 2.18 2.16, 2.19 56.2
Uganda 06 15.7 4.96 2.33 2.29, 2.37 2.13 2.12, 2.14 58.2
Guinea 05 28.5 6.09 2.85 2.78, 2.91 2.18 2.17, 2.19 54.8
Other surveys
Mozambique 07 (MIS) 24.1 4.85 2.22 2.17, 2.28 2.23 2.21, 2.24 54.8
Nigeria Kano 09 24.0 4.59 2.13 2.00, 2.25 2.18 2.12, 2.25 59.0
Nigeria Anambra 09 49.3 4.41 2.04 1.97, 2.11 2.18 2.14, 2.23 59.6
Sudan NBeG 09 0 5.76 2.65 2.56, 2.74 2.20 2.17, 2.23 52.3
Uganda Adjumani 07 0 5.76 2.63 2.53, 2.74 2.27 2.24, 2.30 50.4
Uganda Jinja 07 0 6.54 3.03 2.92, 3.15 2.22 2.20, 2.25 52.3
Table 3 Results from simulated allocation of LLINs using Scenario B allocation rule
Country & year % urban Mean HH size Nets per HH Number of persons per net % HH with net for two people*
Mean 95% CI Mean 95% CI
DHS surveys
Benin 06 40.4 5.04 2.79 2.75, 2.83 1.75 1.74,1.75 100
Ethiopia 05 14.4 5.03 2.77 2.74, 2.81 1.79 1.78, 1.79 100
Ghana 08 47.8 3.74 2.16 2.13, 2.20 1.64 1.64, 1.65 100
Mali 06 30.5 5.68 3.10 3.05, 3.15 1.80 1.79, 1.80 100
Malawi 04 16.6 4.38 2.45 2.42, 2.48 1.75 1.75, 1.76 100
Nigeria 08 35.5 4.42 2.50 2.47, 2.53 1.69 1.68, 1.69 100
Niger 06 17.0 6.08 3.30 3.24, 3.37 1.81 1.81, 1.82 100
Rwanda 05 15.0 4.57 2.54 2.52, 2.56 1.77 1.77, 1.78 100
Senegal 06 46.5 9.38 4.95 4.74, 5.16 1.84 1.83, 1.86 100
Tanzania 07/08 24.8 4.99 2.76 2.69, 2.82 1.77 1.76, 1.78 100
Uganda 06 15.7 4.96 2.75 2.70, 2.79 1.75 1.74, 1.76 100
Guinea 05 28.5 6.09 3.30 3.23, 3.36 1.80 1.80, 1.81 100
Other surveys
Mozambique 07 (MIS) 24.1 4.85 2.68 2.62, 2.74 1.78 1.77, 1.79 100
Nigeria Kano 09 24.0 4.59 2.54 2.44, 2.63 1.77 1.74, 1.80 100
Nigeria Anambra 09 49.3 4.41 2.45 2.37, 2.52 1.78 1.75, 1.80 100
Sudan NBeG 09 0 5.76 3.12 3.03, 3.22 1.83 1.81, 1.85 100
Uganda Adjumani 07 0 5.76 3.13 3.02, 3.23 1.84 1.82, 1.85 100
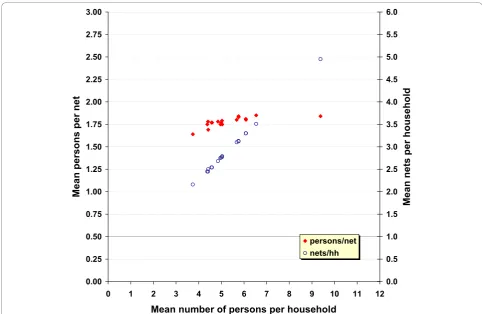
[image:4.595.56.544.438.733.2]people that is required for universal coverage. In this scenario, the mean number of persons per net ranged from 1.64 to 1.85, with a median score of 1.78. This indicates that dividing the total population by 1.78 would provide enough nets for a campaign to provide each household with at least one net for every two peo-ple in the household. The mean number of persons per net in Scenario B remains remarkably consistent across countries, regardless of the level of urbanization and the mean household size in each country (Figure 1). This suggests that a single population-derived“LLIN
alloca-tion factor” can be applied consistently across all
countries.
These results are nearly identical to those obtained from intensive micro-census investigations in Mozambi-que and Cambodia. In MozambiMozambi-que, information on the number, gender, and age of household members was used to determine the likely sleeping arrangements of the household members and identified that 1.75 persons per net was necessary to achieve universal coverage [12]. A similar figure of 1.79 was found in a micro-planning exercise in Cambodia, where a census was done in approximately 1,000 households and nets allocated indi-vidually with odd numbered households rounded up
(personal communication, Steve Mallor, Malaria Con-sortium Cambodia).
What is the most effective way to allocate nets to households to achieve universal coverage?
The second hypothesis examined the relative effective-ness of using a fixed allocation of nets to achieve uni-versal coverage. It was expected that the variation in household sizes would limit the effectiveness or effi-ciency of this approach, suggesting the use of tailored allocations as the recommended approach for determin-ing the number of nets to be given to households.
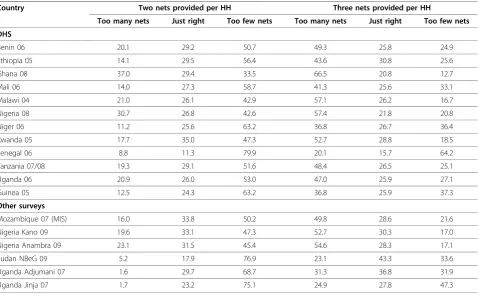
[image:5.595.55.538.87.401.2]As expected, allocating a fixed number of LLIN to each household does not appear to be an effective approach for achieving universal net coverage or an effi-cient way to allocate nets to households (Table 4). When two nets are allocated to households, the percent of households receiving one net for every two household members ranges from a low of 11.3% to a high of 35.0%. When three nets are allocated, the percent of house-holds receiving one net for every two household mem-bers ranges from 15.7% to 43.3%. In nearly all countries, an allocation of two nets per household provides an insufficient number of nets to achieve universal cover-age, while an allocation of three nets provides
households with too many nets and is an inefficient use of resources.
Since this suggests allocating a varied, rather than fixed, number of nets to households, the remaining question concerns the use of household members or sleeping places to determine the amount of nets required by each household. It was hypothesized that the subjective definition of a“sleeping place” may result in an identification of spaces in which multiple indivi-duals sleep and which may be too large to be covered by a single LLIN. It was further hypothesized that the number of sleeping places in a household would be positively related to household wealth and that allocat-ing LLIN by sleepallocat-ing places would disproportionately favour the distribution of nets to wealthier individuals.
Figure 2 presents data from five surveys that included a measurement of sleeping places in the household. As this figure illustrates, the variation of people per sleeping place was much wider than the variation of people per net. The ratio of people per sleeping place across these five surveys ranged from 1.5 to 3.3, while the mean number of people sharing a net remained between 1.75 and 2.25 in four of the five surveys. The most likely
reason for the increased variation in people per sleeping place is the definition of sleeping places that, in some cases, are not equivalent to a space in which people could share a net. Distribution campaigns that allocate nets to households based on their sleeping places may undersupply households in which the number of people per sleeping place is lower than 2.0 and may oversupply households in which the number of people per sleeping place is higher than 2.0.
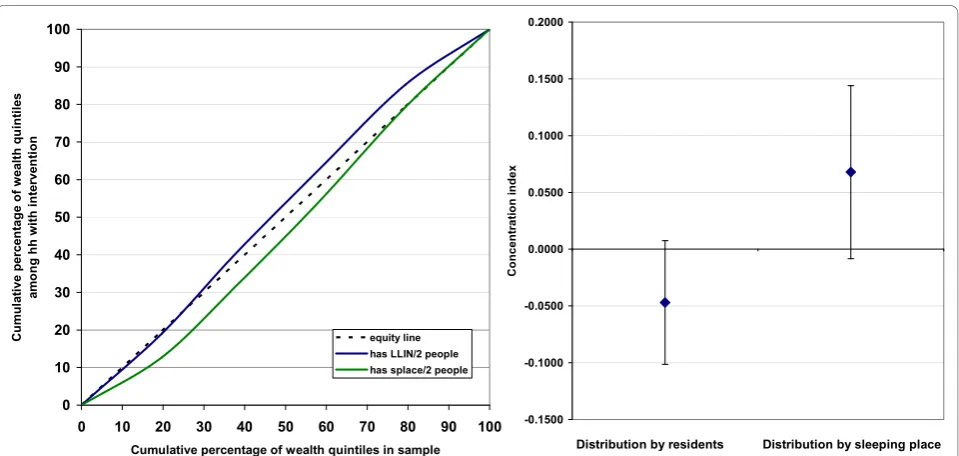
[image:6.595.60.539.110.406.2]Data from Northern Bahr el Ghazal in Southern Sudan (unpublished data: Malaria Consortium, see annex for details on survey and methodology [Addi-tional file 1]) suggest that the use of sleeping places to allocate LLIN may result in an unequal distribution of nets favouring wealthier households. A post-campaign survey showed that the mean number of sleeping places increased with wealth quintile while the mean number of de-jure residents did not, resulting in a decreasing mean number of persons per sleeping place with increasing wealth (Table 5). Using the concentration curve and index for“universal coverage”to assess equity of LLIN distribution showed that the actual distribution was equitable and even somewhat pro-poor with a Table 4 Effects of a fixed household allocation of two or three nets with respect to the universal coverage criteria
“1 net for 2 people”
Country Two nets provided per HH Three nets provided per HH
Too many nets Just right Too few nets Too many nets Just right Too few nets
DHS
Benin 06 20.1 29.2 50.7 49.3 25.8 24.9
Ethiopia 05 14.1 29.5 56.4 43.6 30.8 25.6
Ghana 08 37.0 29.4 33.5 66.5 20.8 12.7
Mali 06 14.0 27.3 58.7 41.3 25.6 33.1
Malawi 04 21.0 26.1 42.9 57.1 26.2 16.7
Nigeria 08 30.7 26.8 42.6 57.4 21.8 20.8
Niger 06 11.2 25.6 63.2 36.8 26.7 36.4
Rwanda 05 17.7 35.0 47.3 52.7 28.8 18.5
Senegal 06 8.8 11.3 79.9 20.1 15.7 64.2
Tanzania 07/08 19.3 29.1 51.6 48.4 26.5 25.1
Uganda 06 20.9 26.0 53.0 47.0 25.9 27.1
Guinea 05 12.5 24.3 63.2 36.8 25.9 37.3
Other surveys
Mozambique 07 (MIS) 16.0 33.8 50.2 49.8 28.6 21.6
Nigeria Kano 09 19.6 33.1 47.3 52.7 30.3 17.0
Nigeria Anambra 09 23.1 31.5 45.4 54.6 28.3 17.1
Sudan NBeG 09 5.2 17.9 76.9 23.1 43.3 33.6
Uganda Adjumani 07 1.6 29.7 68.7 31.3 36.8 31.9
Uganda Jinja 07 1.7 23.2 75.1 24.9 27.8 47.3
Key:
concentration index of -0.047 (95% CI -0.101, 0.008) (Figure 3). In contrast, the concentration curve for sleeping places, i.e had one net be given for each sleep-ing place, showed a slightly pro-rich effect on universal coverage with an index of 0.068 (95%CI -0.008, 0.144). In this case the difference did not quite reach the p < 0.05 statistical significance level but this is merely a question of sample size. The example demonstrates that the use of sleeping places for net allocation can indeed have some undesirable equity effects.
Implications of the hypothesis
These results recommend revising the current approach for calculating the number of LLIN necessary for achieving universal coverage through a centralized mass distribution campaign. Rather than dividing the total population by a factor of 2, a new divisor of 1.78 is necessary to account
for the additional LLIN needed in households with an uneven number of members. This revised divisor is very similar to that suggested by“bottom up”approaches of micro-planning at the household level.
It should be noted, however, that these simulations are unable to account for some additional logistical hurdles experienced by distribution campaigns. First, campaigns often need to pre-position stocks of LLIN to adjust for inconsistencies between the census estimates used for planning and the actual numbers obtained during regis-tration exercises. Second, since LLIN are packaged in bales of 50 or 100 and are difficult to transport once opened, campaigns typically round-up the number of LLIN sent to the distribution points to the nearest bale. Both practices result in a certain number of LLIN being
[image:7.595.56.542.87.366.2]“stuck” in the distribution chain, resulting in an addi-tional demand of 5% to 10% of initial estimates.
Figure 2Correlation between mean number of net users (if net used) and mean number of people per sleeping place. Ideally all values should fall into the intersection of the two boxes.
Table 5 Distribution of residents and sleeping places by wealth quintile in Northern Bahr el Ghazal, Southern Sudan
Wealth quintile Mean Persons per household Mean sleeping places per household Mean Persons per sleeping place
Lowest 5.56 1.40 4.47
Second 5.19 1.73 3.43
Third 5.73 2.10 3.04
Fourth 5.76 2.42 2.62
Highest 6.43 2.42 2.97
[image:7.595.55.539.635.732.2]The obvious solution is to include a buffer in the quantification that will compensate for these logistical
“losses.” While there is little empirical information
regarding the extent of this margin, reasonable expecta-tions suggest it is between 5% and 15% of the total need. Applying these rates to the recommended popula-tion divisor of 1.78 results in the corrected factors pre-sented in Table 6.
Based on all these considerations, the authors recommend that programme managers divide their population by a factor of 1.60 to calculate the number of LLIN that they need to procure to achieve universal coverage of one net for every two people
These results also recommend allocating LLIN to house-holds based on their household size, without an upper limit for larger households, rather than using a fixed number of nets per household. Using the number of household members, rather than sleeping places, appears
more likely to provide households with a sufficient num-ber of nets to achieve universal coverage and to result in a more equitable distribution of LLIN across all wealth quintiles. However, if sleeping places are to be used to determine the number of nets required by a household, efforts should be made to confirm that the mean num-ber of people per sleeping place is close to 2.0 and the definition of a sleeping place needs to be clearly articu-lated and standardized. One possible approach would be to define sleeping places as “a place where people sleep and that can be covered by a single net.”
Whether household size or sleeping places are used to allocate nets to households, a similar metric should be used to quantify the total number of nets needed for the campaign. If the method of quantification differs from that used for actual net allocation during the campaign, the allocation of nets may require a greater quantity than were estimated by the quantification method. In Kano, Nigeria, LLIN needs were quantified at two nets
per household using the standard definition of “people
eating from the same pot,”but were allocated using the
household definition of “wife with her dependents” in
[image:8.595.59.539.87.315.2]polygamous families. Instead of delivering two nets per household, the outcome of the post-campaign survey showed that only 1.7 nets were delivered among those who attended the distribution, with 28% of households receiving only one net [8]. In Senegal, overall need was calculated based on the ratio of one net for two people and then allocated by sleeping place during house-to-house registration. Since the average number of people
Figure 3Concentration curve and index comparing the equity of universal coverage in Northern Bahr el Ghazal, Southern Sudan, between the actual distribution by residents and the distribution had one net been given per sleeping place (N = 502).
Table 6 Possible further correction of the“LLIN allocation factor”to compensate for logistics (distribution chain) and variations on estimation parameters such as population growth
Correction factor “LLIN allocation factor”
1.78 +5% 1.69
1.78 +10% 1.60
[image:8.595.57.291.676.731.2]per sleeping place was 1.75, a 25% deficit in nets is expected [13].
Additional material
Additional file 1: Net tracking survey Northern Bahr el Ghazal, Southern Sudan. Details of the study design, methodology and analysis
Acknowledgements
This work was supported by funding under the NetWorks project from USAID Cooperative Agreement #GHS-A-00-09-00014-00, including salary support for all the authors. USAID staff commented on drafts and encouraged publication; they did not otherwise take any role in data analysis, interpretation or writing of the manuscript. The opinions expressed in this paper represent those of the authors and do not necessarily reflect those of the United States government. The authors thank many colleagues for their comments on earlier drafts, especially Marcy Erskine, George Greer, David Gittelman, Jo Lines, Kojo Lokko, Laura Andes and Megan
Fotheringham.
Author details
1Malaria Consortium, Development House, 56-64 Leonard Street, London EC2A 4LT, UK.2Department of Health, Behavior & Society, Johns Hopkins Bloomberg School of Public Health, Baltimore, USA.3Center for Communication Programs, Johns Hopkins Bloomberg School of Public Health, Baltimore, USA.
Authors’contributions
AK drafted the manuscript, provided data form the sub-national studies and did part of the statistical analysis. MB provided the statistical analysis of the DHS data and contributed to the manuscript development. HK provided input on structure and campaign logistics, and ML helped draft and edit the manuscript. All authors read and approved the final manuscript.
Authors’information
AK is director monitoring & evaluation for the Malaria Consortium; MB is Assistant Professor at the Department of Health, Behavior & Society, Johns Hopkins Bloomberg School of Public Health; HK is senior program officer at the Center for Communication Programs, Johns Hopkins Bloomberg School of Public Health; ML is Director of the Global Program on Malaria at the Center for Communication Programs, Johns Hopkins Bloomberg School of Public Health
Competing interests
The authors declare that they have no competing interests.
Received: 17 July 2010 Accepted: 18 November 2010 Published: 18 November 2010
References
1. Lengeler C:Insecticide-treated bed nets and curtains for preventing malaria.Cochrane Database Syst Rev2004, CD000363.
2. Guillet P, Alnwick D, Cham MK, Neira M, Zaim M, Heyman D, Mukelabai K:
Long-lasting treated mosquito nets: breakthrough in malaria prevention.
Bull World Health Organ2001,79:998.
3. WHO:Insecticide treated mosquito nets: a position statementGlobal Malaria Programme, World Health Organization, 2007 Aug, Geneva;[http://www. who.int/entity/malaria/publications/atoz/itnspospaperfinal/en/index.html], (accessed 08.07.2010).
4. WHO:Long-lasting insecticidal nets for malaria prevention-a manual for malaria programme managers.Trial edition. Global Malaria Programme, World Health Organization, 2007, Geneva;[http://www.who.int/entity/ malaria/publications/LLINmanual.pdf], (accessed 08.07.2010).
5. Alliance for Malaria Prevention:A toolkit for developing integrated campaigns to encourage the distribution and use of long lasting insecticide-treated nets, 1 2008 [http://www.allianceformalariaprevention.com/pdf/
AMP_Toolkit_Final.pdf], (accessed 08.07.2010).
6. Kilian A, Wijayanandana N, Ssekitoleeko J:Review of delivery strategies for insecticide treated mosquito nets-are we ready for the next phase of malaria control efforts?TropIKA.net Journal2010,1:1[http://journal.tropika. net/pdf/tropika/v1n1/a04v1n1.pdf], (accessed 08.07.2010).
7. Kolaczinski J, Kolaczinski K, Kyabayinze D, Strachan D, Temperly M, Wijayanandana N, Kilian A:Costs and effects of two public sector delivery channels for long-lasting insecticidal nets in Uganda.Malar J2010,9:102. 8. SuNMaP:Retention, use, and achievement of“universal access”following the distribution of long-lasting insecticidal Nets in Kano State, Nigeria.
Final Report December 2009, Abuja Nigeria.
9. Ministere de la Sante, Burkina Faso:Campagne de distribution universelle de MILDA dans le district sanitaire de Diébougou au Burkina FasoRapport Technique, Ouagadougou; 2009.
10. Demographic and health surveys (DHS): Measure DHS.[http://www. measuredhs.com/aboutsurveys/search/search_survey_main.cfm? SrvyTp=type&listtypes = 1].
11. Mabunda S, Mathe G, Streat E, Nery S, Kilian A:Malaria Indicator Survey, Mozambique (MIS 2007)Ministry of Health: National Directorate of Health; Maputo; 2009 [http://www.malariasurveys.org/surveys.cfm?
country=Mozambique%202007#5003], (accessed 08.07.2010). 12. UNICEF:Implementing the distribution of Long Lasting Insecticidal Nets to
achieve Universal Access of populations, A Pilot Project in Mabalane District, Gaza Province, MozambiqueFinal Report. Maputo; 2009, Table 1. 13. Programme national de lutte contre le paludisme, Senegal. Evaluation
de la campagne intégrée de distribution de moustiquaires imprégnées à longue durée d’action, de vitamine A, et de mébendazole au Sénégal 2009 Final Report, Dakar; 2010.
doi:10.1186/1475-2875-9-330
Cite this article as:Kilianet al.:How many mosquito nets are needed to achieve universal coverage? Recommendations for the quantification and allocation of long-lasting insecticidal nets for mass campaigns.
Malaria Journal20109:330.
Submit your next manuscript to BioMed Central and take full advantage of:
• Convenient online submission
• Thorough peer review
• No space constraints or color figure charges
• Immediate publication on acceptance
• Inclusion in PubMed, CAS, Scopus and Google Scholar • Research which is freely available for redistribution