Theses Thesis/Dissertation Collections
10-19-2010
Marketing special academic events to college
professors and students
Julie Johnson
Follow this and additional works at:http://scholarworks.rit.edu/theses
This Thesis is brought to you for free and open access by the Thesis/Dissertation Collections at RIT Scholar Works. It has been accepted for inclusion in Theses by an authorized administrator of RIT Scholar Works. For more information, please contactritscholarworks@rit.edu.
Recommended Citation
The Rochester Institute of Technology
Department of Communication
College of Liberal Arts
Marketing Special Academic Events to College Professors and Students
by
Julie Johnson
A Thesis submitted
in partial fulfillment of the Master of Science degree
in Communication & Media Technologies
Degree Awarded:
The members of the Committee approve the thesis of Julie Johnson presented on October 19, 2010
___________________________________ Bruce A. Austin, Ph.D.
Chairman and Professor of Communication Department of Communication
Thesis Advisor
___________________________________ Patrick Scanlon, Ph.D.
Professor of Communication
Coordinator for Undergraduate Programs Department of Communication
Thesis Advisor
___________________________________ Rudy Pugliese, Ph.D.
Professor of Communication
Coordinator for Communication and Media Technologies Graduate Degree Program Department of Communication
___________________________________ Victor Perotti, Ph.D.
Associate Professor
Table of Contents
Abstract……….….….4
Introduction………..…...5
Rationale………...8
Review of Related Scholarly Literature………....10
Media Habits………..……...10
Media, Opinion Leadership, and Behavior………...….16
College Marketing for Student Recruitment……….23
Methods………...27
Results and Discussion………..30
Assessment of Media Habits……….30
Media Used for Learning and Sharing Information about Academic Events…………...41
Motivations for Attending Academic Events and Sharing News about Events with Others………53
Conclusion………....…66
Marketing Implications………...…..66
Limitations and Weaknesses………...…..72
Suggestions for Future Research………...73
References.………..……..77
Appendix A: Survey Instrument Request Emails………..81
MARKETING SPECIAL ACADEMIC EVENTS TO COLLEGE PROFESSORS AND STUDENTS
Name: Julie Johnson
Department: Communication College: Liberal Arts
Degree: Master of Science in Communication and Media Technologies Term Degree Awarded: Fall 2010 (20101)
Abstract
The study examined the communication channels that professors, graduate students, and
undergraduates use to learn and tell others about special academic events on college campuses,
as well as individuals’ motivations for attending academic events and mentioning them to others.
Broad similarities emerged among the groups. Email announcement was the most common way
to learn about academic events, and face-to-face communication was the most common means of
telling others. Beyond the similarities, significant differences emerged. Overall, students showed
more diversity in channels of communication for learning and sharing information about
academic events, as well as in motivations for attending events and mentioning them to others.
The study offers recommendations for marketing special academic events to professors and
students.
Keywords: academic events, academic marketing, college students, social media,
Marketing Special Academic Events to College Professors and Students
Thousands of published texts, from how-to books to scholarly articles, exist to help
marketing practitioners answer the question of how to reach and motivate their target audiences
in the most effective ways. In spite of this, individuals tasked with marketing special academic
events to college campus citizens will find their need for advice largely unmet by the extant
literature. The present study explores the methods and motivations at play when students and
professors receive and disseminate information about special academic events. While ample
attention has been given to college marketing in the service of student recruitment (Hartley &
Morphew, 2008; Lewison & Hawes, 2007; Lipman Hearne & Case, 2007), far less attention has
been paid to how higher education professionals market events to students once enrolled.
In addition to addressing research questions related to academic event marketing, the
present research project forms the basis of a marketing strategy for a specific academic event that
takes place annually at the Rochester Institute of Technology—the Conference for
Undergraduate Research in Communication (CURC). Every spring, undergraduates from across
the Northeast (and, more recently, the nation) submit paper and poster proposals for the
opportunity to share original research on topics in communication. Since the conference’s
inception in 2004, participation levels have been adequate but inconsistent from year to year, and
the number of schools represented by student participants has grown only slightly (see chart
below).1 The conference’s expanded geographical reach in the past several years (2008-2010)
1 The number of proposals submitted every year would arguably be a better measure of the conference’s growth,
offers an encouraging glimpse of its potential for growth. The 2008 conference was the first to
host a participant from out of state, and the 2009 conference was the first “coast to coast” event,
The discussion below takes inventory of industry data and scholarly literature on three
topics relevant to the present study: the dissemination of information in today’s media
marketplace; the connection between media, opinion leadership, and behavior; and current
practices in college marketing (a potential proxy for academic event marketing). A primer in
these topics informs and contextualizes our research questions and survey instrument, and sets
the stage for interpreting the instrument’s results in meaningful ways. The present study
addresses the following research questions:
1. What do professors, graduate students, and undergraduates say their media habits are today?
2. Which media do professors, graduate students, and undergraduates say they use to learn
about academic events?
3. Which media do professors, graduate students, and undergraduates say they use to share
information with others about academic events?
4. What motivates professors, graduate students, and undergraduates to attend academic events?
5. What motivates professors, graduate students, and undergraduates to tell others about academic events?
Rationale
The scholarly impetus for the present research speaks to the study’s broad purpose
mentioned above—expanding the research on event marketing on college campuses. Scholarly
publications such as the Journal of Marketing for Higher Education and the Journal of College
Admission provide a forum for scholars to discuss the marketing of institutions to aspiring
campus events. Such events contribute to the vibrant learning community that likely attracts
students to particular institutions in the first place.
The social rationale for the present study is its potential benefit to college administrators,
professors, and students. College administrators invest significant resources in hosting guest
speakers, competitions, and conferences, and the link between well-executed marketing and
return on investment (ROI) has long been established. Professors and students, who are often
both the generators and audiences of marketing messages, stand to benefit from more relevant
and targeted communication on both ends of the marketing spectrum.
Finally, one aspect of the social rationale relates directly to the present study’s tailored
purpose mentioned above—finding a way to grow the Conference for Undergraduate Research in
Communication at RIT. Scholarly research points to various ways in which students benefit from
undergraduate research. For instance, undergraduate research prepares students for future
scholarly pursuits. Russell, Hancock, and McCullough (2007) found that undergraduate research
opportunities increase students’ anticipation of pursuing a Ph.D. Caccavo (2009) found that
undergraduate research bolsters students’ applications to graduate school because entrance
committees perceive these students as needing less training and being more capable of producing
publishable material in shorter time.
Several studies point to the increase in confidence that students receive from
undergraduate research (Hunter, Laursen, & Seymour, 2007; Lopatto, 2006). In one study
(Russell, Hancock, & McCullough, 2007), 83 percent of respondents who had participated in
research as undergraduate students reported that their confidence in their research skills had
through such activities as attending conferences, submitting papers to journals, and mentoring
other students—were the most likely to report positive outcomes from their experience.
Caccavo (2009) states that undergraduate research allows students to apply data in
problem solving, hone skills, refine career interests, collaborate with peers, and work closely
with faculty. He contends that “training undergraduates to think like scientists … should be a
fundamental component of undergraduate curricula” and cites the “growing body” of research in
his own field, biology, on the effectiveness of college-level, inquiry-based instruction (p. 9).
Review of Related Scholarly Literature
The research questions posed by the present study warrant a broad understanding of
media habits and trends, opinion leadership, and academic marketing. These topics provide a
framework for designing an effective research instrument and interpreting the data gathered.
Media Habits
An appraisal of media exposure among American adults serves as a backdrop for
understanding the media habits of college students and professors. According to one Nielsen
study (2009, November 3) of American adults’ daily media exposure, 95 percent of adults are
reached by television, 77 percent by broadcast radio, 64 percent by the Web/Internet (excluding
email), 35 percent by newspaper, and 27 percent by magazines. Clearly, traditional media remain
ubiquitous in spite of the advent of the Internet and its disruptive innovations (e.g., online news
signs of a general shift away from traditional media to the Internet, with the impact of the
Internet varying from medium to medium.
Of the traditional media formats, newspapers have arguably receded the most. In the 25
years between 1983 and 2008, newspaper circulation dropped by over 14 million subscribers,
from 62,645,000 to 48,597,000 (Newspaper Association of America, n.d.). There is also
evidence of an accelerated decline in newspaper circulation in more recent years. Industry
figures show a seven percent drop in circulation of the nation’s newspapers from the fall of 2007
to the fall of 2008 (Arango, 2009). Cutbacks due to the recession explain a small portion of the
decrease, but migration to the Internet as a source of news information appears to be mostly to
blame. From 2005 to 2009, unique readers of online newspapers grew by 30 million (Newspaper
Association of America, n.d.).
Recent changes in magazine consumption are less dramatic, making it more difficult to
draw forecasts for the industry. Some sources point to a decrease in paper magazine readership,
while others claim that readership is holding strong. In a survey conducted by the Pew Research
Center (2008), 23 percent of American adults claimed to have read a magazine the day before—
down 10 percentage points from 33 percent in 1994. Additionally, across 251 American
magazines, ad pages decreased by 12 percent in 2008, compared to a one percent drop the
previous year (Pew Project for Excellence in Journalism, 2009). It is likely that this decline is
tied to the recession, but ad revenues are not expected to rebound anytime soon. The firm
Veronis Suhler Stevenson has projected magazine ad revenue decreases of 9.8 percent in 2010,
decline of 6.6 percent for the years 2008-2013 places magazines just above newspapers among
the lowest performing media (Pew Project for Excellence in Journalism, 2010).
Magazine Publishers of America (MPA) has a less bleak outlook on magazines.
According to the MPA’s 2009-10 handbook, more than four out of five American adults read
magazines, and magazine readership among adults remains strong in the present decade in spite
of the influx of new media options. For instance, the number of magazine readers grew by six
percent between 2004 and 2008, from 179,373,000 readers to 189,681,000. The MPA handbook
also contains quantitative data on the growth of magazine websites. From 2005 to 2009, the
number of magazines with websites increased by 50 percent, from 10,131 to 15,204. While the
MPA construes the growth of magazine websites as something good for the industry, there is
reason to doubt that the Web will be a lucrative future home for the industry. According to
Veronis Suhler Stevenson, digital revenues comprised only two percent of all magazine revenue
in 2007, compared with 41 percent for circulation and 58 percent from advertising; by 2012,
digital revenues are expected to grow to only seven percent of all magazine revenues (Pew
Project for Excellence in Journalism, 2009).
Like the magazine industry, the television industry has been the subject of mixed reports
about the Internet’s impact. Nielsen (2008) reports that in the third quarter of 2008, the average
American spent approximately 142 hours watching TV per month, an increase of five hours from
the same quarter in 2007. This increase in television watching took place in spite of a
simultaneous increase of 1.5 hours a month in Internet use. (It is worth noting that 31 percent of
more than eight hours of TV a day, the 2007-08 television season set a record high for television
consumption since Nielsen started measuring it in the 1950s.
On the other hand, a more recent report from Knowledge Networks (2010) shows that
more people are watching television programming on the Internet—a convergence of the two
media that may foretell a permanent change in television as we know it. According to a
Knowledge Networks survey of 1,901 Internet users aged 13-54, the use of the Internet to watch
full TV episodes tripled between 2006 and 2009, meaning that nearly a quarter (22 percent) of
people in this group stream or download complete television episodes from the Internet. Six
percent of respondents said that online television viewing prompted them to reduce or cancel
their television service in the past year, or that they expect to reduce or cancel their service in the
next year. Additionally, seven percent of respondents said they have engaged in “over the top”
viewing, defined as using a TV set to watch Internet video. As one Knowledge Network
executive notes, the growing number of television sets with Internet access, coupled with the fact
that a third of homes with TV have a bundled television/Internet service package, is most likely
accelerating the melding of the two media.
Despite the fact that radio ranks second to television with regard to daily media exposure
among American adults (Nielsen, 2009, November 3), some signs point to radio’s inability to
adapt to the Internet as well as television. Mindlin (2008) reports that the average number of
Americans listening to radio at any given point of the day shrank by 14 percent between 1998
and 2008. One factor in this decline is that today’s teenagers are less interested in radio than
teenagers of past generations. A more significant factor is the growing proportion of college
radio listening time by eight times the amount that nongraduates reduced theirs. One probable
explanation for this trend is that nongraduates are more likely to work in environments that are
conducive to radio listening.
Although pure-play Internet radio (available only through the Internet) has not yet had a
negative impact on broadcast radio, other Internet-based technologies are eroding the time
people spend listening to broadcast radio (Pew Project for Excellence in Journalism, 2010).
According to two Arbitron studies (2008, 2009), the number of respondents who said their use of
an iPod/MP3 player resulted in less radio listening rose from 37 percent in 2008 to 42 percent in
2009; by the same token, the number of respondents who said they listened to Internet radio in
the previous month rose from 21 percent in 2008 to 27 percent in 2009.
While the traditional media discussed above have suffered significant losses or achieved
modest gains, the Internet has experienced dramatic adoption since its introduction in the 1990s.
According to the Pew Internet and American Life Project (Trend Data, 2009), Internet use
among American adults increased from 46 percent in 2000 to 79 percent in 2009. Owing in part
to the Internet’s vast array of uses, recent research has focused on questions of how different
people use the Internet. The graph below (Figure 2) shows generational differences in Internet
activities of online adults.2 As the graph makes clear, teenagers and young adults age 18-32 are
using the Internet for social media, blogging, and media consumption to a much greater extent
than adults age 33 and above.
2 The activity categories were selected for relevance to the current discussion. See the original data from the Pew
Data from Nielsen (2010) reveals the tremendous increases in time that Internet users are
spending on social networking sites. In December 2009, global Internet users spent more than
five-and-a-half hours on social networking sites, an increase of over 158 percent from two hours
and ten minutes in December of 2007. For Americans specifically, total minutes spent on social
networking and blogging sites increased 210 percent year-over-year in the same timeframe, and
the average time per person increased 143 percent year-over-year. Another Nielsen report (2009,
September 24) shows that American advertisers are paying close attention to these trends. From
August 2008 to August 2009, advertising spending on the top social network and blogging sites
increased from roughly $49 million to roughly $108 million—a 119 percent increase in spite of a
recession.
While there is a clear correlation between the overall decline of traditional media and the
rise of the Internet, causation remains to be established. One study (Arbitron & Edison Media
Research, 2006) is unique in presenting self-reported data on the Internet’s effect on traditional
media use. Americans age 12 or older said the Internet was responsible for a decline in their use
of four traditional media formats. A full 30 percent of respondents said they spent less time with
newspapers because of the Internet: likewise with magazines (30 percent), television (33
percent), and radio (19 percent). Despite the inherent weaknesses of self-reported data, subjects
of this study were clearly under the impression that the Internet has a displacement effect on
traditional forms of media.
Media, Opinion Leadership, and Behavior
An appraisal of media habits and trends leads to more probing questions about the
voting behavior among residents of Erie County, Ohio, in the 1940 presidential election.
Lazarsfeld, Berelson, and Gaudet (1968) made several discoveries about media influence that
challenged conventional wisdom of the time—particularly the hypodermic needle model of
communication, which posited media as a potent drug to which audiences were hopelessly
vulnerable. First among the researchers’ findings was that face-to-face communication had more
impact on voters’ decisions than the media. More specifically, participants who were undecided
at the beginning of the campaign were more influenced by interpersonal communication than
radio or print media.
The researchers also learned that patterns of attention to radio, newspaper, and magazine
stories about the campaign were highly selective. Those who rated themselves as very interested
in the election exposed themselves to much more media coverage than those who were
moderately interested or not interested at all. Essentially, propaganda aimed at the masses was
consumed primarily by small subsets of the population—people who not only professed a high
level of interest in the campaign, but typically had a higher socio-economic status and were early
deciders in the election. These individuals would come to be labeled as “opinion leaders” by the
researchers, and they played a critical role in personal influence.
From this 1940 study, the two-step flow theory of communication emerged. According to
the theory, information flows from the media to opinion leaders (step one), and from opinion
leaders to less engaged segments of the population (step two). Opinion leaders maintain a high
level of exposure to certain types of media messages, and individuals with less exposure,
The researchers proposed several reasons why personal influence was more effective than
media in determining voter behavior: 1) Trust—Individuals would be more likely to trust opinion
leaders than the media, knowing that political propaganda is designed to persuade; 2) Exchange
of ideas—Individuals would have a better opportunity to have a conversation with an opinion
leader, who could neutralize the individual’s misgivings on a certain issue; and 3) Social
approval—It was likely that an individual would be rewarded with social approval if he or she
expressed agreement with an opinion leader.
Lazarsfeld executed a second landmark study that led to deeper insights into two-step
flow. Katz and Lazarsfeld (1955) began field work in 1945 on what became known as the
Decatur study, after the Illinois town where it was carried out. The focus of the study was the
role of female opinion leaders as they influenced their friends and acquaintances in four areas of
everyday decision making: marketing, fashion, public affairs, and movies. The researchers
observed that women who were “gregarious”—as determined by the number of their friends and
social organizations—generally offered more opinion leadership. The researchers also
discovered that opinion leaders are recognized by their peers as having above-average
knowledge in a particular subject; for this reason, they are sought out for their advice on specific
topics but generally are not consulted on a wide range of issues.
Two-step flow takes a focused view of the interplay of media, opinion leadership, and
behavior, examining personal influence on a microscopic, person-to-person level. In contrast,
diffusion of innovation—a theory introduced by Rogers several decades later—takes a
macroscopic view, plotting adoption of new behaviors or products on a bell-shaped curve that
Rogers (1995) introduced the theory of diffusion of innovation in 1962 after reviewing
over 500 studies that illustrated various processes and effects of diffusion. Prominent among
them was Ryan and Gross’s 1943 study of the adoption of hybrid seed corn in Iowa. The Iowa
study shifted attention from “pattern to process” in the adoption of innovation (Lowery &
DeFleur, 1995, p. 128). While S-curves had long shown the pattern by which adoptions
accumulate within a population, Rogers’s bell curve finally showed the process by which
adoptions diffuse within a population, starting with innovators and making their way through
early adopters, the early majority, the late majority, and laggards.
According to diffusion of innovation, mass media is the most efficient way to make an
audience aware of a new innovation, while the personal influence of opinion leaders is most
effective in behavior change, or influencing people to adopt. Two-step flow and diffusion of
innovation both posit that the more homophilous the two parties are—i.e., the greater the
similarities in social status, education level, and other defining attributes between opinion leaders
and their followers—the more influential opinion leaders will be.
One theory that does not concern itself with media or opinion leaders is relevant to the
present discussion nonetheless. Granovetter's (1974) theory on the strength of weak ties (SWT)
is an important complement to two-step flow and diffusion of innovation because it helps answer
the basic question of how information travels through social networks in the absence of media
and opinion leaders. The theory emerged from Granovetter’s 1970 study of professionals in a
Boston suburb who had recently found a new job through a personal contact. The workers that
Granovetter studied (all in professional, technical, and managerial positions) were more likely to
percent). Tie strength was determined by how often the job changer saw the contact around the
time the information about the job opportunity was exchanged. The majority of the workers (55.6
percent) obtained new job information through a contact that was somewhere in between a weak
tie and a strong tie.3
Granovetter’s case for SWT in job mobility is based on his contention that individuals
within a close social network, being exposed mainly to each other, will share overlapping
information. Acquaintances are privy to information about job opportunities that an individual
has not heard of already. As Granovetter (1983) suggests, a proper understanding of SWT does
not overlook strong ties but provides a new understanding of the importance of weak ties. Weak
ties serve as conduits of new information, while strong ties exert a strong influence over decision
making.
Two-step flow, diffusion of innovation, and strength of weak ties are theories that
emerged before the age of the Internet but remain useful to marketers in their quest to understand
and leverage word-of-mouth advertising. It is still unclear how the roles of opinion leaders,
innovators, and acquaintances change in the context of viral marketing, which can be described
as a technologically enhanced form of mouth. Viral marketing is similar to
word-of-mouth in that both methods of advertising depend heavily on the flow of information among
consumers. However, viral marketing describes the “epidemic that occurs when a company uses
the network effect of the Internet to create hyper-growth—not found in traditional business
models…” (Knight, 1999, p. 50; italics added). On the Internet, viral messages are dispersed via
3 It is not until his 1983 article on SWT that Granovetter makes clear the correlation between strong ties and contact
email and social media. Because digital technology compresses time and space, online messages
spread more rapidly and more broadly than in the analog world.
Viral marketing is effective for brand awareness because viral campaigns by definition
exploit extensive webs of online social networks. It is less safe to say that viral marketing is
instrumental in getting people to adopt new behaviors or purchase products. Even experts on the
matter such as Li and Bernoff (2008) concede that “[t]here’s no proof—yet—that online buzz
leads directly to sales in every industry.” The authors argue, however, that industry researchers
and academics are finding increasing evidence that “with the right measurements, online word of
mouth is a leading indicator of sales” (p. 92).
The data from Nielsen (2010) above establish that Americans are spending more time on
social networking sites. Li and Bernoff’s (2008) research asks what it is that Americans are
doing on these sites. The researchers coined the term “social technographics” and created the
social technographics ladder to describe six types of social media users. In the table below, each
category represents a group of consumers that is more active in social media than consumers
assigned to lower levels. A consumer need only participate in one of the activities at least once a
month to belong to that group. It is possible for individuals to belong to several different groups,
with the exception of those in the inactive group, which is mutually exclusive with the five active
groups.
SOCIAL TECHNOGRAPHICS LADDER
Category Activities
CREATORS • Publish a blog
• Publish your own Web pages • Upload video you created • Upload audio/music you created • Write articles or stories and post them
CRITICS • Post ratings/reviews of products or services • Comment on someone else’s blog
• Contribute to online forums • Contribute to/edit articles in a wiki COLLECTORS • Use RSS feeds
• Add tags to Web pages or photos • “Vote” for websites online
JOINERS • Maintain profile on a social networking site • Visit social networking sites
SPECTATORS • Read blogs
• Watch video from other users • Listen to podcasts
• Read online forums
• Read customer ratings/reviews INACTIVES • None of these activities
Source: Li and Bernoff (2008, p. 43)
With the right survey instrument, it is possible to create a social technographics profile
for any demographic group that shows what percentage of group members are creators, critics,
collectors, and so on. The social technographics profile can then help marketers pinpoint ways to
target their audience in social media.4 For instance, if a demographic group over-indexes in the
joiners category—as is the case for American young people age 18-27—then sites like Facebook
are a prime area to target those individuals.
4 The social technographics profiles for two segments of American adults—those age 18-22 and all adults with
The social technographics ladder may lead us to wonder how the roles of creators and
critics in the online world overlap with the roles of opinion leaders in the offline world.
However, lacking a body of empirical research on this overlap, we do not yet have answers to
several obvious questions. Are online and offline opinion leaders the same people? Do online
opinion leaders influence behavior as effectively as offline opinion leaders, or do they just raise
brand awareness? These questions are outside the scope of the present study and will appear
again below in suggestions for future research.
College Marketing for Student Recruitment
College marketing for student recruitment and academic event marketing on college
campuses both ask the question of what students seek in return for their academic investments.
Given this common central question, college marketing may yield insights relevant to academic
event marketing. Although the present study does not attempt to test college marketing tactics for
their effectiveness in academic event marketing, a brief overview of college marketing is
pertinent to the marketing recommendations below. The following paragraphs take a brief look at
recent trends in college marketing and prominent themes in college viewbooks, which continue
to play an important role in student recruitment even in the age of the Internet (Jaschik, 2005).
Results of a 2007 survey conducted by Lipman Hearne and CASE (Council for
Advancement and Support of Education) reveal several noteworthy trends in college marketing.
First, it appears that college marketing pays off. Institutions that invest “heavily” in marketing
(defined as more than 0.5 percent of operating budget, excluding staff benefits and salaries) do a
better job attracting quality applicants and increasing enrollment yield than those that do not
marketing investment since 2000, when the authors performed a similar study. Many colleges
and universities are now investing in emerging technologies to engage with alumni and
prospective students. More than two-thirds of the institutions in the study’s sample reported
using e-communications, virtual tours, and streaming video to attract students. Institutions with
mid-level and larger budgets invest in more cutting-edge technologies, like microsites, student
blogs, and podcasts. Institutions with smaller budgets are just as likely to use website updates,
e-communications, and virtual tours as those with mid-level and large budgets. College marketers’
increased attention to Web-based technologies since 2000 suggests they are aware of young
people’s Internet habits, such as those reported above from the Pew Internet and American Life
Project (Trend Data, 2009). Even still, the biggest portion of college marketing budgets is still
devoted to non Web-based advertising, print publications, and mailings.
Lipman Hearne and CASE found that in addition to increased marketing investment,
targeted marketing activities yield tangible results. Targeted marketing initiatives correlated not
only with improved applicant quality, but with a greater percentage of alumni who donate.
Lewison and Hawes (2007) recommend that colleges differentiate their audiences because
segmentation enables universities to develop a target marketing approach. The authors contend
that university marketers who fail to acknowledge differences among students practice “mass
marketing, or perhaps even non-marketing” (p. 16).
Finally, Lipman Hearne and CASE found that investment in internal communications—
such as emails, campus events, and an intranet—increased on-campus collaboration, the number
and pride in an institution, as well as buy-in for the institution’s strategic direction. This goes a
long way in branding the institution for external audiences.
Hartley and Morphew (2008) turned to college viewbooks for insight into college
marketing messages. A content analysis of 48 viewbooks from colleges and universities across
the U.S. yielded six prominent themes, as follows.5
PROMINENT COLLEGE VIEWBOOK THEMES
Theme Examples
Institutional context / campus
features • Great location • Campus beauty • Campus landmarks
• Diversity of the student body • Use of technology
Academics/faculty • Curriculum/Majors
• Student/Faculty interaction • Low student/faculty ratio • Chance to study abroad
Co-curricular opportunities • Students having fun
• Students engaged in non-sports activities (e.g. clubs) • Varsity and intramural sports
• Residence life (housing, dining)
Admissions and financial aid • Admissions requirements
• Presence of financial aid/scholarships • How to visit campus
Value of an education • Successful alumni
• Validation through external rankings or guidebooks • Read online forums
• Read customer ratings/reviews Purpose of higher education • Preparing students for a job
• Formative/developmental
Source: Hartley and Morphew (2008, p. 678)
The researchers describe the widespread use of the six themes to portray an idyllic life for
students, communicated through the accentuation, omission, or misrepresentation of aspects of
college life. For example, most viewbooks in the sample devoted their first pages to attractive
campus features. Likewise, most depicted a vibrant student body of young, fun-loving, and
diverse individuals while omitting references to non-traditional students (commuters) and
transfer students. Depictions of study abroad were “more suggestive of tourism than academia”
(p. 680), faculty were touted as being always available for students in need, and descriptions of
financial aid avoided hard numbers while stressing affordability and the institution’s
commitment to working with students to find a financial solution. By and large, the viewbooks
underplayed the solitary work that goes into getting a college degree. Only half the viewbooks
contained any images of students studying; among those that did, students were most often
shown studying in groups.
Hartley and Morphew are careful to present the six themes as descriptive rather than
prescriptive. They note the absence of references to societal benefits of formal education, even
though such messages are common in statements intended for faculty and board members
(Morphew & Hartley, 2006). In the majority of viewbooks in the 2008 study, students were
framed as the primary beneficiaries of the growth and enrichment, career development, and
earning potential that come with a college education. Hartley and Morphew warn that the
emphasis on the individual in college viewbooks may betray a lack of understanding by college
marketers of their audience. The researchers cite statistics about the activist nature of young
people today. For instance, in 2006, 83 percent of incoming college freshmen had done volunteer
work, and 49 percent had participated in a demonstration during the previous year. These
students, the researchers argue, may be more enticed by messaging that includes opportunities
conducted by the Education Conservancy that revealed that students dislike “disingenuous”
recruiting efforts and “generic” marketing collateral. According to these students, most colleges
“sound alike” (Jaschik, 2007).
The relevance of college marketing to academic event marketing can only be intuited; all
we know is that both forms of marketing strive to attract students with the promise of a
memorable learning experience. But given the dearth of research on academic event marketing,
college marketing resources may be a useful proxy. Suggestions for future research on the
connections between college marketing and academic event marketing will be discussed in
further detail below.
Methods
Because the research questions focus on event marketing on college campuses, an online
survey was distributed to RIT professors and students via Clipboard (an online survey system
developed by The Wallace Center at RIT). The survey instrument, found in Appendix B,
contained three sections.
The first section addressed RQ 1 (What do professors, graduate students, and
undergraduates say their media habits are today?) by asking respondents to indicate the amount
of time they spent engaged in a variety of media activities both “yesterday” and “the day before
yesterday.” These activities included traditional media behaviors (e.g., watching television and
listening to the radio) and newer media behaviors (e.g., consuming Web content and
Because of the dramatic increase that social media has experienced in recent years
(Nielsen, 2010), the preferred social media websites of students and professors were of particular
interest. The final question in Part 1 probed respondents’ use of social networking and social
media websites. This question asked respondents to indicate how often they visit each of 13
social networking and media websites, with options ranging from “Never” to “Several times per
day.” The first draft of the survey instrument contained 18 social networking and media sites
pulled from two sources: Alexa’s (n.d.) ranking of the top 100 U.S. websites as of December 18,
2009, and a Nielsen report (2009, June 2) on the top 10 social networking and blog sites in the
U.S. The two sources contained five overlapping websites. An additional website, delicious.com,
was added because of anecdotal evidence of its popularity.
A pre-test group of 10 RIT undergraduates, one RIT professor, and one University of
Rochester professor completed the survey draft. Six websites that were consistently rated as
“never” visited were removed from the list. Pre-testers were allowed to add up to five additional
social networking and media websites. Only one pre-tester came up with an additional site.
Because this site was mentioned by no other pre-testers and seemed unlikely to resonate with
survey respondents, it was not included in the final survey.
Part 2 of the survey was devoted to RQs 2 through 5. Instead of asking respondents how
they would most likely learn and share information about a hypothetical event, and what would
motivate them to attend the event and mention it to others, the survey required respondents to
answer questions about an actual event on campus. The event was defined as a talk or
demonstration open to the RIT community. Within the given criteria, respondents were able to
professors in the pre-test group, everyone was able to remember a talk or demonstration that had
taken place on campus (or that was scheduled to take place at a future date at the time of the
pre-test survey).
The survey pre-test helped gauge the clarity and appropriateness of questions, as well as
the amount of time necessary for survey completion. Transferring the paper pre-test survey to an
online format (in Clipboard) required several modifications that rendered the survey more simple
and therefore easier to use. The Clipboard survey was designed to branch in as many as seven
different places, so the online survey was tested once by each of three RIT professors and a total
of 19 times by the author (assuming various personae and answering questions along all possible
branching paths) before being released to respondents.
The survey was emailed in the early spring of 2010 to all RIT professors, all graduate
students, and all undergraduates majoring in programs within the College of Liberal Arts.
Because RIT’s faculty and staff listserv is closely guarded, the alphabetical directory of faculty
and staff posted publicly on RIT’s website (www.rit.edu/its/services/tele/phonebook) served as
the source for all professor email addresses. Only faculty whose titles contained the words
“department chair,” “program chair,” or “professor” were included in the survey email, which
went to 708 faculty recipients. Sending the survey to students was a less complicated affair. The
survey was emailed to all RIT graduate students via listserv from the Office of the Dean of
Graduate Studies and to all undergraduates in the College of Liberal Arts via listserv from the
Department of Communication. Faculty and graduate students received only one email asking
them to take the survey. COLA undergraduates received an initial request and a reminder email
Results and Discussion
The sample included 59 professors, 127 graduate students, and 34 undergraduates.
Respondents ranged in age from 18 years to 68, with a mean age of 33 years and a median age of
26. Males comprised 58 percent of the sample. RIT’s eight colleges were represented more or
less equally, with one exception: the College of Liberal Arts (COLA) was overrepresented by
undergraduates due to the fact that only students majoring in COLA programs received the
survey.
Assessment of Media Habits
RQ 1 asked what professors, graduate students, and undergraduates say their media habits
are today. Part 1 of the survey gathered information on general media habits before homing in on
social media use. Even though significant differences emerged among groups for specific media
activities, general trends in time expenditures were observable by category. The sample spent the
most time with Web-based media, followed by traditional electronic media (e.g., television and
radio) and finally print media. Respondents used the scale in Table 1 to indicate their time spent
engaged with eight media activities both “yesterday” (survey question 1) and “the day before
yesterday” (survey question 2).
Table 1
Scale for Time Spent with Media Activities
Time
Spent hours 0 Less than 1 hour
1 hour to less than 2
hours
2 hours to less than 3
hours
3 hours to less than 4
hours
More than 4 hours
Media routines can vary from day to day: in order to achieve a more accurate sense of
typical media use, the self-reported data from both days (yesterday and the day before) were
combined before mean scores were computed. A one-way analysis of variance (ANOVA)
revealed no statistically significant differences in the amount of time that professors, graduate
students, and undergraduates spent watching television, listening to the radio, or reading a
printed magazine. However, significant differences in time expenditures emerged for the
remaining five media activities. Table 2 lists mean scores for each group and shows where
statistically significant differences appeared between groups, as revealed by a Tukey post-hoc
Table 2
Mean Scores for Time Spent with Media Activities Over Two Days
Media Activity Professors Graduate
Students Undergraduates All Respondents
Watching broadcast or cable TV on a television set
5.20 5.05 5.29 5.13
Listening to the radio 4.10 3.78 4.09 3.91
Reading a printed magazine 3.31 2.96 3.15 3.08
Reading a paper newspaper 3.17a 2.57a,b 2.21b 2.68
Reading or hanging flyers or
posters in campus facilities 2.53 2.42
a 2.85a 2.52
Reading and writing email 6.31a,b 5.13a 4.94b 5.41
Sending or reading text messages
2.81a,b 3.87a,c 5.35b,c 3.82
Reading, watching, listening to, or creating website content
5.75a 6.83a 6.94 6.56
Newspaper reading and the reading or hanging of advertisements in campus facilities
were the two non-digital media activities in which groups differed significantly. Professors spent
significantly more time reading a paper newspaper (F = 13.749, df = 2, p < .001) than both
graduate students and undergraduates. This is likely due to the age gap between professors,
graduate students, and undergraduate students (respective mean ages of 51, 28, 22) and the
tendency for younger people to have lower readership levels when it comes to print newspapers
(Pew Project for Excellence in Journalism, 2010). For the category of reading or hanging flyers
or posters in campus facilities (F = 3.122, df = 2, p = .046), only graduate students and
undergraduates differed significantly, with undergraduates reporting more time spent engaged
with this activity. The difference may be due to the large variety of extracurricular activities for
undergraduates and the need for students to advertise them. It is also possible that with the
majority of undergraduates living on campus, these students spend more time in campus facilities
than graduate students.
Most of the differences in media habits occurred within the realm of digital technologies.
Professors reported spending significantly more time reading and writing email than graduate
students and undergraduates. This point might challenge conventional wisdom that young adults
spend the most time with Internet technologies, a notion supported by recent data that suggest
Internet users skew young. Ninety-three percent of Americans adults age 18-29 use the Internet,
compared to 81 percent of those 30-49, 70 percent of those 50-64, and 38 percent of those 65 and
older (Pew Internet and American Life Project, Trend Data, 2009). However, educational
attainment tends to level the playing field, with 94 percent of college graduates using the
age groups: 94 percent of those 18-32, 93 percent of those 33-44, 90 percent of those 45-63, and
64 percent of those 64-72 (Pew Internet and American Life Project, Infographics, 2009). The
research instrument for the present study was an online survey emailed to respondents, so there is
no question that 100 percent of the sample were online adults who use email. The extra time that
professors reported spending on email may be due to the extra care and attention that email
communication requires within a professional academic context.
The difference between professors and students in time spent on email may be further
explained by the possibility that graduate students and undergraduates use texting and social
media for communication that would have transpired over email in the past. This notion is
supported by the survey data. Undergraduates spent the most time texting, followed by graduate
students and professors, with significant differences between each group (F = 25.316, df = 2, p <
.001). Graduate students spent significantly more time than professors creating or consuming
website content (F = 3.367, df = 2, p = .036). Undergraduates spent even more time than
graduate students with website content, but analysis yielded no significant differences between
undergraduates and professors. This is likely due to the small sample size of undergraduates. The
use of social media may explain why graduate students and undergraduates reported greater time
expenditures than professors on website content. Survey respondents used the scale in Table 3 to
indicate how often they visit 13 websites culled from authoritative sources on the
highest-ranking social media websites (Alexa, n.d.; Nielsen, 2009, June 2). Professors showed the lowest
mean rank in visitation rate for 12 of 13 websites. This disparity corroborates data that suggest
considerable generational differences in the use of social media. While 67 percent of online
33-44, 20 percent for those 45-54, 9 percent for those 55-63, and 11 percent for those 64-72 (Pew
Internet and American Life Project, Infographics, 2009).
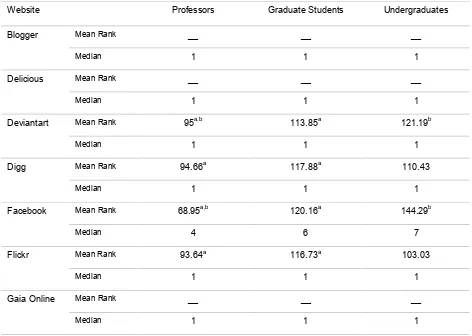
A Kruskal-Wallis ANOVA was run for each social media website. Only three websites—
Blogger, Delicious, and Gaia Online—showed no significant differences among groups in the
distribution of answer choices.6 However, significant differences emerged for the remaining 10
websites. Table 4 lists the mean rank and median for each group in the sample and shows where
statistically significant differences appeared between groups, as revealed by a post-hoc pairwise
comparison.
6 Blogger, as its name suggests, is a blogging website. It hosts free blogs for users. Delicious allows users to share
Table 3
Scale for Frequency of Visiting Social Media Websites
Frequency of Visits
Never Less than once per year
Once per year Several times per year Several times per month Several times per week Several times per day
Coded As 1 2 3 4 5 6 7
Table 4
Median Scores for Frequency of Visiting Social Media Websites
Website Professors Graduate Students Undergraduates
Mean Rank __ __ __
Blogger
Median 1 1 1
Mean Rank __ __ __
Delicious
Median 1 1 1
Mean Rank 95a,b 113.85a 121.19b
Deviantart
Median 1 1 1
Mean Rank 94.66a 117.88a 110.43
Digg
Median 1 1 1
Mean Rank 68.95a,b 120.16a 144.29b
Median 4 6 7
Mean Rank 93.64a 116.73a 103.03
Flickr
Median 1 1 1
Mean Rank __ __ __
Gaia Online
[image:38.612.70.542.315.651.2]Mean Rank 102.13 120.55a 84.57a LinkedIn
Median 1 4 1
Mean Rank 102.97a 114.07a 104.04
LiveJournal
Median 1 1 1
Mean Rank 96.34a 113.21 121.31a
MySpace
Median 1 1 1
Mean Rank 97.12a,b 114.56a 118.57b
Photobucket
Median 1 1 1
Mean Rank 89.48a,b 117.73a 119.97b
Median 1 1 1
Mean Rank 80.58a,b 117.43a 133.51b
YouTube
Median 5 5 6
Note: Mean rank is not calculated when no significant differences appear between groups.
The media-sharing websites showed varying differences among groups. The list included
two photo-sharing websites, Flickr and Photobucket. Professors reported a significantly lower
visitation rate to Flickr than graduate students (H = 7.59, df = 2, p = .023) and a significantly
lower rate to Photobucket than both graduate students and undergraduates (H = 9.28, df = 2, p =
.01). Even though students as a whole reported visiting these photo-sharing sites more often than
professors, the median for each group still reflected the lowest answer on the scale (one, or
“never”), suggesting infrequent use among all three groups.
YouTube was among the most frequently visited websites in the list. Graduate students
and undergraduates reported significantly higher visitation rates to YouTube than professors (H
= 20.59, df = 2, p < .001). The time it takes to watch videos online may contribute to the extra
time that students spend online compared to professors, as discussed above.
Deviantart occupies its own category as an online creative community where users post
original artwork and interact with each other. Although professors reported a significantly lower
visitation rate than graduate students and undergraduates (H = 13.39, df = 2, p = .001), each
group’s median score reflected the lowest point on the answer scale, suggesting that Deviantart is
not popular with any single group.
For Digg, URLs themselves are the medium for sharing. Digg members post links to
Internet content in a forum where other members can vote for the link (or “Digg” it), sending the
most popular links to Digg’s main page. Even though Digg icons are often found among the
share buttons increasingly common on websites, median scores for visitation rates were low.
Professors reported a significantly lower visitation rate to Digg than graduate students (H =
The third category of social media websites is devoted to blogging/micro-blogging and
social networking. This category includes LiveJournal, Twitter, Facebook, MySpace, and
LinkedIn. Keeping with the pattern of less social media usage overall, professors reported
visiting LiveJournal significantly less often than graduate students (H = 7.14, df = 2, p = .028).
Professors also visited Twitter significantly less often than graduate students and undergraduates
(H = 13.88, df = 2, .001). However, even the most frequent Twitter users, undergraduate
students, had a median score of one (or “never”).
Although Facebook and MySpace are often mentioned in tandem as icons of the social
media movement, Facebook far outpaced MySpace in visitation rates among the three groups of
respondents. For MySpace, undergraduates emerged as the most frequent users, with a
significantly higher visitation rate than professors (H = 7.97, df = 2, p = .019). However,
undergraduates’ median score still reflected the lowest answer on the scale. In contrast,
Facebook was the most frequently visited site in the list. Even the least frequent visitors,
professors, showed a median score of four (or “several times per year”). Professors reported
visiting Facebook significantly less often than graduate students and undergraduates (H = 40.92,
df = 2, p < .001). The data on MySpace and Facebook from the present survey agree with a
broader trend reported by Nielsen (2009, June 2): from April 2008 to April 2009, total time spent
on Facebook increased 700 percent, while total time spent on MySpace decreased 31 percent.
LinkedIn is the only social media website for which professors did not show the lowest
mean rank. Graduate students reported the highest rates and differed significantly from
dedicated to professional networking, it may hold more appeal for professors and graduate
students than for undergraduates, who have not begun their careers.
The data described above help answer the question of what professors, graduate students,
and undergraduates say their media habits are today. Several differences were noted among the
three groups with regard to time expenditures in a variety of media activities. In the category of
non-digital media, professors spent the most time reading newspapers, while undergraduates
spent the most time reading or hanging flyers and posters on campus. Among digital
technologies, professors spent the most time on email and the least time engaging website
content, and undergraduates spent the most time text messaging.
Social media may help explain why students spent more time than professors engaged
with website content. Professors showed the lowest mean rank for 12 of 13 social media
websites. Facebook and YouTube stood out as the most frequently visited social media sites,
with LinkedIn trailing at a distant third. The websites in the survey lineup were culled from lists
of top-ranking social media sites, so it is somewhat surprising that the majority of sites showed
signs of neglect from all three groups. These websites likely have vast audiences beyond (but not
excluding) college professors and students.
Media Used for Learning and Sharing Information about Academic Events
RQ 2 asked how professors and students learn about academic events. Part 2 of the
survey instrument contained questions designed to answer this question. First, respondents were
asked to recall an event on campus, defined as a talk or demonstration open to the RIT
community. No time range was set, so individuals were free to choose a presentation that
that respondents answered questions about a single event, they were asked to recall the name of
the presenter, the topic of the presentation, and the actual or approximate date of the event.
Respondents were more likely to choose an event they had actually attended or still planned to
attend. Professors reported the highest rate of actual or planned attendance, at 84 percent,
compared to 79 percent of graduate students and 58 percent of undergraduates.
Respondents indicated how they first learned about the presentation by selecting one
option from a range of possible channels that included “Other,” followed by a blank field for
explanation. Answers submitted as “Other” were grouped by similarity and coded as their own
variables. A chi-square test showed no significant difference in how professors, graduate
students, and undergraduates reported first learning about the presentation. Table 5 shows how
Table 5
How Respondents First Learned about the Presentation
Answer Choices Professors Graduate
Students Undergraduates
Email from someone I know 17% 6% 4%
Email announcement from an RIT department, employee, or student organizer
60% 54% 50%
Flyer or poster hanging on campus 7% 14% 21%
Someone told me face to face or by
telephone 5% 19% 14%
Through a social networking website
(e.g., Facebook or Twitter) 2% 1% 4%
Letter or postcard 0% 0% 4%
I used a search engine like Google to learn about the presentation.
0% 0% 0%
I helped organize it.* 5% 1% 0%
Newspaper* 0% 1% 0%
Other website (not a social networking site)*
2% 2% 0%
Other 2% 1% 4%
For all three groups, email announcement was the most common first introduction to the
presentation, with at least half the members of each group selecting this option. The second most
common channel differed from group to group. For professors, it was an “email from someone I
know.” (Respondents were expected to use their judgment to decipher the difference between an
“email from someone I know” and an “email announcement” from an RIT entity.) For graduate
students, the answer option “someone told me face to face or by telephone” was rated second
highest. For undergraduates, it was a flyer or poster hanging on campus. Connections can be
made between the data on media time expenditures above and the ways that respondents first
learned about the presentation. For instance, professors spent the most time with email, so it
seems fitting that a full 77 percent of professors first learned about the presentation by email.
Undergraduates spent the most time with flyers and posters on campus, and 21 percent of
undergraduates first learned about the presentation from a flyer or poster. Given how much more
time students spent than professors on website content (including social media), it is surprising
that more students did not report a social networking site as the means of introduction to the
event. This suggests that academic event marketers are not tapping social media as much as they
could be. It is worth noting that no respondents used a search engine to find out about the event.
This suggests that academic event marketing belongs in the realm of “push” rather than “pull”
marketing strategies.7
After revealing how they first learned about the presentation, respondents indicated the
first advertisement they saw for the event. The first answer option for this question was “None. I
7 Push strategies include methods of advertising such as commercials, direct mail, and banner ads—media that
never saw any advertisements for the presentation.” The respondents who chose this answer
branched to another part of the survey. The percentages in Table 6 pertain to respondents who
reported seeing at least one advertisement. A chi-square test revealed no significant difference in
the type of ad first seen by the three groups. Notably, email announcements and flyers comprised
Table 6
First Advertisement Seen
Answer Choices Professors Graduate
Students Undergraduates
Email announcement from an RIT department, employee, or student organizer
79% 62% 48%
Flyer or poster hanging on campus 15% 33% 40%
Posting on or from a social networking
site (e.g., Facebook or Twitter) 2% 1%
4%
Letter or postcard 0% 0% 0%
Website 2% 2% 4%
Magazine 0% 0% 4%
In addition to asking respondents to indicate the format of the first advertisement they
saw, it was important to ask them what it was about the ad that won their attention. The majority
of respondents—88 percent of professors, 81 percent of graduate students, and 72 percent of
undergraduates—answered yes to the question of whether the first ad they saw contributed to
their interest in the presentation. Respondents then assessed six different advertisement attributes
and indicated their level of importance in gaining and holding the individual’s attention. The
scale included four options: Not Important (coded in the survey data as 1), Moderately Important
(2), Important (3), and Does Not Apply (0). Only answers coded as 1, 2, or 3 were included in
statistical analyses. Table 7 lists mean scores for level of importance and shows where
statistically significant differences appeared between groups, as revealed by a Tukey post-hoc
Table 7
Importance of Advertisement Attributes
Attributes Professors Graduate Students Undergraduates
A clear message about what I would learn
at the presentation 2.78 2.68 2.83
A high level of professionalism in the
design and/or ad copy 2.14
a 2.38 2.59a
A thought-provoking message 2.08a 2.35 2.59a
Bold shapes, colors, and/or photographs 1.56a 1.78 2.28a
Strategic placement of the ad (e.g., in my mailbox, my Inbox, a prominent location on campus, in a magazine I read, etc.)
2.52 2.55 2.59
Seeing the same ad more than once 1.93 2.03 2.28
For each group, the most important advertisement attribute was a clear message about
what would be learned at the presentation. The second most important attribute was strategic
placement of the ad. Significant differences emerged only between professors and
undergraduates, for the following attributes: a high level of professionalism (F = 3.48, df = 2, p =
.034), a thought-provoking message (F = 3.74, df = 2, p = .026), and bold design features (F =
4.55, df = 2, p = .013). These differences suggest that undergraduates pay more attention to
attention-grabbing language and imagery, while professors base their level of interest in ads on
more subtle factors. Graduate students hover between professors and undergraduates for every
attribute except “a clear message,” for which graduate students’ mean rating for importance was
lower (but not significantly) than the other two groups.
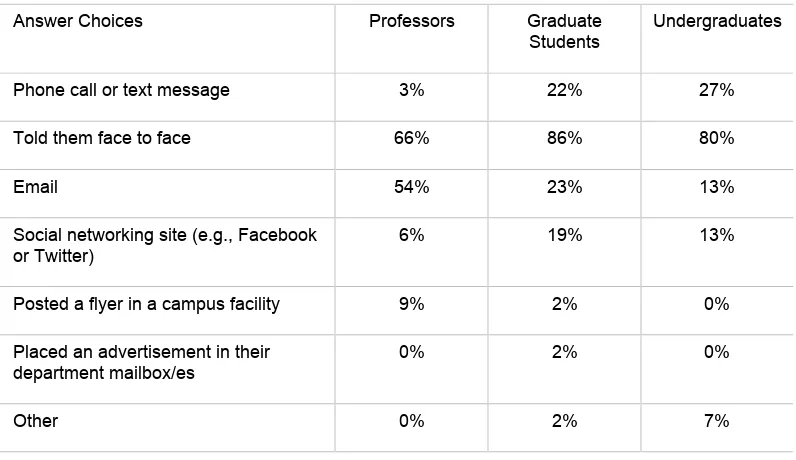
RQ 3 asked how professors, graduate students, and undergraduates share news about
academic events with others. Respondents answered questions about how they told peers about
the presentation. Students were instructed to define peers as other students, while professors
were instructed to define peers as any other RIT employees. A chi-square test revealed no
significant differences in the number of professors, graduate students, and undergraduates who
told peers about the presentation. Overall, respondents appeared to be a gregarious group: 60
percent of professors, 58 percent of graduate students, and 45 percent of undergraduates reported
having spread the word about the presentation to peers. Table 8 shows the methods of
Table 8
How Professors and Students Told Peers about the Presentation
Answer Choices Professors Graduate
Students Undergraduates
Phone call or text message 3% 22% 27%
Told them face to face 66% 86% 80%
Email 54% 23% 13%
Social networking site (e.g., Facebook
or Twitter) 6% 19% 13%
Posted a flyer in a campus facility 9% 2% 0%
Placed an advertisement in their
department mailbox/es 0% 2% 0%