Detecting Hollow Pallets
By
Sheng Zuo, MComp
A dissertation submitted to the
School of Computing and Information Systems
In partial fulfillment of the requirements for the degree of
Master of Computing
DECLARATION
ShengZuo November 2009
ABSTRACT
ShengZuo November 2009
ACKNOWLEDGEMENTS
ShengZuo November 2009
As the deadline for thesis submission is close, I find my thoughts are remembering the year which has just past. Many people deserve my thanks for both assistance with my work and indirect support during this endeavor. I hope this brief token is sufficient to express my gratitude.
My first thanks are to my wonderful supervisor, Mrs. Jacqui Hartnett. Without her help this work would never reach completion. I appreciate her for the time, ideas, books and finances she has contributed to this research.
Continuing with my gratitude, I want to thank my advisor Mr. Luke Mirowski for his suggestions, proof reading and patient handling of questions. He has helped improve my learning ability a lot.
I would like to extend my thanks to Mrs. Louise Oxley and Mrs. Morag Porteous for helping me improve academic writing skills.
I am grateful to all the staff in the School of Computing and Information Systems for their support over the past year. To my fellow students, I thank you for a most interesting and memorable year.
TABLE OF CONTENTS
ShengZuo November 2009
1 Introduction ... 1
2 Literature Review ... 4
2.1 Introduction ... 4
2.2 Transportation Issues in the Salmon Industry ... 5
2.3 RFID Overview ... 7
2.3 .1 RFID Applications ... 8
2.3.2 RFID Architecture ... 10
2.3.3 Advantages of RFID ... 16
2.4 Factors limiting RFID to solve the hollow pallet problem ... 18
2.4.1 Causes of failed tag read ... 18
2.4.2 Factors affecting tag read rate ... 21
2.4.3 Other factors ... , ... 24
I 2.5 Faraday Cages ... 25
2.6 Pallet Configuration and Item Level.. ... 27
2.6.1 RFID Tagging levels on a pallet ... 27
2.6.2 Item-level Tagging in the Real World ... 28
2. 7 Previous Work ... 29
2.8 Summary ... 31
3. Methodology ... 33
3.1 Introduction ... 33
3.2 Environment and System Architecture ... 33
3 .2.1 Experiment Environment ... 33
3.2.1.1 RFID Reader ... 34
3.2.1.2 RFID Tags ... 34
3.2.1.3 RFID Applications ... 35
ShengZuo November 2009
3.3 Experiment Methods ... 36
3.3.1 Three Phases ... 36
3.3.2 The Number of Replications ... 41
3.3.3 The 2k Factorial Design ... 44
3.4 Summary ... 45
4. Results ... 47
4.1 Phase One Results ... 47
4.2 Phase Two Results: using bottles of water ... 50
4.3 Phase Three Results: changing method ... 56
4.4 Results Discussion ... 59
5. Conclusion and Further Work ... 61
6. References ... , ... 64
7. Appendices ... 69
Appendix A - Statistical Java code ... ·: ... 69
Figures
ShengZuo November 2009
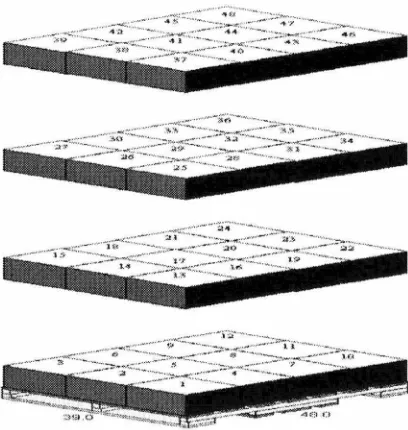
Figure 1 -A pallet with 48 cartons on a board (Clarke et al. 2006) ... 4
Figure 2 - Relationships among different types of RFID applications ... 8
Figure 3 - An RFID system at item level tagging ... 10
Figure 4 - Physical components of an RFID reader ... 13
Figure 5 - Conceptual architecture for an RFID middleware product ... 15
Figure 6 - Slotted Aloha protocol.. ... 19
Figure 7 - Average number of tags identified per frame ... 21
Figure 8 - Tag read rate when distance increases ... 23
Figure 9 - RF signals are blocked by a Faraday cage ... 26
Figure 10 -Three levels of tags on items, cases and the pallet.. ... 27
Figure 11 - Tags and reader orientation ... 30
Figure 12 - A bottle attached with a tag used in the experiment ... 35
Figure 13 -Tag response rate versus distance between readers and tags ... 38
Figure 14-Plot of cumulative mean for 95% confidence interval ... 44
Figure 15 - A 2k factorial design example when k is 2 ... 45
Figure 16-Results of Phase One ... 49
Figure 17 - Results of Phase Two ... 53
Figure 18 - Increasing size of the hollow ... 55
Figure 19 - Results of Phase Three ... 57
Figure 20 - Locating positions of empty bottles ... 58
Tables
Table 1 - RFID frequency band categories ... 14Table 2 - Confidence interval results from 4 replications to 11 replications ... 43
Table 3 - The results of empty boxes using inventory protocol.. ... 47
Table 4 - Empty pallet when persist time is 0 ... 51
1
Introduction
ShengZuo November 2009
Radio Frequency Identification (RFID) is a technology based on devices using radio signals to identify data. With implementation of RFID, each individual object cart be identified by attaching a small tag or label on it (Thornton et al. 2006). Inspired by implementation of RFID technology, an RFID-based tracking system attempts to detect whether or not there is item loss on a pallet in a transportation and logistics area. The tag receives a radio signal, typically from a reader, and sends back information on it, such as item ID, content and production date. The pieces of information in tags identify the items to which the tags are attached. These processes are similar to asking a question "What are you" and responding with "I am Item Number 00001". By this method, individual items on a pallet can be tracked in transporting processes. This method is known as item-level tagging. However, an extended question is that although response information from tags indicates that cartons are on a pallet, it cannot guarantee that the contents of the cartons are there. In this research, a method to detect whether or not the contents are missing will be explored.
ShengZuo November 2009 Item loss refers to unexpected and unexplainable product shrinkage, which has caused a large amount of retailers to lose significant profit. It is a serious problem in retail and logistic areas as loss has been estimated to reach 1.7% of the sales profit. Nearly 77% of the product reduction was caused by theft (Barna, Mani & Whinston 2006). RFID has been used as an effective means to detect whether a carton is missing on a pallet, so as to address this problem. Large retailers, such as Wal-Mart and Target, plan to implement this technology with all their suppliers. The savings in theft reduction of Wal-Mart was estimated to reach $575 million (Asif & Mandviwalla 2005). The overall saving in product shrinkage in the retail area with the use of RFID was estimated at US$19.06 billion (Barna, Mani & Whinston 2006). Moreover, RFID reduces labor participation in processes, such as data recording and carton inspecting. The labor cost declined by 25%, estimated at US$102.95 billion (Barna, Mani & Whinston 2006). However, although RFID-based item tagging is able to detect carton loss on a pallet, it cannot detect whether or not the contents inside the cartons are missing.
Extending from item loss, a hollow pallet refers to the problem that the cartons are there but contents of a pallet or cartons are missing. It is a real problem when the hollow occurs in the center of the pallet, because it is difficult to visually inspect if the pallet is actually hollow. Finding a method of detecting hollow pallets is necessary, because it costs a large amount of revenue in retail and logistic industry. Traditionally, weighting the pallet is used to find whether or not there are empty cartons on pallets. This is not a good method as it takes more time, requires the use of a weigh bridge, costs more profit, and needs labor participation. On the other hand, RFID technology, which has already been implemented to identify cartons, could be extended to see whether or not the contents of the cartons are there.
ShengZuo November 2009 the reader. By observing the difference in these data, hollow pallets can be detected. Therefore, the hypothesis is that the hollow inside a pallet can be found by evaluating data with passive RFID. If this method works, it means that RFID is able to detect a hollow pallet, in addition to identifying and tracking cartons on it.
Therefore, the aim of this research is to detect whether or not the contents of cartons are missing. The problem to be investigated extends from item tracking. In the experiment of this research, tags will be applied
to
each carton to find out which carton's content is missing. The results are expected to be applied in the salmon transporting area, in order to investigate if there is salmon missing or not. Thus, the experiment in this research will simulate goods transportation in fish farming. To this end, Chapter 2 presents an overview of current literature first, bringing a more in depth understanding of RFID system architecture and how it may be used to solve this problem. This also highlights solutions and results from previous researches that investigated similar prob~ems.Chapter 3 discusses the design and test method used in the experiment. Testing is
2
Literature Review
Sheng Zuo November 2009
This chapter introduces the hollow pallet problem which needs to be detected in this research, and discusses the principles of RFID that can be used to solve this problem. It will firstly present the motivation for this work. Following that, an overview of the basic concept of RFID technology will be given. Then it will discuss the factors which limit the use of RFID technology including the collision problem. The following section will
explore how the above factors can be used to solve the problem in this research. In addition, the basic solution that would be used in the experiment will be discussed. Finally, results from previous research in this area will be presented.
2.1
Introduction
The problem to be investigated is the hollow pallet that the contents of the center cartons
[image:11.568.168.372.442.657.2]on a pallet are missing. A pallet is a flat structure which is used to transport goods. It usually consists of many cartons (Figure 1). As in shown Figure 1, No. 29, 32, 17 and 20 may be empty.
ShengZuo November 2009 In many cases it is impossible to find whether there is a hollow by inspecting every carton. Radio Frequency Identification (RFID) system technology will be investigated as the means to address the hollow pallet problem. RFID refers to any system of identification in which electronic devices use radio frequency to communicate. An RFID system basically comprises three components: tags, which are the devices attached to items so as to identify and track them; readers, which can detect the tags and collect the information stored in them, and middleware, which builds up communication between reader and applications (Glover & Bhatt 2006). In general, RFID captures the information from the tags so that people may use the data to track and identify items in transporting processes. However, RFID is not mature as it cannot guarantee 100% read rate. The read rate is affected by a lot of factors. This research will make use of this feature to detect whether there is a hollow in a pallet.
2.2
Transportation Issues in the Salmon Industry
Before presenting the RFID system, which will be used in this research for proving or disproving the hypothesis, attention can be paid to addressing the hollow pallets problem in salmon shipping.
Logistic services provided by carriers· were evaluated to determine the most important factors. Item loss, caused by transportation firms, was considered as the second most important problem following reliability (Lu 2000). This research aims to investigate an effective way to detect whether there is any content missing on a full pallet, with the use ofRFID technology. The results have benefits in packing and shipping salmon in logistic area.
ShengZuo November 2009 about 66% of the Norway's production was consumed in European Union, 5% were in the US and 13% was shipped to Japan. Problems in transporting processes affect those markets far away from the suppliers. For example, a disadvantage for Chile is the long distance to the European market, and Norway .needs to supply fresh salmon to the markets in the Far East (Asheim et al. 2005). Due to this, the salmon industry tends to use ice to keep the salmon in a low _degree environment during the long distance transport, to both keep the quality and lower the cost of transportation. However, problems exist and cause profit reduction.
One of the worst problems is inaccurate data. The poor quality of data increases the cost to detect and correct the errors (Redman 1998). Profit was found to be reduced by 25% due to cases where an item was actually available but located in the wrong spot (Basinger 2006). Some causes resulting in data inaccuracy have been identified, including data not updated. If the data are not updated on time, inaccurate status of the storage is produced. Data inaccuracy has negative effects in making decision on inventory. If the items are put in the wrong location, extra labor is expended in correcting the mistakes.
Various methods have been put up for optimizing the accuracy of data. The most simplified way is cycle counting (Donath 2002). It builds up a process to measure the data accuracy by human labor. It also requires other processing to be stopped as the inventory must be stable in the process.
Bar code is also used for improving the data accuracy, but it also brings security issues within the supply chain. Some products were stolen from retail stores such as Wal-Mart as thieves printed their bar code by themselves and pasted it over the top of the bar code on the product. This "name their own price" behavior caused retailers and manufacturers in North America more than $25 billion each year (Schuster, Allen & Brock 2007).
ShengZuo November 2009 items (RFID Business Applications 2009). By implementing RFID tags under carts and readers on the entrances and exits, the budget of Air Canada saves millions of dollars each year. Furthermore, RFID implementation has benefits in adding more information and preventing false information being recorded. An RFID-based tracking system, which aims to track tuna fish in Japan, was expected to make fishermen record fish name, weight, fishing boat ID in an RFID and attach it to the tuna fish before freezing (Frozen Tuna Gets RFID 2005).
2.3
RFID Overview
RFID has become a mainstream technology which helps to identify the objects and to speed the work processes in a variety of areas, including retail and logistics (Want 2006). With the use of RFID technology, a retail vendor can provide improved services to customers. For example, RFID technology has benefits in tracking stock efficiently by recording the ID, type, size and color of a product, and some retailers, such as Prada in Europe, have been enhancing the ability to design and stock the latest popular products by monitoring customers' preferences (Koh, Kim & Kim 2006). In addition, RFID started to be implemented in libraries from the late 1990s. It not only detects the books taken out of the libraries without authentication, but also accelerates the querying speed (Boss 2003).
ShengZuo November 2009 both the local regulations and the surrounding materials. The details of these three frequency bands will be discussed in the following section.
2.3.1 RFID Applications
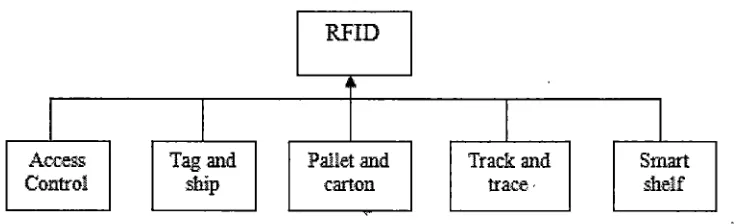
RFID technology has been used in vanous applications. Fundamentally, these applications are classified into five categories, as show in Figure 2.
RFID
j~
I
I
I
I
Access Taga11d Paliet and Track a11d Smart
[image:15.566.92.462.266.378.2]Control ship carton trace, shelf
Figure 2 - Relationships among different types of RFID applications (Glover & Bhatt 2006)
These five categories are introduced as follows:
• Access Control: Access control applications are used to grant access authentication in certain areas. In these applications, RFID tags could be integrated into small objects as the size of credit card or key chain attachments that may give access to enter a building or secure area.
• Tag and Ship: Tag and ship applications are systems that enable users to verify whether the tags work properly when they are attached to items.
• Pallet and Carton Tracking: These applications are the most common forms of RFID that are put on one or more individual items on a shipping unit.
• Track and Trace: These applications are used to track animals or pets. Recently, these applications have been widely used to track products in pharmaceuticals, which has critical effects in dealing with public health problems.
ShengZuo November 2009 system using this application can find all expired products by identifying the expiration date (Glover & Bhatt 2006).
This research aims to solve the problem with the use of pallet and carton tracking applications. It has a long list of usage areas which include but are not limited to supply chain and item-level tagging of goods. Assume that each item on a pallet is tagged and the pallet has been moved from the vendor's warehouse to the manufacturer's warehouse, the information tracking every item being shipped can be provided by RFID tags (Thornton et al. 2006). However, because there is no labor component during the transporting process from one company to another, the reader in the manufacturer's warehouse must be compatible with the tags used by the vendor to ensure the system work well.
At item-level tagging, each carton is attached with one tag which identifies the carton. When the cartons pass in front of the reader, the reader reads the information stored in the tags and sends it to the middleware to identify the cartons. In passive RFID, power for a tag attached to a carton is supplied by a reader. When signals are transmitted from a tag to a reader, the content of the carton affects the signals. For example, if a carton contains high water content products, signal strength becomes weak, which may cause low read rate, and failure to detect some tags. On the other hand, if a carton is empty, the signal pass through the carton without interference, which can cause much higher read rate and more detected tags. Therefore, by observing the difference in signals between empty cartons and full cartons, whether or not some products on the pallet are missing can be detected. Item-level tagging will be explored in detail in the following section.
2.3.2 RFID Architecture
Sheng Zuo
November 2009
An RFID system consists of three components: tags, readers, and middleware (Garfinkel
& Rosenberg 2005). Tags and readers are the most talked-about devices. Fundamentally,
tags are small devices attached to the item which needs to be tracked or identified, and a
reader is the device that can detect the tags and retrieve the information stored in the tags.
After querying a tag and obtaining its information, the reader transports the information
to another system. Middleware is the software which connects the RFID hardware to that
existing in the organization. It provides communication between a reader and applications
(Glover & Bhatt 2006). These three components and how they work together are
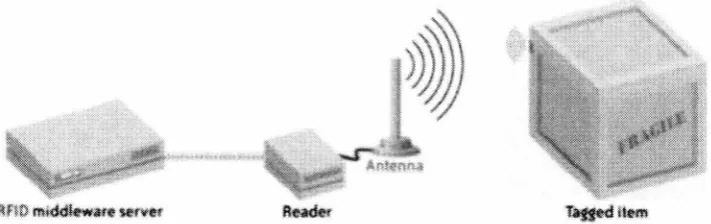
[image:17.566.97.453.353.465.2]introduced as follows. Figure 3 shows the three components in a typical RFID system.
Figure 3 - An RFID system at item level tagging (Glover & Bhatt 2006)
• Tags
RFID tags, also called transponders or labels, are radio device combinations of
transmitters and receivers which receive the radio signal of special frequency and send a
reply automatically (Thornton et al. 2006). Each RFID tag consists of an antenna and a
chip which includes a radio receiver, modulator and a power system as well as memory
(Garfinkel & Rosenberg 2005). Based on the different sources of powering, tags can be
divided into two categories: passive tags and active tags (Weinstein 2005).
Passive tags are smaller and cheaper than active tags because they have no integrated
batteries (Want 2006). It is very easy to affix them into books and small products
ShengZuo November 2009 process of obtaining power source is completed through the electromagnetic property Near Field which provides energy to tags for transmitting signals (Thornton et al. 2006). However, the name 'Near Filed' implies that tags must be located close to a reader for powering. The advantage of passive tags is that they can be used for many years, while an active tag life is limited by the battery life (Garfinkel & Rosenberg 2005).
In contrast, active tags have their own power source, either from the integrated battery or from a connected power supply. Because they do not need to rely on the energy from 'Near Field', their use is not restricted by distance. Therefore, they can receive energy and send signals over long distance and with high reliability. The read range of active tags can reach as much as 50 feet or more in some situations (Shepard 2005). For example, a 915MHZ UHF tag can be read from more than 100 feet away. In addition, because there is no need of a continuous radio signal to power the tags, their performance can be very stable. One of their drawbacks of is that the battery limits the lifetime in practical use. Other disadvantages include that active tags are always large, and the prices are expensive, which restrict their usage in the real world (Juels 2006).
Moreover, there exist semi-passive tags between the active and passive tags (Garfinkel & Rosenberg 2005). Semi-passive tags have batteries as the power supply for the memory, and rely on the reader to power other components so as to send and receive signals. However, the name "Near Field" implies that the tags must be located close to the reader for powering. In other words, this kind of tags has the reliability of active tags and the transmission range of passive tags.
• Line-of-sight is not necessary; • A larger read range;
ShengZuo November 2009
• Simultaneously communication is enabled, thus the RFID reader can detect all the packages on the pallet as it is moved into the warehouse;
• More information, such as position and time, can be stored in a tag throughout the transport process in the supply chain (Gao et al. 2004).
• Readers
In passive RFID system, an RFID reader provides tags with radio energy and receives responses from tags. A tag gains radio energy when it enters the read range of the reader, and sends back a message which contains the serial number and other information on the tag. In some specific RFID systems, the reader can send the radio frequency signal which includes instructions to manipulate tags (Garfinkel & Rosenberg 2005). In these cases, the reader can read or write a tag's memory, or even secure them with a password. On the other hand, in active RFID, tags gain energy from integrated batteries or a connected power supply. They do not need a reader to provide energy to them.
There are various sizes ofRFID readers. According to Garfinkel & Rosenberg (2005), the largest reader includes a desktop computer with a special card and some antennas. This kind of reader is typically part of a network and can send the data it reads from tags to other computers in the network. The smallest reader is the size of a postage stamp and is mainly used in cell phones.
RFIDReader
(~-">
" v
I
AntennaRFIDTag
I
ControllerI
Network InterfaceI
I
...~.
I
,_,,,
" ""
ShengZuo November 2009
[image:20.567.83.465.102.249.2]RFID Middleware
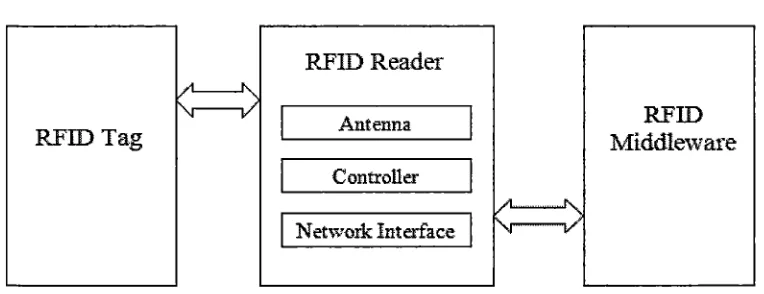
Figure 4 - Physical components of an RFID reader (Glover & Bhatt 2006)
Antennas, which are used to transmit and receive signals, are simple in concept. The number of antennas controlled by a reader varies on different readers. In some cases, one or two antennas are integrated inside a reader; in other cases, a reader can remotely control many antennas.
Controller refers to the device which controls the reader. The controller has three functionalities: controlling tag protocols on the reader side, scheduling time to send information to the network and configuring reader protocols.
Network Interface is the platform which provides the communication between the reader and the network. Moreover, readers communicate with other devices through a variety of interfaces. Historically, most RFID readers had serial interfaces using RS 232 or RS 422 (point to point, twisted pair) or RS 485 (addressable, twisted pair). Recently, more and more readers have start supporting Ethernet and Bluetooth (Glover & Bhatt 2006).
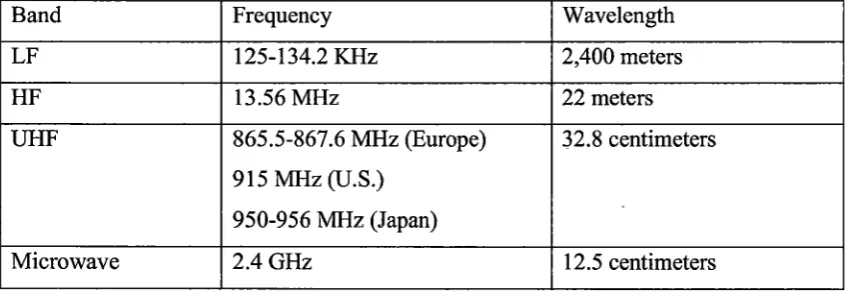
Sheng Zuo November 2009 microwave frequency band at 2.4 GHz. As radio energy is transmitted in waves, it has not only a frequency but also a wavelength. The wavelength of the radio wave multiplied by its frequency is equal to the speed of light, which is 3*108 meters per second. Table 1
shows the details of the frequency bands.
Band Frequency Wavelength
LF 125-134.2 KHz 2,400 meters
HF 13.56 MHz 22 meters
UHF 865.5-867.6 MHz (Europe) 32.8 centimeters
915 MHz (U.S.) 950-956 MHz (Japan)
[image:21.568.57.483.204.350.2]Microwave 2.4 GHz 12.5 centimeters
Table 1- RFID frequency band categories (Garfinkel &'Rosenberg 2005, p. 21)
Tags at different frequency bands have significant variations of performance when surrounded, by water or metal. Among these four bands, LF RFID systems have the best performance when reading tags attached to high water content or metal products. The read ability of HF in this case is slightly worse than LF but better than UHF. UHF tags have limited ability to read tags on items with a high. water content or a metal product. The UHF frequency band is the one which has spread in logistics area and is the basis for the Electronic Product Code (EPC) tags. Microwave RFID systems have the highest price, and their use is limited by their possessing the weakest ability to penetrate water or metal products (Understanding RFID and Associated Applications 2004).
• Middleware
rnt1trpri"' IMX/SNM p
mana~~nl ,...
(01\Sole
, _ _ _ _ .. !MS
Cliellt
'*
'
I
Clienl
Cliellt
SOAP
.NET
U6
AppficaUon·
!cvelev~ril
~er11k'e
1111~ace
Oevk:e
driven
Sheng Zuo November 2009
I
t
I
t
I
[image:22.569.98.434.94.461.2]I
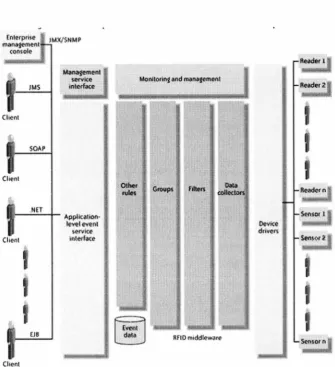
Figure 5 - Conceptual architecture for an RFID middleware product (Thornton et al. 2006)
Middleware acquires raw data from one or multiple sources in the physical world. In the next step, the data are transformed and filtered for the applications. As shown in Figure 5,
the RFID middleware has many functions to manipulate data, such as monitoring and
managing capability, data collection and filtering, and interfaces which provide services
using multiple standards.
The raw data from the reader cannot be used directly by the applications. Before an application can use RFTD data, it needs to be filtered by the middleware. 'Filtered' means
that not all tags are needed by the applications, so some of them are discarded (Cheong &
Kim 2005). The filtering aims to remove duplications and false readings from RFTD
ShengZuo November 2009 Liu 2006). Due to the imperfect read rate of RFID, three kinds of undesired data are filtered by middleware:
• False negative readings: The tags are in the read range but not recognized by the reader. This can occur for two reasons: One is tag collisions that occur when tags are read simultaneously and the RF signals interfere with each other. This causes information to be destroyed. The second _reason is that the signal from a tag is stopped by metal, absorbed by water or affected by other mediums.
• False positive readings: Unexpected signals are detected by the reader, which produces additional information. This is also known as noise, and can be caused by extra tags in the read range.
• Duplicate readings: Three reasons for duplicate reading have been identified: first, multiple tags within the read range are read more than once; second, multiple readers cover a common area, so tags in the overlapped spaces are detected by multiple readers; third, multiple tags, which are attached to the same items in order to reach a high quality read accuracy, produce duplicate readings (Bai, Wang & Liu 2006).
This filtering process provides precise data to be further interpreted in the applications. It makes the data valuable to the enterprise applications (Cheong & Kim 2005). However, the filter hides the evidence to detect a hollow pallet and the data it removes is essential in solving this problem. For example, since water absorbs the RF signals, the tag read rate of a pallet filled with bottled water should be low. If the read rate is found to be higher than usual, it suggests that there may be a hollow inside the pallet. Therefore, the method in this research is operating at the reader level, before the raw data is filtered by the middleware.
2.3.3 Advantages of RFID
ShengZuo November 2009 the limitation of "Line of Sight'', which means the object needs to face exactly the correct direction in front of a scanner, and anything located between the scanner and the code causes failed reads. ID card, such as credit card, needs to be swiped in the card reader in a particular direction. Biometrics, such as fingerprint recognition and facial scan, have more onerous limitations in alignment. Compared with traditional automatic identification technologies, RFID technology provides effective performance from a distance and has no further requirements in terms of the item alignment. The benefits of RFID have been summarized as following:
• No alignment requirements. "Line of Sight" is not necessary. Items do not need to be placed facing the scanner. Thus no labor assistance is needed in that process. • High speed in acquiring information. The tags attached on multiple items can be
read simultaneously.
• Variety of tag forms. The size of tags varies from as large as a box to as small as a grain of rice, which enables the technology to be used in a wide range of environments.
• Item-level tracking. Tag has large memory which allows for long identification codes and hence a large number of items.
• More information is supported. Compared with bar codes, more types of information beyond ID, such as manufacturer, product type and environmental factors, can be stored on the tags.
• Rewriteable: Certain types of tags can be written more than once. It has advantages when reusable containers are involved. However, when tracking and identifying items in retail area, this type of tags causes potential security issues, so write-once tags are still needed (Glover & Bhatt 2006).
ShengZuo November 2009 hollow pallet. At the same time, there are limitations on the technology, and these limitations will need to be investigated if hollow pallets are to be identified using RFID systems.
2.4
Factors limiting RFID to solve the hollow pallet problem
RFID has many advantages compared with other identification techniques because it does not need the line-of-sight scan and can detect multiple tags simultaneously. However, RFID technology is not a mature technology al)d some issues have not been addressed. This section introduces the causes of failed tag reads and the factors that affect tag read rate.
2.4.1 Causes of failed tag read
In a multi-tag configuration, the problem of false negative reads occurs .False negative reads refers to the phenomenon that an existing tag is not detected by a reader. This problem can be due to multiple causes, including tag collision on the air interface, tag detuning and tag misalignment.
• Collision on the air interface
A passive RFID system is mainly used to identify the items which are expected to be detected by the reader simultaneously. A problem is caused by collisions in identifying multiple tags when they are presented in the read range of the reader. If tags transmit their signals in the same time slot, the reader cannot separate the information of one tag from that of another. Thus, the information sent by multiple tags is destroyed. This often happens in laundry services and warehouses (Vogt 2002).
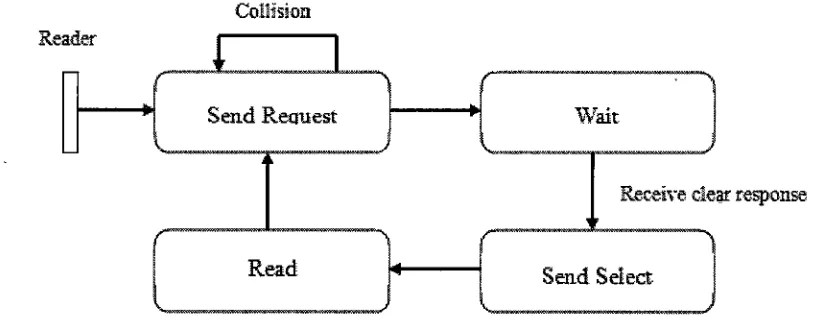
ShengZuo November 2009 disabled to resend and other tags will be activated to send their message by repeating this process. The other method is to give each tag a stochastic time slot. Since the communication is based on the shared medium, it is usual to assign each tag a different time slot based upon an Aloha-like protocol (Slotted Aloha). Only one tag can send the information to the reader in a specific time slot. Traditionally, three commands are used to control tag read by Slotted Aloha: REQUEST, SELECT, and READ. When REQUEST command is sent by a tag, the protocol provides the tag with one specific slot. This slot is randomly selected and a tag has to wait for this until it can send a response to the reader. After that, the tag broadcasts its ID. In a particular time slot, the reader sends SELECT command containing the correct tag ID. Only the tag with the correct ID is allowed to send its response. Then the reader issues the READ command to obtain the information from that tag. After the conversation is completed, the read sends another REQUEST command and repeats the previous steps to obtain the information of each tag (Glover & Bhatt 2006). Figure 6 shows the state transition from the reader side.
ColHsion
Re ader
l
I
-.
Send Reouest ~ \Vait
-
.
~
•
Receive de arresponse
•
[image:26.568.61.470.411.576.2]Read . Send Select
Figure 6-Slotted Aloha protocol (Glover & Bhatt 2006)
ShengZuo November 2009 ignored, whereas other tags answering "I" will be asked a question about the next bit. Repeating this step forms a binary tree. The deeper the tree becomes, the fewer tags send the responses. This step keeps repeating until only one tag is left. This protocol is more complex than Slotted Aloha, but in most cases, it does not need to read the entire ills of all tags, which means it is more efficient (Glover & Bhatt 2006).
• Tag detuning
Tag detuning refers to the fact that the tag read rate can be easily affected by detuning effects. In inductively couple RFID systems, a tag microchip is powered by the induced voltage in the antenna coil of the tag. A parallel resonance circuit is created by adding a capacitor in parallel to the antenna coil. The resonance frequency is adjusted to the frequency of the RFID system. Therefore, at resonance, tag read range is enlarged as the induced voltage increases (Floerkemeier & Lampe 2004).
ltl
f
CD 10 ~---0 E ~ 8 +---.=1=---=::l:=---t
Sheng Zuo November 2009
~
i
6 ~D-16-T-im_e_s_lo-ts-~ m_e_s_lo-ts-~ 4 D 32 Time slots
CD
·-g>
c
2 ._ CD~ ~ 0 -+-..._...___._ _ _.__._--L _ _L...&...L-'-L...,--L~L--'---'---'----'--l <
a. I/)
ro -o <I> L.
.c ro
<I> (.)
c ...
0 0
I/) -0 -0
<U ...
<I> <U
... (.)
a._ CJ) ~
0
-0
<I> (/)
~ -0 0 ...
<U <U
[image:28.582.62.481.83.282.2]- 0 CJ) c 0 :;::; .Q -0 <I> ... Cl.
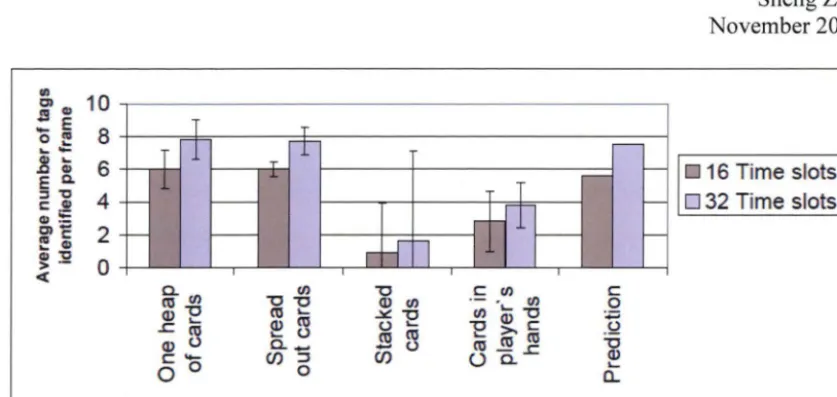
Figure 7 -Average number of tags identified per frame (Floerkemeier & Lampe 2004)
• Tag misalignment
The misalignment of the tags is an important factor which causes failed reads. In the
magnetic field of the reader, tags receive the maximum power supply when the plane of
the tag coil is vertical to the field lines. If the tag is rotated, the received energy becomes
weak (Floerkemeier & Lampe 2004).
In summary, tag collision, detuning and misalignment are causes which lead to failed
reads. Tag collision is the most important problem. The collision avoidance algorithms
have been used to effectively address this problem. For EPC Class 1 UHF tags, Adaptive
Binary Tree is used to solve collision problems. Tag detuning and misalignment also
need to be noticed as they produce low read rate by changing the read range and
weakening supplied energy to tags. Besides these causes, tag read rate is affected by
multiple factors. These factors will be introduced in the next section.
2.4.2 Factors affecting tag read rate
Tag read rate is influenced by many factors. Tag position and the content of a carton were
considered to be two of the most important factors (Jo, Lim & Zimmers 2007). Some factors can be controlled by setting values on a reader. Some other factors, such as the
radio signals transmitted by mobile phones and mediums interfering with signals of tags,
Sheng Zuo November 2009 experiment environment. A Faraday cage has a radio shield to prevent external factors from interfering with the tags and the reader inside it. Thus, the factors can be controlled. The influences of other factors are excluded and the effect of individual factors inside the Faraday cage can be evaluated. Faraday cages will be introduced in the next section.
The following factors will be evaluated in the expe~iment:
• Tag position: This :refers to the location and orientation of a tag on an item. The tag can be put either in a horizontal orientation or in a vertical orientation. In previous research done by Singh et al. (2007), RF performances based on three different products were tested to find the optimal tag position: bottled water, paper towels and carbonated beverages. For the case of bottled water or paper towels, in order to achieve an accurate read rate, the most appropriate tag position was on the front of the package in a vertical orientation. and for carbonated beverages, the best location was on the front of the package in a horizontal orientation (Singh, J et !il. 2007).
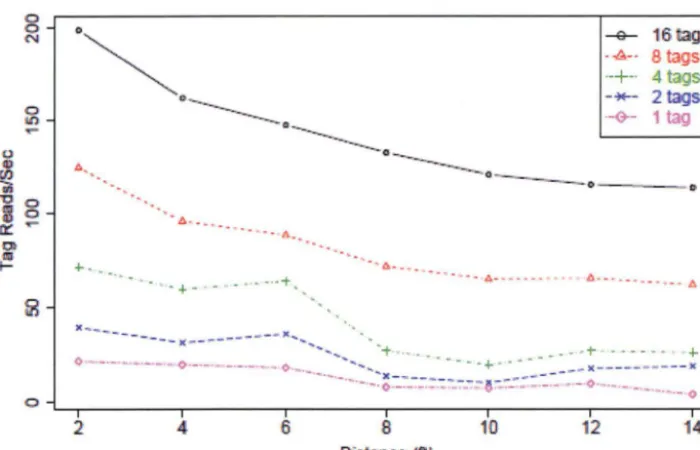
• Content of cartons: when identifying and tracking tags in transporting pallets, RF signals are affected by the contents of the cartons on the pallet. Especially, low read rate is produced when a carton has a high water content product, such as fruit or fish, because water absorbs RF signals (Myerson 2007, p. 42).
O•
co
-0
·
~.
Sheng Zuo November 2009
---
0---
0
---G- 116tigs
·-A-· 8 tags
·-+-· 4 tags
-*"- 2 tags ·--0-- 1 tag
+. -...
--+ - - -.. ···+ •.
I I I
2 4 6
...
a---~
-
o
-
-
-
-
o
····o. ....
-... 4-- - •• - •
6--· . -- --• ·-. "'
I I I I
8 10 12 14
[image:30.582.86.436.114.339.2]o·s1a11ce ( )
Figure 8-Tag read rate when distance increases (Buettner & Wetherall 2008)
• Acquire Mode: It refers to protocols under which the reader reads the responses
from the tags. For the Alien Reader, which will be used in this research, there are
two alternative acquire modes: global scroll and inventory. The reader searches
for information from the nearest tags quickly when the acquire mode is set to
global scroll, while it looks for all tags within the reader's read range when the
mode is set to inventory (D'Mello et al. 2007). Fundamentally, the difference
between these two modes is that inventory mode enables collision avoidance
while global scroll mode does not.
• Attenuation: With Radio Frequency, attenuation refers to the amplitude reduction
of an RF signal. It occurs if the signal is absorbed or dispersed when traveling
from the sender to the receiver (Sanghera et al. 2007, p. 44). The value of
attenuation is the reduction in the reader's transmitting power. Attenuation is the
basic factor in evaluating read performance when water is the content of the
cartons (Ramakrishnan & Deavours 2006). The reason is that water is remarkably
good at absorbing RF radiation, so the tag read rate can be influenced
ShengZuo November 2009 • Persist time: Persist time determines the amount of time a tag stays in reader's memory after it is detected by the reader (Reader Interface Guide All Fixed Readers 2008). If persist time is set to a low value, for example, the default value which is "1 ",the reader memory contains only a small amount of tags information from those which were read a short time ago. When the value is set to "O", the information of detected tags will not be stored in the readers' memory at all.
In summary, tag position and content of carton were considered to be significantly important in previous research. They affect RF signal strength and influence tag read rate. Factors, such as acquire mode, attenuation and persist time, have effects in determining and recording tag read rate. These factors are worthwhile to be evaluated in the experiment of this research. When a carton contains high water content products, any RF signal passing through it, is absorbed by the water and the signal becomes weak. This has negative effects in detecting all the tags on a pallet. However, it can be used to detect whether or not some cartons on a pallet are empty, because the interference will be reduced if some high water content products are missing. The next section will introduce other factors which limit tag read rate.
2.4.3 Other factors
ShengZuo November 2009 reader was found to decrease significantly when the reader was placed on a metal frame table (Floerkemeier & Lampe 2004).
Errors in manufacturing and usage cause failure in detecting tags as well. According to Elisabeth (2006), a number of tags have been damaged during usage. Reader malfunction is also a factor which causes the read failure. As it is difficult to predict and avoid the malfunction, an alternative reading method is important if an accident occurs. Furthermore, other electronic devices may interfere with the read procedure. A survey based on a hospital in Taiwan presented that equipment which also uses radio frequency caused tag read failure (Wang et al. 2006). Radio waves may also be influenced by the layout and materials of the building. Finally, besides the technique issues, some users resist implementation of the RFID technology and giving training to them is important when an RFID system will be implemented in a company or institution.
In summary, tag read rate faces potential challenges from various causes and factors. The main causes include collision, tag alignment and the content of the carton. Attenuation, distance, acquire mode and product content are factors which need to be identified in implementation of RFID. A high water content product causes significant low read rate, as water absorbs RF signals. Furthermore, other factors such as surrounding media also need to be considered. Since there are many factors interfering with the read rate, it is essential to control these factors in order to evaluate the effect of each individual factor. The next section will discuss Faraday cages, which will be used to control some of the environmental factors in this research.
2.5
Faraday Cages
ShengZuo November 2009 interfered with by external noise. In one report, a thin layer of metal within paper was used to make a Faraday cage (Xiao & Pan 2007, p. 158). In the real world, Faraday cages have been embedded in items which need to be tracked or identified with the use ofRFID. For example, a Faraday cage works perfectly when it is used in a wallet in which multiple tags in credit cards and other identification need to be protected. However, location is a limitation for Faraday cages. They do not work well when a tag in integrated in a watch, or somewhere a faraday cage is hard to construct.
RFIDReader
Faraday Cage
,~www-ww~~---*•WW$WW*WWW-••---~
, '
l '
pi---.; [
RFID TagJi
'
'
' , [image:33.568.104.456.279.358.2]~~#www-ww-~WW-*•W-•••-~w•-••--•w~
Figure 9 - RF signals are blocked by a Faraday cage (Xiao & Pan 2007)
In a laboratory environment, aluminum foil is an effective material for stopping signals. Hashemi (2009) did a test with the help of a Faraday cage which was made of cardboard boxes covered with aluminum foil. The RF signal was sent by an oscillator outside the cage and received by an RF spectrometer inside it. When the distance between sender (the oscillator) and receiver (the spectrometer) was 5 meters, the foil box gave 28 dB attenuation, which meant that aluminum foil significantly reduced the RF signal in this case. In this research, layers of aluminum foil will be used as the material to build up a Faraday cage.
Sheng Zuo November 2009 individual item, case or the pallet. The next section will discuss the pallet configuration and item level tagging.
2.6
Pallet Configuration and Item Level
2.6.1 RFID Tagging levels on a pallet
[image:34.567.164.382.493.671.2]RFID tagging occurs at three levels: pallet level, case level and item level, as shown in
Figure 10. Pallet-level tagging is wildly used in the supply chain. In pallet-level tagging,
a tag which contains purchase order information is affixed to a pallet before it is shipped. When the pallet arrives at the shipment destination, information stored in the tag can be read (Jung, Chen & Jeong 2007, pp. 31-32). This helps to make the supply chain become more productive and brings clear economic profits (Vickery 2006, p. 249). In case-level tagging, tags are attached to cases. Compared with pallet-level tagging, case-level tagging achieves more detail tracking, including clearer inventory visibility. In addition, it can count cases automatically so as to save labor cost (Jung, Chen & Jeong 2007, pp. 31-32). Finally, level tagging has been used to track retail goods (Vickery 2006). In item-level tagging, tags are affixed to either the product box or the item itself. This tagging level achieves the highest visibility (Jung, Chen & Jeong 2007, pp. 31-32).
Cas7 RFIO Ta"
' I ,
J I ,fo===~==sf6,~===:ffl'
I
t~---lf'::---f<f::---f
I
''-..l"!'"'"'--off<-0'!""'""-'""""""'""""--<F
ShengZuo November 2009 Item-level tagging is expected to produce potential profit for the retailer (Gaukler, Seifert & Hausman 2007). It has been widely used and more companies are planning to use it. This research focuses on item-level tagging. However, although item-level tagging has been used identify items, it has not been considered to identify the contents of the items on a pallet. There are some problems influencing tag read rate at item level, as mentioned in previous sections. When tags are placed on the item level, in this case on the cartons, the problems affecting tag read rate are exacerbated. It is therefore important to solve these limitations at the item level in order for organizations to introduce RFID into their applications. The following part introduces the examples of item-level tagging used in the real world.
2.6.2 Item-level Tagging in the Real World
Item-level tagging has been widely spread in the logistic and retail area. Most companies use UHF passive tags to track the items, because of their low cost and small size. EPC Global tested different frequency bands in seven item-level tagging scenarios and tried to find which frequency band is appropriate for tagging items. Based on this test, they found that ifthe read time is too short, the antenna cannot obtain enough energy from the reader and if tags are allocated too close together, potential issues may arise. Furthermore, they found that no one frequency can work in all situations (O'Connor 2006).
Dillard's Gear tried passive UHF Generation 2 EPC (EPC Gen2) tags on 50 items in August 2008, to compare the performance of RFID and traditional bar-code technology. It was proved that RFID could help the company to save cost by decreasing shrinkage, reducing labor, and improving sales (O'Connor 2007a).
ShengZuo November 2009 purchased so as to determine how many tagged items were lost. According to the test, the accuracy reached 98.4% (O'Connor 2007b ).
Furthermore, An RFID-based system has been developed by Global Technology Resources (GTR), to track food, such as fish and vegetables. GTR also considered developing the RFID readers and tags to facilitate this system. According to GTS, this RFID-based system was expected to track and identify the food by real time monitoring during transporting processes. If some products are found to be tainted in the supply chain, information on both the origin and the destination will be retrieved automatically, in order to identify these products (Collins 2003)
Overall, the ability of an approach to detect hollow pallets will need to consider the tradeoffs between usability and technical limitations of RFID. If hollow pallets are to be detected, it will be important to know how these factors will limit its feasibility in the real world. The following section will discuss previous research exploring the influence of factors on tag read rate.
2. 7
Previous Work
Sheng Zuo November 2009
Furthermore, another experiment was done for observing the readability based on
different carton content. These items include paper product, powder, liquid and metal.
Twenty seven items were put on the pallet in three columns with nine in each column,
and all the tags were attached on the exposed sides, as shown in Figure 11. The pallet
was moving on a conveyor belt in front of the reader at two speed rates, 0.625 mph and 5
mph(Singh, SP et al. 2008).
[image:37.582.123.415.228.424.2]READER ANTENNA.
Figure 11 - Tags and reader orientation (Singh, SP et al. 2008)
The conclusions of this experiment are drawn based on the results as follows:
• Product content is most important factor. When the results were analysed, paper
product was found to contribute the best read rate, especially as it was almost
100% under the moving speed of 0.625 mph. The cases with liquid product, and
powdered product in aluminium foil wrapped cartons had low read rates.
• Distance between the tags and the reader has influence on the readability. The
tags which were close to the reader or placed at the same height as the reader were
detected better.
• High speed produces weak readability. In the case of paper, the read rate reached
100% at 0.635 mph but only 20% at 5 mph.
This detecting system does not handle the situation in which the cartons contain more
ShengZuo November 2009 Furthermore, some important results of detecting the tag read rate based on fresh fruits were published by McCartney (2005) and Singh et al. (2008):
• Metal has a critical effect on read rate.
• Products with high percentages of water have low read rates.
• Speed of transporting during detecting processes has a critical effect.
Some additional factors which were considered to affect the final read rate were identified (McCartney 2005). Especially, external electrom~gnetic fields and the orientation of tags influence the read rate. The former usually occurs because of signals that are transmitted by electronic devices such as mobile phones, and the latter indicates that the tags have better readability when put close to the reader or face outward.
In summary, prev10us research identified the factors which have influence on the readability. These factors, such as pallet moving speed, tag position, material of the carton content and distance between tags and readers, play critical roles in the final results. Therefore, it is important to use a Faraday cage to prevent external interference and deal with the other factors in order to get a reliable read rate in the experiment.
2.8
Summary
Hollow pallets are a problem of transport in the warehouse. Many companies have implemented RFID system to identify items. It can help to speed inventory process, decrease item shrinkage and save cost. An RFID system consists of three components which are tags, readers and middleware. However, RFID is imperfect as it cannot reach
100% read rate.
3.
Methodology
3.1
Introduction
ShengZuo November 2009
The aim of this research is to determine whether there is a hollow pallet by using Radio Frequency Identification (RFID). Before determining a method with which to prove the hypothesis above, the requirements should be specified clearly. The experiment consisted of three phases. Each phase tested different factors in order to find the unimportant factors which were not tested in the next phases, and the optimal values for the important factors. In testing individual factors, only the factor which was evaluated varied while the values of other factors were kept constant. This helped to observe the influence of each individual factor on the final results in the testing period. Otherwise, it would be difficult to tell whether increasing one factor's value made the read rate better or not, as other factors might influence the results. In this chapter, the first section will introduce the experiment environment including hardware and software. Following that, the proposed evaluation factors in each phase of the experiments will be discussed. Finally, the methods used to ensure the validity of the experiment results will be described.
3.2
Environment and System Architecture
The equipment in the experiment was provided by the School of Computing in the University of Tasmania. It included of bottles attached with tags (a pallet), a reader and a PC. Fundamentally, there were four processes in each replication of the experiment. The PC was a terminal controller which set the values of factors and sent the commands to the reader. According to the transmitted values, the reader sent signals to the tags on the pallet and received the response information from the tags. Following that, the application on the PC retrieved the data from the reader and saved them into logs. Finally, values of factors were altered on the computer and the next replication could start.
3.2.1 Experiment Environment
ShengZuo November 2009 container which is usually made of metal mesh or foil. Because RF signals cannot pass through the Faraday cage, the signals transmitted between the reader and the tags inside are isolated (Juels, Rivest & Szydlo 2003). Therefore, the results retrieved by the PC were not interfered with by external radio devices, such as laptops, mobile phones and other tags. The Faraday cage in this research was made of three layers of foil, which was proved to provide an effective radio shield in the preparation of the experiment. Before each test, only the reader will be placed in the faraday cage so as to test whether there are extra tags in the experiment environment. If no tag is detected, it indicates that the space is clean, and the following tests can be started. The following subsections will introduce the facilities used in the laboratory environment.
3.2.1.lRFID Reader
An Alien 9650 Gen2 RFID reader with integrated Antenna (ALR- 9650), which is the product of Alien Technology Corporation, was used for this research. The ALR-9650 supports EPC Gen2 RFID tags and can be connected to a computer using RS-232 or LAN TCP/IP interconnection. In addition, it provides an extra antenna port to support 2-antena applications. Java libraries are provided as well, in order to control the reader by customized development (Product Overview 2007).
3.2.1.2 RFID Tags
The 32 tags used in this research were ALN-9640 Squiggle. They were UHF, passive and EPC global Class 1 Gen 2 tags, with a 512-bit memory.
Sheng Zuo November 2009
the percentage varied in different seasons. For example, it reduced to 77.6% in late
September and increased to 80.7% in early April. Based on this result, bottled water was
[image:42.568.124.404.183.299.2]used in this experiment instead of real fish.
Figure 12 - A bottle attached with a tag used in the experiment
3.2.1.3 RFID Applications
Alien provides packages so users are enabled to set up a reader's parameter values. In this
research, the application project developed with the packages was already written by
Mirowski (Advisor of this thesis) and this was used. The project was run on Eclipse 3.4.
It had the following main functionalities:
• Setting up or changing the values of the parameters, such as protocol type,
attenuation and persist time, on the reader;
• Printing out the result of each individual replication and the average value of the
replications;
• Saving the results, both individual and average values, into the log folder.
3.2.2 Experiment Structure
The overall experiment system is a local network which consists of three components: a
PC, a reader and tags attached to the pallet. The reader and the pallet with tags were
placed inside the Faraday Cage that was made of foil so as to avoid external interference.
ShengZuo November 2009
• Preparation: The reader was fixed in the Faraday Cage. The pallet was configured and also put into the Faraday Cage. The values of parameters were set up via PC.
• Obtaining data: When the project started on Eclipse, the reader sent the signal according to the parameter values to the tags. Tags sent back data including their IDs to the reader. Then the reader transferred the received data to PC;
• Recording: Programs on PC collected the data of each replication from the reader and calculated the results, such as the number of cycles, the number of unique tags and the number of all detected tags based on the information of each tag. The programs also averaged the values and saved all the records into a log folder.
It is necessary to ensure that there are no extra tags detected during the preparation step. In other words, the system should be kept in a "clean" environment. Further data analysis was undertaken in Microsoft Excel and diagrams were drawn to observe the results.
3.3
Experiment Methods
There are multiple factors influencing the results in the experiment. These factors exist in both internal environments, such as parameters of RFID reader, and external environments, such as other electronic devices. Since the Faraday cage has the ability to isolate the experiment from the interference of other external factors, only internal factors were considered. This section introduces the test methods in this experiment.
3.3.1 Three Phases
ShengZuo November 2009 values in the following phases. In addition, some factors were found unimportant in solving this problem, so they were not tested in the following phases.
The factors which were tested in each phase are introduced as following:
Phase One: The distance between the reader and tags on the pallet, acquire mode and
content of cartons were tested in this phase. Testing the content of cartons in this phase helps preliminary determination of whether this system can tell the difference between an empty pallet and a full pallet.
In this phase, the testing was undertaken by the following method:
1. Structure of the pallet: The pallet consisted of 30 boxes facing 1 reader. One tag was attached to each box. The structure of the pallet was 5 boxes per column by 6 columns. All the tags were horizontal and facing toward the reader. The size of the pallet was 40.6cm*15.2cm*13.2cm. The size of each box is 6.5cm*15.2cm*2.7cm.
2. Distance between the RFID reader and the pallet was progressively changed from 50 cm to 200 cm using 25 cm intervals.
3. Acquire mode, attenuation and run length: Both global scroll and inventory were tested. The RF attenuation was equal to 0 dB and the run time was 30 seconds.
4. Empty, full and hollow pallets were tested. In the hollow pallet, two pen boxes were empty, and the full boxes were filled with 12 plastic pens.
5. Each test was replicated five times and the value was averaged.
6. These data were input into Microsoft Excel and a diagram was generated in it so as to determine if the hollow pallet could be detected.
Sheng Zuo November 2009 determining the potential percentage of tags that can be detected. By keeping the distance from the reader constant, tag readability can be set at an optimal value and hence the influence of distance as a variable factor removed. Therefore, the question was to find a proper distance to optimize tag readability.
Changing the value of distance was equivalent to changing the attenuation (Ramakrishnan & Deavours 2006). An experiment, done by Ramakrishnan & beavours (2006), evaluated the influence of distance in detecting UHF tags, by measuring the response rate, which refers to the number of successful reads in each attempt. As shown
in Figure 13, the response rate reaches almost 100 % when the distance varies between 2.9 feet and 11.7 feet. This region is called 'strong-in-field', but it decreases dramatically when the distance increases and no tag can be detected when the distance is between 18.5 feet and 29.3 feet. The X-axis in the figure shows the attenuations value which are equivalent' to the effect of the distance values at the top of this figure. In the laboratory environment of this research, the distance between the reader and the pallet was set to 20 cm, which, as shown in the Results chapter, can guarantee a reliable tag response rate (Section 6.1 ).
Distance (ftJ
2.9 3.7 4.6 5.9 7.4 9.3 1'1.7 '14-7 18.5 23.3 29.3 100 .,. ,,.... , -. - __ .,,,. ,,.., .... "-.... ~---·--·-
---'
Strong in Field '-\,'\
90 w~.,
80
70
$:l
t1 GO '
<I) 1
~ 50 \
8. \<
'1 ~ 40
Weak 1nl
30 Field i
20
\"l
10 \• I Out of
' Field
0
0 2 4 6 8 10 12 14 16 18 20
[image:45.569.141.401.467.676.2]Attenualion (dB)
ShengZuo November 2009 Acquire Mode, which controls whether collision avoidance is enabled, determines the protocol within which the reader reads the signals from the tags. In Phase One, when acquire mode was set to global scroll, which disabled collision avoidance algorithms, the numbers of detected tags in the different pallet situation (empty, full and partially full) were almost the same. Whereas, then acquire mode was set to inventory, which enabled collision avoidance algorithms, there were significant difference in the empty pallet situation and the full pallet situation. This result indicated that global scroll protocol was unimportant in influencing the results, whereas inventory protocol produced significant difference. Therefore, acquire mode was set to inventory in the following phases.
The contents of the cartons in Phase One were plastic pens. Three situations, such as empty pen boxes, full pen boxes, and partially full boxes (1 box was empty), were tested to find whether there was significant difference to detect the hollow pallet problem.
Phase Two: This was a formal experiment to determine whether the hollow pallet could be detected with the use of bottled water. Tests in Phase Two were based on different factors such as attenuation and persist time, because the factors tested in Phase One were set to constant values. From the experience of Phase One, the results of Phase Two were expected to be clarified in a graph. In the graph, three lines, which represent the full pallet, empty pallet and hollow pallet, were expected to be clearly distinguishable, and the line representing hollow pallet was expected to be located between the other two lines. If this assumption was finally proved to be correct, then the hollow pallet could be detected in this system.
In this phase, the testing was undertaken using the following method:
1. Structure of the pallet: Bottled water was used as the content on a pallet. The number of bottles was doubled each time, from 1, 2, 4, 8, and 16 to 32.