Class II Methanol Masers and Their
Environment at High Resolution
by
Christopher John Phillips, B.Sc. (Hons.)
Submitted in fulfilment of the requirements for the Degree of
Doctor of Philosophy
!
p~~rC$.
UNIVERSITY OF TASMANIA f1~lt.it i C j
HOBART
Declaration
This thesis contains no material which has been accepted for the award of any other higher degree or graduate diploma in any tertiary institution. To the best of my knowledge and belief, this thesis contains no material previously published or written by another person, except where due reference has been made in the text of the thesis.
~~~
Christop:e£ n Phillips
This thesis may be made available for loan and limited copying in accordance
with the Copyright Act 1968.
Christopher John Phillips
Thesis Summary
Observations of the 6. 7- and 12.2-GHz masing transitions of methanol by Norris et al. (1988; 1993) using the Australia Telescope Compact Array (ATCA) and the Parkes-Tidbinbilla Interferometer (PTI) found that for ten of the seventeen sources imaged the individual maser components had a linear spatial distribution. Many of the linear sources also had a velocity gradient along the source. This is in marked contrast to similar observations of OH and H20 masers. Norris et al. interpreted this to be evidence of an edge-on circumstellar disc surrounding a young massive star.
The evolution of young massive stars is poorly understood, because the stars are surrounded by a cocoon of dust and dense molecular gas. Thus the direct detection of a disc around these stars would be a major step in understanding the dynamics of the formation of massive stars. In this thesis I have taken a sample of methanol sources and observed them using a variety of instruments and techniques to improve our understanding of these interesting objects and find further evidence to investigate the circumstellar disc model of linear methanol maser sources.
The sources imaged by Norris et al. were some of the brightest known methanol masers. In this thesis, I have used the ATCA to imaged a further ten methanol sources which have a more modest flux. All the methanol sources originally ob-served by Norris et al. have been reobserved either in this thesis or by Ellingsen et al. (1996a; 1998). As many of the maser sources have separate sites of emission separated by a few arcseconds to a few arcminutes , there are 45 maser sources which have now been observed at high resolution using the ATCA. Seventeen of these sources have a linear morphology. No difference in the properties of the linear and non-linear sources could be found.
Simultaneous observations of the 8.6 GHz continuum towards the methanol sources have been made for all the sources in the sample. Half of the methanol sources are associated with an ultra-compact Hn (UCHn) region. The sources without UCHn regions may either be pre-main sequence, or are associated with a less massive embedded star.
The Anglo-Australian Telescope has been used to observed the 11.5 µm con-tinuum emission associated with 35 of the maser sources. Nine of the sources were found to have detectable mid-infrared (MIR) emission. No correlation has been found between the the methanol and MIR luminosities. The observations were sensitive enough to detect embedded stars of spectral type B3 and above. That so few sources were found to have a MIR counterpart indicates that there are large variations in the circumstellar environment of the methanol sources.
A VLBI proper motion study at 6.7 and 12.2 GHz of a subsample of eight of
the linear sources has been started using the Australian VLBI network. If the lines do represent edge-on circumstellar discs then it should be possible to detect Keplerian rotation in 3 to 5 years.
The ATCA has been used to search for extragalactic 6.7-GHz methanol "megamasers" towards 87 galaxies selected on their !RAS colours and known OH megamaser galaxies. No methanol emission was found, with a typically detection limit of 15-40 mJy. This is surprising given the close association between Galactic OH and methanol masers.
Acknow ledgrnents
There are many friends and colleagues to whom I am indebted to for their contri-butions to this thesis as well as the help, advice and friendship they have offered over the course of my PhD. I wish to express my sincere gratitude to my two supervisors, Prof. Peter McCulloch and Dr. Ray Norris. Their knowledge and sound understanding of the concepts of radio-astronomy and astrophysics have been invaluable for my own understanding. Ray's constant enthusiasm and advice has helped keep me focused, especially while writing this thesis.
I would also like to thank Dr. John Reynolds, Dr. Neil Killeen and Dr. Jim Caswell for patiently answering my many astronomical and data processing ques-tions. The VLBI presented in Chapter 4 would not have been possible without the assistance of many people. These include Dr. John Reynolds, Dr. Tasso Tzioumis, Dr. Russell Gough, Dr. Edward King, Dr. Jim Lovell, Dr. Simon Ellingsen, Dr. Grant Gussie, Dave Rayner and David Legge. I am sure that there are other people who have also helped, whom I thank. In particular, I owe a lot to John Reynolds for his help scheduling and running the experiments and Dr. Warwick Wilson for his help using the fledgling S2 correlator.
The Mid-infrared observations presented in Chapter 3 were made in collab-oration with Dr. Craig Smith using a camera built by him at ADFA. He very obligingly gave up his time to help us make the observations as well as doing all the data processing.
I would like to thank all the graduate students and staff in the Physics Depart-ment for their friendship and company. I would like to particularly thank Edward King, Jim and Jenny Lovell and Simon Ellingsen for their help and friendship both at work and socially. I have immensely appreciated the suggestions and advice Simon has had to offer which have done much to improve this thesis. Arguing the finer points of spectral-line interferometry with Simon has improved my un-derstanding of this subject a lot, regardless of which one of us was right. Simon, along with Edward and Jim have collectively read drafts of the entire thesis at least twice and have never been rude about my spelling or grammar. Jim and Edward had the added the responsibility of ensuring I arrived at the church on my wedding day, a task they passed with flying colours.
Thank you to my parents who have been generous with their support both emotionally and financially while I have been at university. I am truly grateful for their love and support over this period particularly through some times which we have all found difficult. My father has patiently listened to me while I have tried to explain the many things which I was confused about and had not understood myself. He has also generously proofread the entire thesis.
Lastly I would like to thank my wife, Lisa, for her love and friendship. Her companionship has helped keep me sane and my head above water. She has also made a large sacrifice and suspended a promising career to come to the Netherlands with me, for which I am immensely grateful.
Contents
Thesis Summary
Acknowledgments
1 Introduction
1.1 Ultra-compact Hn regions . . . . . 1.1.1 The bow shock model . . . 1.1.2 The champagne flow model
1.1.3 Photo-evaporated molecular core model . 1.1.4 The circumstellar disc photo-ionization model 1.1.5 The warm, dense molecular gas model
1.2 The IR properties of massive stars . . . . 1.3 Molecular environment of massive stars .
1.3.1 OH .. . 1.3.2 H20 .. . 1.4 Star formation . . 1.5 Methanol masers
1.5.1 Brief history .
1.5.2 Class I and Class II methanol masers 1.5.3 Pumping of methanol masers .. 1.5.4 Observations of methanol masers 1.6 Outline of the thesis . . . .
2 ATCA observations 2.1 Abstract . . . 2.2 Introduction . 2.3 Observations . 2.4 Results . . .. 2.5
2.6
Individual sources .
2.5.1 Kinematic distance 2.5.2 Modelling the discs
2.5.3 Properties of the ionized gas Discussion . . . . 2.6.1 Continuum association . 2.6.2 Source modelling . . . . 2.6.3 Circumstellar disc model
viii
IV
Vll
1 1 2 3 3 3 4 4 4 4 5
6
7 7
7
8 8 10
2.7 Conclusions 2.8 Acknowledgments
3 MIR observations
3.1 Introduction .
3.2 Observations and data reduction . 3.3 Results .
3.3.1 Individual sources . 3.4 Discussion
3.4.1 Morphology of the MIR sources 3.4.2 !RAS associations .
3.4.3 Wood and Churchwell diagram 3.4.4 Source luminosities
3.4.5 MIR associations of methanol masers 3.4.6 Spectral class calculations
3.5 Conclusion . ..
4 Proper-motion
4.1 Introduction . 4.2 Source selection 4.3 Observations . . 4.4 Data reduction 4.5 Results . . .
4.5.1 G309.921+0.479 4.5.2 G 318.949-0.193 4.5.3 G 339.884-1.259 4.5.4 G345.010+1.792 4.5.5 NGC 6334F . . .
4.6 Oh, When the masers come marching in! 4. 7 Proper-motion modelling . . . . .
4.7.1 The basic equations . . . . 4.7.2 Proper-motion simulations 4.8 Proper-motion results ..
4.8.1 G309.921+0.479 4.8.2
G
339.878-1.252 4.8.3 G345.010+1.792 4.8.4 NGC 6334F . . . 4.9 Discussion . . . .4.9.1 Coincidence of 6.7- and 12.2-GHz components 4.9.2 Comparison with ATCA observations . . . 4.9.3 Viability of the proper-motion experiment 4.10 Conclusion . . . .
5 Extragalactic methanol masers 141
5.1 Abstract . . . . 141
5.2 Introduction . . . . 141
5.3 Observations . . . . 143
5.3.1 NGC253. . 143
5.3.2 Megamaser survey . 143
5.4 Results . . . . 145
5.4.1 NGC253 . . . . 145
5.4.2 Megamaser survey . 148
5.5 Discussion . . . 148
5.5.1 NGC253 . . . . 148
5.5.2 Megamaser survey . 148
5.6 Conclusions . . . . 150
5.7 Acknowledgments
...
. 1506 Conclusions 151
A ATCA UCHn regions 155
References 162
List of Tables
2.1 6.7-GHz methanol masers observed using the ATCA . . . . 2.2 Continuum associated with the 6.7-GHz methanol masers .
17 18 2.3 Derived parameters for the observed Hn regions . . . 19 2.4 Continuum sources with no associated 6.7-GHz methanol 20 2.5 Methanol sources from Ellingsen et al. . . . 21 3.1 Sources observed at 11.5 µmusing the AAT . . . 67 4.1 The methanol maser sources in the VLBI proper-motion sample 92 4.2 The properties of the four LBA antennas . . . 94 4.3 Comparison of ATCA and VLBI positions for G 309.921 +0.479 . 99 4.4 Comparison of ATCA and VLBI positions for G 318.949-0.193 . . 102 4.5 Comparison of ATCA and VLBI positions for G 339.884-1.259 . . 106 4.6 Comparison of ATCA and VLBI positions for G 345.010+1.792 . . 109 4. 7 Comparison of ATCA and VLBI positions for NGC 6334F . 114 5.1 The selected sample of galaxies . . . . 146
List of Figures
2.1 ATCA image of 0 305.202+0.207 23
2.2 ATCA image of 0 305.208+0.206 24
2.3 ATCA image of 0 305.247+0.245 25
2.4 ATCA image of 0 308.918+0.123 26
2.5 ATCA image of 0 309.921+0.479 27
2.6 ATCA image of 0 316.640-0.087 28
2.7 ATCA image of 0323.740-0.263 29
2.8 ATCA image of 0 323. 7 41-0.263 30
2.9 ATCA image of 0 327.120+0.511 31
2.10 ATCA image of 0 327.402+0.444 32
2.11 ATCA image of 0 327.402+0.445 33
2.12 ATCA image of 0 328.236-0.547 34
2.13 ATCA image of 0 328.254-0.532 35
2.14 ATCA image of 0 331.132-0.244 36
2.15 ATCA image of 0 331.278-0.188 37
2.16 ATCA image of 0335.789+0.174 38
2.17 ATCA image of G335.726+0.191 39
2.18 ATCA image of G 336.404-0.254 40
2.19 ATCA image of 0 336.433-0.262 41
2.20 ATCA image of G 337.612-0.060 42
2.21 ATCA image of 0 337.632-0.079 43
2.22 ATCA image of 0 337.705-0.053 44
2.23 ATCA image of 0 338.460-0.245 45
2.24 ATCA image of 0 340.785-0.096 46
2.25 ATCA image of G 348.550-0.979N 47
2.26 ATCA image of G 348.550-0.9798 . 48
2.27 ATCA image of 0 353.410-0.360 . 49
2.28 ATCA image of G 9.621+0.196. . . 50
2.29 Methanol luminosity versus continuum luminosity 51
2.30 Luminosity distribution of the 6.7-0Hz methanol sources 52 2.31 Distribution flux density of UCHn regions associated with methanol 53 2.32 Methanol linearity versus methanol luminosity . . . 57 2.33 Distribution of methanol luminosity . . . 58 2.34 Implied velocity gradient mass verses UCHn implied mass 60
3.1 AAT image of 0 305.199+0.206 66
3.2 AAT image of 0 308.918+0.123 70
3.3 AAT image of G 309.921 +0.479 71
3.4 AAT image of G323.741-0.263 and G323.740-0.263 72
3.5 AAT image of G 327.402+0.445 and G 327.402+0.444 73
3.6 AAT image of G 328.809+0.633 74
3.7 AAT image of G 331.278-0.188 75
3.8 AAT image of G 345.010+ 1. 792 76
3.9 AAT image of G 345.504+0.349 77
3.10 AAT image of NGC 6334F . . . 78
3.11 Luminosity of methanol versus luminosity of IR source 80 3.12 Luminosity of UCHn regions versus the luminosity of IR source 81 3.13 !RAS 12 µm flux density versus 11.5 µm flux density . . . 82 3.14 Colour-colour diagram of methanol sources with a !RAS association 84 3.15 The 12 µm flux of !RAS sources versus luminosity . . . 85 3.16 The spectral type of the star associated with methanol sources 88 4.1 VLEI image of G 309.921+0.479 . . . 97 4.2 The northern section of the G309.921+0.479 . . . 98 4.3 v-a diagrams of sections of G309.921+0.479 . . . 99 4.4 Comparison of VLBI and ATCA for G309.921+0.479 . 100 4.5 VLBI image of G 318.949-0.193 . . . 101 4.6 Comparison of VLBI and ATCA positions for G 318.949-0.193 . . 102 4.7 VLBI image of G 339.884-1.259 . . . 103 4.8 Close-up of G 339.884-1.259 . . . 104 4.9 Comparison of VLBI and ATCA positions for G 339.884-1.259 . . 106 4.10 6.7-GHz and 12.2 GHz components in G345.010+1.792 . . . 107 4.11 VLBI image of G 345.010+1.792 . . . 108 4.12 Comparison ofVLBI and ATCA positions for G345.010+1.792. . 109
4.13 VLBI image of NGC 6334F. . . 111
4.14 Close up of NGC 6334F. . . 112 4.15 Separate v-a diagrams for NGC 6334F. . . 113 4.16 Comparison of VLBI and ATCA positions for NGC 6334F . . 114 4.17 A selection of individual components in the source G345.010+1.792 115 4.18 Individual components in NGC 6334F . . . . 116 4.19 "March" vectors for G 318.949-0.193 and G 339.884-1.259 . 117 4.20 "March" vectors for G345.010+1.792 and NGC6334F. . 118
4.21 March components for G 318.949-0.193. . 119
4.22 March components for G 339.878-1.252 . . . 120
4.23 March components for G 345.010+ 1. 792 . . . 121
4.24 Geometry of the proper motion equations . . 123
4.25 Geometry used in Figs. 4.26 to 4.28 . 125
4.26 Simulated v-a diagram . . . 125
4.27 Simulated p-a diagram . . . . 126
4.28 Simulated proper-motion . . . 126
4.29 Model of the simulated disc and v-a diagram . . 127 4.30 The p-a diagram . . . . 128 4.31 Proper motion between the first and second epoch second and third
epoch . . . 129 4.32 Proper-motion diagram for G 309.921 +0.479 . . . 131
4.33 Proper-motion for G 339.878-1.252 . . . . 4.34 Proper-motion versus flux density for G 339.878-1.252 4.35 Proper-motion diagram for G 345.010+1.792 . . . . 4.36 p-a diagram for G 345.010+1.792 . . . .
4.37 Proper-motion between October 1994 & July 1995 and July 1995 . 132 . 132 . 133 . 134
& August 1996 for G 345.010+ 1. 792 . . . 134
4.38 Proper-motion versus versus flux density for G345.010+1.792 . 135 4.39 Proper-motion diagram for NGC 6334F . . . 136 4.40 A typical u-v coverage for a 4 antenna experiment . . . 138 4.41 Flux density variations for G 339.878-1.252 and G 345.010+1.792 . 139 A.1 Radio continuum image of G 305.199+0.206 at 8.6 GHz . 156 A.2 Radio continuum image of G 323.744-0.253 at 8.6 GHz . 156 A.3 Radio continuum image of G 327.131+0.526 at 8.6 GHz . 157 A.4 Radio continuum image of G 327.176+0.514 at 8.6 GHz . 157 A.5 Radio continuum image of G 327.107+0.493 at 8.6 GHz . 158 A.6 Radio continuum image of G 335.772+0.143 at 8.6 GHz . 158 A.7 Radio continuum image of G335.772+0.139 at 8.6 GHz . 159 A.8 Radio continuum image of G 336.442-0.260 at 8.6 GHz . 159 A.9 Radio continuum image of G 338.461-0.258 at 8.6 GHz . 160 A.10 Radio continuum image of G 338.405-0.205 at 8.6 GHz . 160 A.11 Radio continuum image of G 348.530-0.972 at 8.6 GHz . 161 A.12 Radio continuum image of G 348.698-1.027 at 8.6 GHz . 161
Chapter
1
Introduction
Massive stars play a vital role in the dynamics and evolution of a galaxy. They produce powerful stellar winds which deposit momentum and mechanical energy into the interstellar medium. They heat the surrounding molecular clouds and supply energy for endothermic chemical reactions, but eventually destroy their parent molecular cloud, halting further star formation. At the end of their lifetime (of the order of 106 yr) they violently explode as supernovae, enriching the region with heavy elements and producing a violent shock which is thought to trigger star-formation in neighboring molecular clouds. Understanding the formation and evolution of massive stars is important for understanding galaxies as a whole.
Massive stars form in the warm dense cores of molecular clouds, and so they are obscured at optical wavelengths by many magnitudes of extinction. As a consequence, their evolution is poorly understood. Newly formed 0 and B stars heat and ionize their environment, creating sources of infrared and radio emission. So investigations of massive stars rely on indirect observations of their effect on the immediate vicinity and usually consist of far-infrared (FIR) observations of thermal dust, and radio-wavelength observations of ionized hydrogen (Hn) and molecular line emission from the gas cloud. Much of this work has consisted of low (spatial) resolution infrared and single-dish radio observations. Because of the small size (.-v 1 arcsec) of the sources and the complexity of the star-forming regions, high resolution observations are needed to understand properly the dynamics of these objects.
1.1
Ultra-compact
Hn
regions
Ultra-compact Hn regions (UCHn) are small photo-ionized nebulae produced by 0 and B stars embedded in molecular gas and dust. They are characterized by having diameters less than 0.15 parsec (pc), high emission measures (>106 pccm-6
) and high electron densities (>103 cm-3
) (Habing and Israel, 1979). From a VLA survey of 75 UCHn regions, Wood & Churchwell (1989b) classified the morphologies into five classes: spherical or unresolved (43%), cometary (20%), core-halo (16%), shell (4%) and irregular or multiply peaked (17%).
UCHn regions form when fusion begins in the cores of young stars with a
CHAPTER 1. INTRODUCTION 2
spectral type earlier than about B3. The flux of UV photons ionizes the circum-stellar region which expands rapidly, but the rate of expansion quickly slows as the ionized volume increases. The initial ionized region forms over a timescale of a few years, so is essentially unobservable. The radius, Ti, of the initial "Stromgren
Sphere" is expressed as:
(1.1)
where
s*
is the flux of the ionizing photons, no is the ambient density of the gas, and/3
2 is the recombination coefficient and equals (32(Te)
= 2.6x10⁻¹⁰Te-3/4 cm3s-1, andTe
is the temperature of the ionized gas (Stromgren, 1939; De Pree et al., 1995). The value of Ti depends on the density in which the star forms, Ti ex n~2!3,and the spectral type of the embedded star, Ti ex
s°Y
3•Once the Stromgren Sphere has formed, the ionized region is suddenly at 104 K while the surrounding region is at ,..._, 100 K, creating a pressure gradient. The newly formed UCHn region expands until pressure equilibrium has been achieved. The expansion of the UCHn regions follows the relation:
(1.2)
where Ti is the initial Stromgren radius, Ci is the sound speed (10 km s-1) and t is the time in seconds.
The inferred lifetime of an UCHn region is approximately 10 per cent of the life-time of the central OB star (see Section 3.1). However the simple model of UCHn evolution outlined above implies that the UCHn phase can only last ""'1.7 per cent of an OB star's lifetime or a few times 104 years (Wood and Churchwell, 1989b). Expansion of the Hn region must be inhibited in some way and several mechanisms have been proposed the explain this apparent paradox.
1.1.1
The bow shock model
CHAPTER 1. INTRODUCTION 3
may in fact cross numerous separate cloud cores in its lifetime, producing separate cometary Hn regions in each.
A problem with this model is that only 20 per cent of UCHn regions have a cometary morphology, but if their lifetimes are greater they should represent the majority. Mac Low et al. (1991) suggest that unresolved and spherical UCHn regions could represent cometary Hn regions coming towards the observer. Hollen-bach et al. (1994) have criticized this model because they consider a high fraction of fast moving OB stars unlikely.
1.1.2
The champagne flow model
Tenorio-Tagle has suggested that some UCHn regions may be "champagne" Hn regions (Tenorio-Tagle, 1979; Bodenheimer et al., 1979; Yorke et al., 1983). If a star forms near a density gradient in the molecular cloud (at the edge of the cloud for instance), then when the ionization front of the expanding Hn region reaches the density gradient a "blow-out" of the ionized gas will occur, into the low density region. This will cause pressure confinement in the high density direction and the Hn region will expand more slowly. A comparison of Hn regions and CO cloud observations shows that the majority of Hn regions are at the edge of molecular clouds (Israel, 1978).
The expected morphology of a champagne flow roughly matches that of the cometary UCHn regions, but van Buren et al. (1990) note that observed cometary compact Hn regions are limb-brightened, which is rarely seen in champagne flow models. The champagne model also predicts that more objects should be seen at a later evolutionary stage, while the simulations which best match observed Hn regions correspond to young objects.
1.1.3
Photo-evaporated molecular core model
Gaume et al. (1994; 1995) have made high sensitivity VLA observations of G 34.3+0.2 and Sgr B2. They find a velocity gradient in the H93a line emis-sion perpendicular to the symmetry axis of a number of cometary Hn regions. They claim that neither the bow-shock nor champagne flow models adequately explain these observations. They propose an "improved" champagne model, in which the exciting star photo-evaporates material off of the hot molecular core, which flows towards a region of lower density.
1.1.4
The circumstellar disc photo-ionization model
CHAPTER 1. INTRODUCTION 4
are achievable with a 2-10 M0 disc. The disc will be optically thick at centimetre wavelengths with a spectral index of a = 0.6
(Sv
ex: v0·6). However, as noted by De Pree et al. (1995), the spectral indices found by Wood & Churchwell (1989b) cover a much larger range. This model does not address the variety of UCHn morphologies observed.
1.1.5
The warm, dense molecular gas model
De Pree et al. (1995) have suggested a simple explanation to extend the lifetime of UCHn regions. Wood & Churchwell (1989b) assumed a molecular density of 105 cm-3 and a temperature of 25 K. De Pree et al. suggest that the molecular gas in which the OB stars form is denser and warmer than previously believed. Recent observations of Sgr B2 and G 10.47+0.03 support this with derived densities of ""'107 cm-3 and l.2xl07 cm-3 and temperatures of 200 K and 75 K respectively (Hiittemeister et al., 1993; Garay et al., 1993). A higher initial density will result in a smaller initial Stromgren radius (Equation 1.1). Thus the expanding UCHn region will have a smaller diameter after a given period of time. The rate of expansion will also be less for a smaller sphere (Equation 1.2). Using the simple Stromgren model, UCHn region life-times of,..., 105 yr would be expected with a density of 107 cm-3. Adding further support to this model, De Pree et al. found many UCHn regions in the literature with smaller radii than the expected initial Stromgren sphere, assuming a density of 105 cm-3.
1.2
The IR properties of massive stars
As well as ionizing the surrounding gas, the embedded star heats the circumstellar dust which then radiates at FIR wavelengths. The properties of this emission and how it has been used to study massive star-formation is discussed in Chapter 3.
1.3 Molecular environment of massive stars
Because radio-wavelength observations can penetrate the obscuring dust in star forming regions, observations of molecular lines at these wavelengths can tell us much about the environment of the young star. Studies of the maser emission from OH and H20 molecules has vastly improved our understanding of the physical conditions around young massive stars.
1.3.1
OH
CHAPTER 1. INTRODUCTION 5
1965; Mezger et al., 1967; Habing et al., 1974), but not confirmed with high resolution ( <1 arcsec) observations until 1980 (Reid et al., 1980).
To explain the high molecular density thought to be needed to pump OH, Elitzur & de Jong (1978) suggested that OH maser spots are located in a com-pressed shell between the shock and ionization fronts of an expanding Hn region. This theory is supported by the observations of Baart & Cohen (1985) who find that there is a general tendency for the OH masers to lie at a greater distance from more luminous OB stars. Bloemhof et al. (1996) find that the shape of the OH maser spots show a tendency to be elongated in a direction parallel to the shock front delineated by the Hn region, and suggest that this supports this theory.
However this view is not uniformly held; Garay et al. (1985) find the majority of maser spots appear projected onto the most compact Hn regions in a complex, with the probability of finding an OH maser spot highest towards the centre of the UCHn region. Gaume & Mutel (1987) make a similar finding and conclude that OH masers cannot be uniformly distributed in a shell around a central star. van Buren et al. (1990) have suggested that the OH masers lie in the shock-compressed flow around the ionized region in cometary bow-shocks.
Because OH is a paramagnetic molecule it is a powerful tool for studying astronomical magnetic fields. A typical magnetic field of a few milli-Gauss will split the OH spectral lines into left and right circular polarisations by an amount greater than the line's width (Elitzur, 1992). As the splitting is proportional to the strength of the magnetic field, this allows a direct measurement of the field to be made.
Emission from the 22-G Hz 616 - 523 rotational transition of H20 was first identified
CHAPTER 1. INTRODUCTION 6
1.4
Star formation
The processes of star formation are complex and cover 12 orders of magnitude in mass and linear scale. Not surprisingly, there is a wide variety of opinion on the details of the processes. The following summary is based on the models of Shu et al. (1987; 1993).
Giant molecular clouds (GMC) are the principal site of active star formation. In the first stage of star formation, cores develop within a molecular cloud. The clouds are supported against self-gravitation by a combination of the magnetic field and turbulent motions. Support of neutral components arises through friction generated when these components slip with respect to charged components. In a lightly ionized gas, the magnetic fields slowly leak out via ambipolar diffusion and eventually magnetic support is lost and the gas and dust slowly contract.
When the contracting core becomes sufficiently centrally concentrated the sec-ond stage of the process occurs and a protostar, with a surrounding disc, forms at the centre of the cloud core, which collapses from the inside out.
In the third stage, powerful winds break out along the rotation axis of the sys-tem, creating a bipolar outflow. These winds are triggered by the commencement of deuterium burning in the protostar. The bipolar outflows sweep up material over the poles into two outwardly expanding shells of gas and dust, reversing the infall. The angle subtended by the outflow opens and eventually halts all accretion onto the star, revealing a newly formed star with a circumstellar disc.
It is generally believed that different mechanisms are involved in the formation of high and low mass stars. High mass stars form when a large core in a GMC collapses, producing a tight group of stars formed more-or-less simultaneously. Low mass stars form independently from core collapses. If the mass of the cloud core is larger than a critical value, the self-gravitation of the core will overcome the magnetic support. However, for lower mass cores, collapse will not occur until the magnetic field has significantly decayed. The above description largely applies to the formation of low mass stars, and the formation of massive stars is more complex and less well understood.
CHAPTER 1. INTRODUCTION 7
1.5
Methanol masers
Many lines of methanol have been observed in molecular clouds, due to its complex microwave spectrum and high abundance in molecular clouds. There are 294 transitions of methanol which have been detected astronomically between 834 MHz and 802 GHz (Lovas, 1992). The history and properties of methanol masers, up until 1991, has been reviewed by Menten (1991b) and a brief summary follows including more recent results.
1.5.1
Brief history
The first interstellar methanol maser was discovered in 1971 by Barrett et al. (1971) towards Orion-KL at 25.0 GHz. This was the only known masing transition of methanol until 1984 when Wilson et al. (1984; 1985) discovered two masing transitions of methanol at 23.1 and 20.0 GHz towards the star-forming region W3(0H). Since then many masing transition of methanol have been discovered. The discovery of the very strong and widespread methanol transitions at 12.2 GHz (Batrla et al., 1987) and then at 6.7 GHz (Menten, 1991a) have triggered great interest in the properties of interstellar methanol masers.
1.5.2
Class I and Class II methanol masers
Methanol masers can be divided into two classes (Batrla et al., 1987). Class I masers include transitions at 9.9, 25.0, 36.2, 44.1, 84.5, 95.2 and 146.6 GHz. They are characterized by being offset from Hn regions and OH/H20 sources by up to 1 parsec. They typically show narrow emission (Llv=0.3-0.7 km s-1) and the
spectra from different transitions at the same site are very similar. They are almost certainly collisionally pumped (Cragg et al., 1992) and are thought to arise when mass outflows interact with ambient high density material (Plambeck and Menten, 1990).
Class II sources include transitions at 6.7, 12.2, 20.0, 23.1, 37.7, 38.3, 38.5 and 107.0 GHz. They are closely associated with UCHn regions and OH maser sources. Their spectrum is more complex than Class I sources with many components spread over a few km s-1. The spectra of different transitions cover the same velocity range but show more variation than Class I masers.
CHAPTER 1. INTRODUCTION 8
resolution (interferometric) observations at both transitions, the claim of Slysh et al. cannot be verified.
1.5.3 Pumping of methanol masers
It is generally agreed that Class I methanol masers are pumped by collisional excitation, followed by spontaneous radiative decay (Cragg et al., 1992).
The pumping of Class II methanol masers is poorly understood, a situation not helped by the fact that details of the collisional excitation of methanol by molecular hydrogen are not known. In the model of Cragg et al. (1992) there exist two regimes: Class I masers appear when gas kinetic temperature is greater than the continuum temperature, while Class II masers appear when the kinetic temperature is less than the continuum temperature. The populated states in the two regimes are opposite, explaining why absorption of Class II transitions is seen towards Class I sources and vice-versa. Pumping of Class II masers is by sub-millimetre photons and the effects of collisional excitation are thought to be negligible. This model accounted for all known Class I and Class II masers at the time it was published but failed to predict the 107.0-GHz 31 - 40A + transition (Val'Tts et al., 1995). This model could not produce brightness temperatures as high as those observed.
Sobolev et al. (1994; 1997b; 1997a) have expanded this model including the second and first torsionally excited states of the molecule, to account for the high brightness temperatures of the 6.7- and 12.2-GHz methanol transitions. This model can produce high brightness temperature emission for all known Class II transitions, and predicts a number of new candidate transitions. The basic el-ements of the model are that portions of methanol-rich gas amplify continuum radiation from the background Hn region. The masers are pumped by warm dust, hotter than 150 K. The main findings of this model are that to produce strong masers:
(i) the masers must be beamed with c:-1
>
3.(ii) the ratio of the methanol abundance to molecular hydrogen must be greater than 7 x 10⁻⁷. This is much higher than the usual environment in molecular
clouds.
(iii) high molecular hydrogen densities are required (greater than 3 x 106 cm-3).
(iv) the gas kinetic temperatures must be less than 50 K.
1.5.4
Observations of methanol masers
CHAPTER 1. INTRODUCTION 9
Array (ATCA) and the Australian Long Baseline Array (LBA) are the only in-terferometers which can routinely observe the 6.7-GHz transition of methanol. The VLBA can observed the 12.2-GHz transition of methanol, but most methanol sources are in the Southern Hemisphere.
All early surveys for 12.2-GHz masers were targeted towards known star-formation regions or OH and H20 masers, which trace star formation regions, and were very successful (Batrla et al., 1987; Norris et al., 1987; Kemball et al., 1988; Koo et al., 1988; Caswell et al., 1993). These observations firmly established that methanol masers are found in star forming regions. Observations towards OH/IR sources failed to find any emission (Norris et al., 1987; Koo et al., 1988). Early searches for the 6.7-GHz transition towards star forming regions and OH masers were also successful (Menten, 1991a; Macleod and Gaylard, 1992; Gaylard and Macleod, 1993; Caswell et al., 1995c). Searches for 6.7-GHz masers towards known 12.2-GHz sources (Macleod et al., 1992) and vice-versa (Macleod et al., 1993; Gaylard et al., 1994; Caswell et al., 1995b) showed that the two transitions are closely related. A number of surveys for 6. 7-GHz methanol have been targeted towards colour selected IRAS sources and have been very successful(Schutte et al., 1993; van der Walt et al., 1995; van der Walt et al., 1996; Walsh et al., 1997), these surveys are discussed in Chapter 3. Using targeted surveys such as these, it is possible that an entire class of methanol masers not associated with star forma-tion or OH masers may be missed. A fully sampled blind survey by Ellingsen et al. (1996b) and partially sampled blind survey by Caswell (1996b; 1996a) have found a large number of previously undetected methanol masers, but have not found the new masers to be associated with any other type of object. In fact, a large proportion of these masers are not associated with any known sources (Ellingsen, 1997 private communication).
The spectra of 6.7- and 12.2-GHz masers are quite similar, both in velocity and overall shape. The velocity ranges of the 12.2-GHz spectra are typically smaller than for the 6.7-GHz spectra (Caswell et al., 1995b). The 6.7-GHz transition is, on average, stronger than the 12.2-GHz transition. The median ratio of the 6.7-GHz peak flux density to the 12.2-GHz peak flux density is 9 (Caswell et al., 1995b). The 6.7-GHz transition is found towards most 1.6-GHz OH masers and is, on average, brighter than the OH, with a median ratio of the peak flux densities of 6 (Caswell et al., 1995c). The OH spectra and methanol spectra have a similar velocity range.
Caswell et al. (1995a) found that most (75 per cent) 6.7- and 12.2-GHz methanol masers show little variability, which is in agreement with other observa-tions (Catarzi et al., 1993; Moscadelli and Catarzi, 1996), which suggests that the masers are, in general, saturated. Most masers which are variable have amplitude variations less than a factor of two and the separate spectral features often vary independently. Some features have been seen to flare and fade numerous times, while others vary quasi-periodically with a median period of 16 months (Caswell et al., 1995a; Macleod and Gaylard, 1996). A small number of sources show sig-nificant variation on a time-scale of weeks (Macleod and Gaylard, 1996; Ellingsen 1996, private communication).
CHAPTER 1. INTRODUCTION 10
consist of a few VLBI observations (Menten et al., 1988; McCutcheon et al., 1988; Norris et al., 1988; Menten et al., 1992; Ellingsen, 1996; Norris et al., 1998), which are discussed in Chapter 4, and ATCA observations, discussed below. One of the more important findings of the VLBI is that, in some cases, the 6.7- and 12.2-GHz maser components are coincident to within a few milli-arcsec. The main ATCA observations consist of the 6.7-GHz surveys by Caswell, mentioned above, observations of the 6.7-GHz maser emission and absorption in the molecular cloud complex Sgr B2 (Houghton and Whiteoak, 1995), comparison of the 6.7-GHz methanol maser positions to 1.6-GHz OH and 6.0-GHz excited OH (Caswell et al., 1995d; Caswell, 1997), maps of the individual maser components (Norris et al., 1993) and associated UCHn regions (Ellingsen et al., 1996a). Work in progress includes ATCA followup observations of the single-dish surveys of Walsh et al. (1997) and Ellingsen et al. (1996b) (by the respective authors).
Comparison of the positions of 1.6-GHz OH and 6.7-GHz methanol show that they are coincident to within the errors of 1 arcsec. This confirms the close as-sociation between methanol and OH. The spatial resolution of these observations (particularly at 1.6-GHz) is not enough to test whether or not the masers come from the same region; comparisons of the individual component positions sug-gest they do not. Emission from 6.0-GHz excited OH is also coincident with the 6.7-GHz methanol and, interestingly, has a similar overall spatial morphology.
The ATCA observations of Norris et al. (1993) are of particular interest for this thesis. Ten out of 15 sources imaged showed a linear or curved structure. Remarkably, many of the linear sources also showed a monotonic or near monotonic velocity gradient along the source. This morphology was also seen in earlier Parkes Tidbinbilla Interferometer (PTI) observations at 12.2-GHz (Norris et al., 1988). Norris et al. (1993; 1998) have suggested a model in which the linear maser sources delineate an edge-on circumstellar disc around a young massive star. Interestingly, Moscadelli & Catarzi (1996) have suggested the methanol maser source W 48 is an edge-on disc, to explain the velocity dependence of the spectral intensity variations. Observations of extra-galactic methanol masers are discussed in Chapter 5. The only known extra-galactic masers are 3 found in the Large Magellanic Cloud (Sinclair et al., 1992; Ellingsen et al., 1994a; Ellingsen et al., 1994b; Beasley et al., 1996).
1.6
Outline of the thesis
CHAPTER 1. INTRODUCTION 11
and a number of new sources which have not been observed at high resolution before.
The different high resolution observations carried out as part of this thesis are summarized below.
Chapter 2. The ATCA has been used to make simultaneous observations of the 6.7-GHz transition of Galactic methanol masers and the associated 8.6-GHz continuum. Half the masers are associated with an UCHn region. Reasons why the other half are not associated with a detected UCHn region are discussed. The morphology of the masers, and their positions relative to the associated UCHn regions are considered in view of the circumstellar disc model of methanol masers. This chapter is a reproduction of a paper accepted for publication in the Monthly Notices of the Royal Astronomical Society.
Chapter 3. The Anglo-Australian Telescope has been used to make sub-arcsec observations of the 11.5 µm continuum from dust in the regions of Galactic methanol masers. A critical analysis of the validity of !RAS associations with the maser sources is made on the basis of the mid-infrared detections
(and limits) made. Reasons for the low detection rate are also discussed.
Chapter 4. A VLBI proper-motion experiment at 6.7- and 12.2-GHz has com-menced on a sample of 8 methanol sources. It is too early to expect to see results from this experiment, but a portion of the data has been processed to make sure the experiment is viable. Simulations have shown that it will take 5 to 10 years to see proper-motions, assuming sources are edge-on discs.
Chapter 5. The ATCA has been used to search a large sample of !RAS luminous galaxies for 6.7-GHz methanol. The implications of the non-detections are discussed. This chapter is a reproduction of a paper which appeared in the Monthly Notices of the Royal Astronomical Society, volume 294 (1998).
Chapter 2
ATCA observations of methanol
masers
C.J. Phillips,1 R.P. Norris,2 S.P. Ellingsen1 and P.M. McCulloch1
1 Department of Physics, University of Tasmania, GPO Box 252-21, Hobart, TAS 7001, Australia.
2 CSIRO Australia Telescope National Facility, PO Box 76, Epping, NSW 2121, Australia.
2.1
Abstract
We have used the Australia Telescope Compact Array (ATCA) to make high-resolution images of the 6.7-GHz 51 --+ 60 A+ maser transition of methanol towards 33 sources in the Galactic Plane. Including the results from 12 methanol sources in the literature we find 17 out of 45 sources have curved or linear morphology. Most of the 17 have a velocity gradient along the line, which is consistent with masers lying in an edge-on circumstellar disc surrounding a massive star. We also made simultaneous continuum observations of the sources at 8.6 GHz, in order to image any associated Hn region. Twenty-five of the sources are associated with an ultra-compact Hn region, with a detection limit of rv0.5 mJy beam-1. We argue that the methanol sources without an associated Hn region represent less massive embedded stars, not an earlier stage in the lifetime of the star, as previously suggested.
2.2
Introduction
Observations of spectral lines associated with young massive stars at radio-wavelengths is one of the best ways of studying these objects; this is because the sources are obscured by the surrounding dust, making optical studies difficult or impossible. Interferometric observations of masing transitions are especially use-ful because of the accuracy with which the position and velocity of the individual maser components can be measured.
CHAPTER 2. ATCA OBSERVATIONS 13
Observations of the common masing molecules, OH and H20, have yielded much information on the physical conditions of young star-forming regions. However, the masers typically have a complex morphology which is difficult to interpret. The strong and common 20
--+
3_1 E and 51--+
60 A+ methanol tran-sitions at 12.2 and 6.7 GHz (Batrla et al., 1987; Menten, 1991a) add a third masing molecule to probe the regions around massive stars. These two transi-tions of methanol are frequently associated with OH and H20 masers, which are themselves believed to be tracers of massive star formation and associated with ultra-compact Hn (UCHn) regions (Reid and Moran, 1988). Because of this, methanol masers are also thought to be associated with UCHn regions, although this has only been confirmed for a small number of sources (Menten et al., 1988; Ellingsen et al., 1996a).Norris et al. (1988; 1993) used the Parkes-Tidbinbilla Interferometer (PTI) at 12.2 GHz and the Australia Telescope Compact Array (ATCA) at 6.7 GHz to make high-resolution images of these two transitions of methanol. Ten of the 15 sources imaged using the ATCA had a linear or curved structure. Remarkably, many of the linear sources also showed a monotonic or near-monotonic velocity gradient along the source. The sources which were also imaged using the PTI showed a similar morphology at 12.2 GHz.
Norris et al. (1993; 1998) have suggested a model in which the linear maser sources delineate an edge-on circumstellar disc around a young massive star. Such discs are thought to be common around young stars (Lin and Pringle, 1990; Hil-lenbrand et al., 1992; Hollenbach et al., 1994). Other models such as shock-fronts or bipolar outflow can not easily explain the velocity gradients. Modelling of the sources by Norris et al. (1998) has shown that the velocity gradients are consistent with Keplerian motion around stars with masses in the range of 4 to 14 M0.
If the masers are in a molecular disc around a young OB star, then the methanol emission would be expected to be coincident with the continuum emission assum-ing a simple Hn morphology. To test this, Ellassum-ingsen et al. (1996a) imaged the continuum emission associated with four of the sources observed by Norris et al.
(1993). Only two of the sources were associated with an UCHn region. One of these, G 339.878-1.252, has a linear structure and is aligned with a largely unresolved Hn region, as predicted by the circumstellar disc model. The other, NGC 6334F, is offset from the peak of the Hn region. Similar observations of a larger number sources are required to make any statistically significant conclu-sions.
CHAPTER 2. ATCA OBSERVATIONS 14
2.3
Observations
The sample of sources that we observed consists of:
• 10 sources from the single-dish survey by Caswell et al. (1995c), which had been discovered mainly by their association with known OH. We selected sources from Caswell et al. which had strong multiple components and had a declination south of -20°;
• 7 sources which had been previously imaged in methanol by Norris et al. (1993).
In addition, we have included for discussion and statistics a further 12 sources observed by Ellingsen et al. (1996a) and Ellingsen et al. (in preparation), and a further 16 methanol sources which happened to be in the fields of the observations of the 17 sources selected above. Nine of the sources observed by Ellingsen et al. have previously been observed by Norris et al. (1993). Thus we discuss a total of 45 sources in this paper. The sample, however, cannot be considered a representative sample because of the lack of rigid selection criteria.
The observations were made using the ATCA during observing sessions on 1994 August 25 and 26 and 1995 February 10 and 11 with the array in the 6A configuration, and on 1995 July 3 and 4 using the 6C configuration. The baselines range in length from 337 to 5939 m for 6A and 153 to 6000 m for 6C. The corre-lator was configured to record a 128-MHz band centred on 8.6 MHz and a 4-MHz band centred on 6.7 MHz simultaneously. The exact band centre for the spectral observations was 6669 or 6670 MHz depending on the LSR velocity of the source. For the continuum observations the band was centred on 8586 MHz in 1994 August and 1995 February and 8640 MHz in 1995 July. Dual orthogonal linear polariza-tions were recorded for both bands and averaged to form Stokes I after calibration. These observations allowed us to image simultaneously the 51
--+
60 A+ transition of methanol and any Hn continuum associated with the maser sources. The 4-MHz band was divided into 1024 spectral channels, giving a velocity resolution of 0.35 km s-1 after Hanning smoothing. The FWHM of the primary beams of each antenna is approximately 8.4 and 6.5 arcmin at 6.7 and 8.6 GHz respectively, while the synthesised beam was typically l.8xl.4 and l.5xl.1 arcsec, depending on the declination of the source.The observations were made by interleaving three program sources over the observing sessions of 11 to 14 h (except for the observations on 1995 July 3 where four sources were observed over 19 h). Each program source was observed for approximately 15 min with a 4-min observation of a calibrator source before and after each scan, giving a cycle time of slightly greater than 1 h.
The data were calibrated using the Astronomical Image Processing System
(AIPS). PKS 1934-638 was used as the flux-density calibrator, with an assumed flux density of 3.92 and 2.84 Jy at 6.7 and 8.6 GHz respectively. Standard re-duction techniques were applied to the spectral data (bandpass calibration, cor-rection for the Doppler shift and continuum subtraction) and imaged using the
CHAPTER 2. ATCA OBSERVATIONS 15
single channel of the data, generally the strongest maser component, and applied to the entire data set. As the maser peak flux density is strong and the maser spot size is small (in the order of a few milli-arcsec) (Ellingsen, 1996) this tech-nique works very well. The absolute position of the maser sources was obtained by calibrating and imaging a single strong spectral feature (the feature used in the self-calibration step) using a standard secondary calibrator, before the phase self-calibration was applied. This position should be accurate to better than 0.3 arcsec.
After initial calibration using AIPS, the continuum data were self-calibrated using the Difmap (Shepherd, 1997) package. Both amplitude and phase self-calibration were applied to the stronger sources, while only phase self-self-calibration was used with the weaker sources. The final images were produced using AIPS. For many of the sources observed with the 6C configuration, the correlated flux density on the shortest baseline was very large because of confusion from extended, low-brightness-temperature emission in the primary beam. The amplitude dropped off very quickly with baseline and so this extended structure was not sampled well enough to image. To improve the sensitivity to compact structure, these short baselines were removed before imaging. This reduces the sensitivity to extended structure (greater than rv 17 arcsec).
The size of the maser clusters was found to be 0.5 - 1.5 arcsec in extent, com-parable to the rvl.5-arcsec synthesised beam of the ATCA at 6.7 GHz. However, as the individual maser spots are unresolved, with a scale size of a few milli-arcsec, we can measure relative spot positions to a much greater accuracy than the size of the synthesised beam. This is done by fitting a Gaussian model to the imaged data to find the peak position. In theory, this should give a positional accuracy of the order of ( B / ( 2 x SNR)), where B is the size of the synthesised beam and SNR is the signal-to-noise ratio. For most of the sources observed, individual spectral features with fluxes greater than about 20 Jy were dynamic-range-limited with a maximum SNR typically of about 400 (this varied from 100 to 600 for the various sources). This technique fails if there are two features at the same velocity with a separation less than the size of the synthesised beam. In this case we measure the centroid of the two positions (weighted by the component flux density). Despite this limitation the sources which have been imaged using both the ATCA and VLBI show a very similar structure (Ellingsen, 1996; Phillips et al., 1996; Norris
et al., 1998), and shows that for most components the ATCA positions have er-rors of between 10 and 50 milliarcsec (Section 4.5 has a detailed discussion on the accuracy of the ATCA images).
Alignment of methanol and UCHn positions
CHAPTER 2. ATCA OBSERVATIONS 16
To determine the position of the maser features with respect to the continuum, three techniques were used.
(i) No additional corrections were made to the positions of the sources, assuming the relative positional errors were small.
(ii) The line-free channels at 6.7 GHz were averaged and then imaged for sources with detectable Hn emission at 6.7-GHz. Assuming spectral index effects are small, this should, give an accuracy similar to that achieved for the relative maser component positions, namely a few tens of milli-arcsec. However, the accuracy of the alignment is limited by the SNR which can be obtained for the GHz image. The flux density of the UCHn regions is less at 6.7-GHz, the size of the synthesised beam is larger and the bandwidth of the observations is less. For weaker UCHn regions (16 mJy at 6.7-GHz) the positional error is around 80-160 mas, and around 30 mas for a stronger (160 mJy) source.
(iii) As the two frequencies were observed simultaneously, the phase corrections used to self-calibrate the spectral data can be scaled by the ratio of the fre-quencies and applied to the (non-self-calibrated) 8.6-GHz continuum data. This technique assumes that phase-calibration errors are dominated by the optical path length in the atmosphere, and that this path length is inde-pendent of frequency between 6.7 and 8.6 GHz. This will not work if the self-calibration phase corrections are large, because of phase-wrapping am-biguities. However, after secondary calibrator corrections were applied, the self-calibration corrections were quite small.
As the corrections applied during phase self-calibration were small (typically a few tens of degrees), the shift in the position of the source when applying self-calibration was also small, of the order of a few tens of milliarcsec. This is also equal to the shift when the phase corrections are scaled and applied from one frequency to the other.
The offset between the masers and the 8.6-GHz continuum when no corrections are made can be estimated by assuming an absolute positional accuracy of the ATCA of around 0.3 arcsec . If this error is dominated by phase errors due to the offset phase calibrator, then as both the 6.7- and 8.6-GHz data are subject to the same phase errors, the offset will be proportional to the ratio of the frequencies i.e. (1 - 6.7 /8.6) x 0.3 = 66 milliarcsec.
CHAPTER 2. ATCA OBSERVATIONS 17
2.4
Results
Table 2.1 lists the methanol sources observed and the absolute position of the reference feature. Table 2.2 lists the 8.6-GHz flux density of associated Hn regions and detection limits. Because of problems encountered in modelling extended, low-brightness-temperature emission, the detection limits vary significantly between sources.
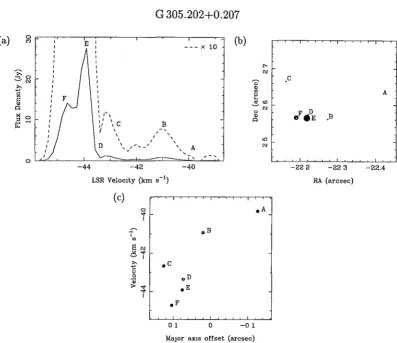
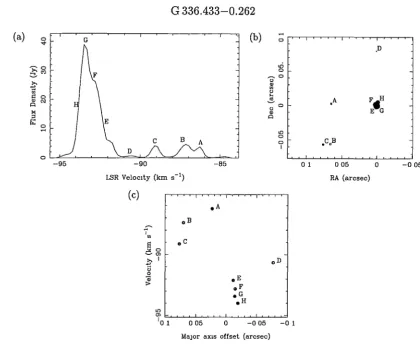
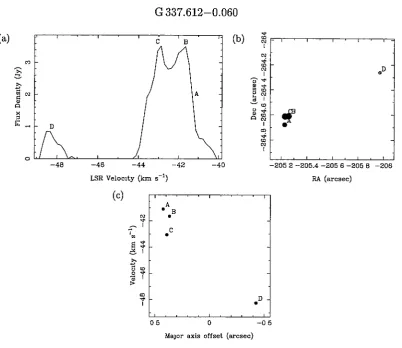
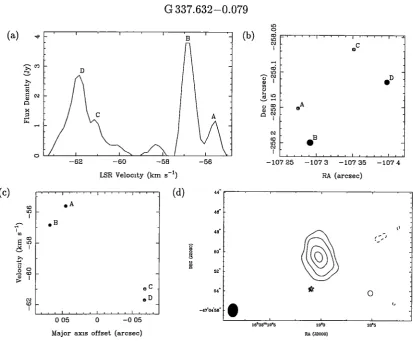
Figs. 2.1 - 2.28 show the maser spectra, the maser component distribution and the associated 8.6-GHz continuum (if any) with the 6.7-GHz maser components overlayed. Also shown in these Figures is a velocity - major axis offset (v-a) diagram. This is produced by fitting a line to the maser components and plotting the velocity of the components as a function of the distance along the line. The line fitting was done using a least-squares technique, minimizing the distance of the points to the line. This was used because the usual technique of minimizing
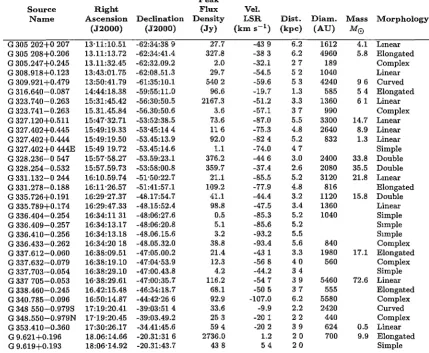
Table 2.1: 6. 7-GHz methanol masers observed using the ATCA. Masses are given only for sources with a linear v-a relationship and assume Keplerian motion. The distances are the near kinematic distance, unless noted otherwise in Section 4.1. The quoted velocities correspond to the component for which we have given a position (either the reference feature or the brightest component). The derived masses are very uncertain, as neither the distance to the source nor the size of the disc can be well determined.
Peak
Source Right Flux Vel.
Name Ascension Declination Density LSR Dist. Diam. Mass Morphology (J2000) (J2000) (Jy) (km s-1 ) (kpc) (AU) M0
[image:31.567.77.507.412.765.2]CHAPTER 2. ATCA OBSERVATIONS 18
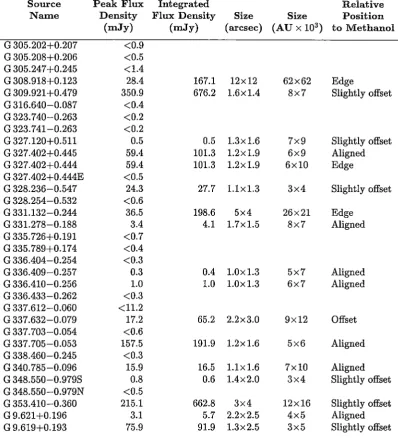
Table 2.2: Continuum associated with the 6.7-GHz methanol masers. The upper limit for the sources without any detected continuum is four times the rms noise level in the image. The restoring beam size was typically about 1.4x 1.1 arcsec.
Source Peak Flux Integrated Relative Name Density Flux Density Size Size Position
(mJy) (mJy) (arcsec) (AU x 103) to Methanol
G 305.202+0.207 <0.9 G 305.208+0.206 <0.5 G 305.24 7 +0.245 <1.4
G 308.918+0.123 28.4 167.1 12x12 62x62 Edge
G 309.921+0.479 350.9 676.2 1.6xl.4 8x7 Slightly offset G 316.640-0.087 <0.4
G 323. 7 40-0.263 <0.2 G 323. 7 41-0.263 <0.2
G 327.120+0.511 0.5 0.5 1.3xl.6 7x9 Slightly offset G 327.402+0.445 59.4 101.3 1.2xl.9 6x9 Aligned G 327.402+0.444 59.4 101.3 1.2xl.9 6xl0 Edge G 327.402+0.444E <0.5
G 328.236-0.547 24.3 27.7 1.lxl.3 3x4 Slightly offset G 328.254-0.532 <0.6
G 331.132-0.244 36.5 198.6 5x4 26x21 Edge G 331.278-0.188 3.4 4.1 1.7xl.5 8x7 Aligned G 335. 726+0.191 <0.7
G 335. 789+0.l 74 <0.4 G 336.404-0.254 <0.3
G 336.409-0.257 0.3 0.4 1.0xl.3 5x7 Aligned G 336.410-0.256 1.0 1.0 l.Oxl.3 6x7 Aligned G 336.433-0.262 <0.3
G 337.612-0.060 <11.2
G 337.632-0.079 17.2 65.2 2.2x3.0 9x12 Offset G 337. 703-0.054 <0.6
G 337. 705-0.053 157.5 191.9 1.2xl.6 5x6 Aligned G 338.460-0.245 <0.3
G 340. 785-0.096 15.9 16.5 1.lxl.6 7xl0 Aligned G 348.550-0.979S 0.8 0.6 1.4x2.0 3x4 Slightly offset G 348.550-0.979N <0.5
G 353.410-0.360 215.1 662.8 3x4 12xl6 Slightly offset G 9.621 +0.196 3.1 5.7 2.2x2.5 4x5 Aligned G 9.619+0.193 75.9 91.9 1.3x2.5 3x5 Slightly offset
the offset in the y-axis failed for the sources elongated in a north-south (y-axis) direction. We have produced a v-a diagram for non-linear sources using the same technique, but the line of best fit will be somewhat arbitrary. If there is a velocity gradient along the maser line, the components will lie on a line in the v-a diagram. Table 2.4 lists the Hn regions that were present in the primary beam of the observations, but without any associated methanol emission. Images of these sources are presented in Appendix A.
[image:32.563.86.485.154.593.2]CHAPTER 2. ATCA OBSERVATIONS 19
Table 2.3: Derived parameters for the observed Hn regions and the exciting stars associated with them. The values have been calculated following the techniques of Panagia & Walmsley
(1978). These equations cannot be applied to extended sources, or very small sources.
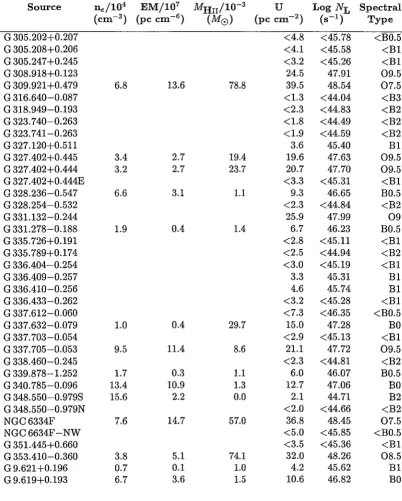
Source ne/104 EM/107 MHn/10-3
u
Log NL Spectral(cm-3) (pc cm-6)
(M0) (pc cm-2) (s-1) Type
[image:33.565.84.486.220.721.2]CHAPTER 2. ATCA OBSERVATIONS 20
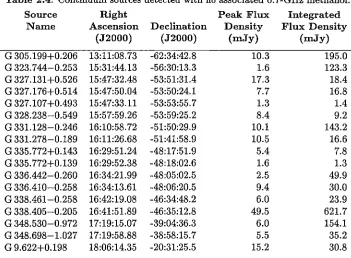
Table 2.4: Continuum sources detected with no associated 6.7-GHz methanol. Source Right Peak Flux Integrated
Name Ascension Declination Density Flux Density (J2000) (J2000) (mJy) (mJy) G 305.199+0.206 13:11:08. 73 -62:34:42.8 10.3 195.0 G 323. 7 44-0.253 15:31:44.13 -56:30:13.3 1.6 123.3 G327.131+0.526 15:47:32.48 -53:51:31.4 17.3 18.4 G 327.176+0.514 15:47:50.04 -53:50:24.1 7.7 16.8 G 327.107+0.493 15:47:33.11 -53:53:55. 7 1.3 1.4 G 328.238-0.549 15:57:59.26 -53:59:25.2 8.4 9.2 G 331.128-0.246 16:10:58.72 -51:50:29.9 10.1 143.2 G 331.278-0.189 16:11:26.68 -51:41:58.9 10.5 16.6 G 335.772+0.143 16:29:51.24 -48:17:51.9 5.4 7.8 G 335. 772+0.139 16:29:52.38 -48:18:02.6 1.6 1.3 G 336.442-0.260 16:34:21.99 -48:05:02.5 2.5 49.9 G 336.410-0.258 16:34:13.61 -48:06:20.5 9.4 30.0 G 338.461-0.258 16:42:19.08 -46:34:48.2 6.0 23.9 G 338.405-0.205 16:41:51.89 -46:35:12.8 49.5 621.7 G 348.530-0.972 17:19:15.07 -39:04:36.3 6.0 154.1 G 348.698-1.027 17:19:58.88 -38:58:15. 7 5.5 35.2 G 9.622+0.198 18:06:14.35 -20:31:25.5 15.2 30.8
summarized in Section 2.5.
The total size of the sample of methanol masers with simultaneous UCHn observations is 45. These can be qualitatively characterized into five groups.
• Linear or curved: 17 of the sources have a simple linear morphology. Twelve of these linear sources also show a linear velocity trend across the line while the other five do not. For a number of the sources with a velocity gradient (e.g. G327.120+0.511 and G327.402+0.445), the components show a re-markably straight line in the v-a digram. Others (such as G 337.705-0.053) are not as well defined, but still show a definite trend in velocity.
• Elongated: 8 of the sources have the individual maser components significantly more extended in one direction than the other. These sources seem to be half way between the linear and the complex sources. Of these, 6 show a velocity gradient, while the other two do not.
• Pair: 3 of the sources consist of two clusters separated by 0.5 to 1.0 arcsec.
In each case the cluster velocities differ by approximately 10 km s-1 and the individual clusters are elongated in a direction perpendicular to the line joining them.
1> Complex: 10 of the sources have a complex structure. Of these sources two
(G 305.247+0.245 and G 340.785-0.096) show some structure in the v-a di-agram.
[image:34.564.111.462.120.378.2]CHAPTER 2. ATCA OBSERVATIONS 21
Table 2.5: Methanol sources from Ellingsen et al. (1996b) and Ellingsen et al. (in preparation). Peak Cont. Source Right Flux Vel. Peak Flux
Name Ascension Declination Density LSR Morphology Density (J2000) (J2000) (Jy) (km s-1)
(mJy) G 318.949-0.193 15:00:55.33 -58:58:42.0 700 -34.7 Linear <0.7 G 328.808+0.633 15:55:48.45 -52:43:06.6 240 -43.8 Linear 200.2 G 328.809+0.633 15:55:48. 71 -52:43:05. 7 53 -44.2 Simple 248.2 G 339.878-1.252 16:52:04.66 -46:08:34.2 1700 -38.7 Linear 5.6 G 345.003-0.224 17:05:11.23 -41:29:06.9 73 -26.2 Complex 176.2 G 345.003-0.223 17:05:10.89 -41:29:06.2 240 -22.5 Complex <0.2 G 345.012+ 1. 797 16:56:46.82 -40:14:08.9 31 -12.7 Linear <0.7 G 345.010+ 1. 792 16:56:47.58 -40:14:25.9 410 -18.0 Linear 178.5 NGC6334F 17:20:53.37 -35:47:01.3 3300 -10.4 Elongated 536.4 NGC6634F-NW 17:20:53.18 -35:46:59.3 1500 -11.2 Elongated <6.3 G 351.445+0.660 17:20:54.61 -35:45:08.6 100 -9.2 Complex <2.6 G 351. 775-0.536 17:26:42.57 -36:09:17.6 230 1.3 Complex 10.7
We have classified 38 per cent of the sample as linear, 18 per cent are elongated, 22 per cent are complex, 7 per cent are pairs and 15 per cent are simple.
Of the 45 6.7-GHz methanol sources in this sample, 25 are associated with 8.6-GHz emission, presumably from an UCHu region. The typical 4-0" detection limit was 0.4 to 0.6 mJy beam-1 for sources without any detected UCHu emission. These detection limits are given in Table 2.2. The peak flux density of the detected continuum ranges from 0.3 to 536 mJy beam-1. The relationships of the methanol position to the UCHn region can be characterized into four groups.
• Aligned: 8 of the sources with associated continuum emission have the maser components aligned with the peak of the (unresolved) continuum emission.
• Slightly offset: 10 of the maser sources are offset 0.5 to 1.0 arcsec from the peak of the UCHu region. All but one of these continuum regions are unre-solved or very slightly reunre-solved.
• At edge: 3 of the sources are at the edge of the Hn region. Two of these continuum sources are about 10 arcsec across and probably represent regions of multiple star-formation. The masers may be associated with compact cores which are not detected because of confusion with nearby extended Hn emission.