University of Southampton Research Repository
ePrints Soton
Copyright © and Moral Rights for this thesis are retained by the author and/or other
copyright owners. A copy can be downloaded for personal non-commercial
research or study, without prior permission or charge. This thesis cannot be
reproduced or quoted extensively from without first obtaining permission in writing
from the copyright holder/s. The content must not be changed in any way or sold
commercially in any format or medium without the formal permission of the
copyright holders.
When referring to this work, full bibliographic details including the author, title,
awarding institution and date of the thesis must be given e.g.
AUTHOR (year of submission) "Full thesis title", University of Southampton, name
of the University School or Department, PhD Thesis, pagination
UNIVERSITY OF SOUTHAMPTON
3-D Content-Based Retrieval and
Classication with Applications to
Museum Data
by
Simon Goodall
A thesis submitted in partial fulllment for the degree of Doctor of Philosophy
in the
Faculty of Engineering, Science and Mathematics School of Electronics and Computer Science
UNIVERSITY OF SOUTHAMPTON ABSTRACT
FACULTY OF ENGINEERING, SCIENCE AND MATHEMATICS SCHOOL OF ELECTRONICS AND COMPUTER SCIENCE
Doctor of Philosophy by Simon Goodall
There is an increasing number of multimedia collections arising in areas once only the domain of text and 2-D images. Richer types of multimedia such as audio, video and 3-D objects are becoming more and more common place. However, current retrieval techniques in these areas are not as sophisticated as textual and 2-D image techniques and in many cases rely upon textual searching through associated keywords. This thesis is concerned with the retrieval of 3-D objects and with the application of these techniques to the problem of 3-D object annotation. The majority of the work in this thesis has been driven by the European project, SCULPTEUR.
Contents
Acknowledgements x
1 Introduction 1
2 Content-Based Retrieval Background 5
2.1 Introduction . . . 5
2.2 3-D Object Representation . . . 5
2.3 3-D Content-Based Retrieval . . . 6
2.4 3-D Storage Formats . . . 7
2.5 3-D Object Pre-Processing . . . 8
2.5.1 Translation Invariance . . . 8
2.5.2 Rotation Invariance . . . 8
2.5.3 Scaling Invariance . . . 9
2.5.4 Mesh Invariance . . . 9
2.6 3-D Algorithms . . . 10
2.6.1 Area Volume Ratio Descriptor . . . 10
2.6.2 Cord Histograms . . . 11
2.6.3 Colour Descriptor . . . 11
2.6.4 Shape Distributions . . . 12
2.6.5 Modied Shape Distribution . . . 13
2.6.6 Parameter Methods . . . 14
2.6.7 Multiple Orientation Depth Fourier Descriptor . . . 14
2.6.8 3-D Shape Histograms . . . 15
2.6.9 3-D Shape Contexts . . . 15
2.6.10 Extent Descriptor . . . 16
2.6.11 Spherical Harmonics . . . 16
2.6.12 Discrete Fourier Transform . . . 17
2.6.13 3-D Moments . . . 17
2.6.14 Extended Gaussian Image . . . 17
2.6.15 3-D Hough Transform . . . 18
2.6.16 The 3-D Shape Spectrum Descriptor . . . 18
2.6.17 Light Field Descriptors . . . 19
2.6.18 Reective Symmetry Descriptor . . . 19
2.6.19 Sphere Projection . . . 19
2.6.20 Octree . . . 20
2.6.21 Reeb Graphs . . . 20
CONTENTS iii
2.7 MPEG-7 . . . 22
2.8 Distance Metrics . . . 22
2.9 Evaluation Techniques . . . 25
2.10 3-D Data sets . . . 28
2.11 3-D Search Engines . . . 29
2.12 Summary . . . 29
3 Classication Background 31 3.1 Introduction . . . 31
3.2 Pre-processing techniques . . . 32
3.2.1 Input Normalisation . . . 32
3.2.2 One-of-N Encoding . . . 33
3.2.3 Missing data . . . 33
3.2.4 Feature selection . . . 33
3.2.5 Dimensionality Reduction . . . 34
3.2.6 Invariance . . . 34
3.3 Overview of standard classication techniques . . . 34
3.3.1 k - Nearest Neighbour . . . 35
3.3.2 Multi-Layer Perceptron . . . 35
3.3.3 Radial Basis Function Networks . . . 36
3.3.4 Support Vector Machine . . . 36
3.3.5 k-Means Clustering . . . 37
3.3.6 Kohonen's Self Organising Map . . . 37
3.4 Performance Metrics . . . 37
3.5 Classier Training Schemes . . . 40
3.5.1 Split-Sample . . . 40
3.5.2 Cross-validation . . . 40
3.5.3 Boot Strapping . . . 41
3.6 Combining Classiers . . . 41
3.6.1 Classier Ensembles . . . 41
3.6.1.1 Combining Ranked Outputs . . . 42
3.6.1.2 Estimating error diversity . . . 42
3.6.1.3 Improving error diversity . . . 43
3.6.1.4 Test and Select . . . 44
3.6.1.5 Boot strapping . . . 45
3.6.1.6 Bagging . . . 45
3.6.1.7 Boosting . . . 45
3.6.1.8 Dynamic Classier Selection . . . 46
3.6.2 Mixture of Experts . . . 47
3.6.3 Other Techniques . . . 47
3.7 Optimisation Techniques . . . 47
3.7.1 Exhaustive Search . . . 47
3.7.2 Cross-Validation . . . 48
3.7.3 Genetic Algorithms . . . 48
3.7.4 Particle Swarm Optimisation . . . 48
3.7.5 Simulated Annealing . . . 49
CONTENTS iv
4 The SCULPTEUR Project and the Semantic Web 51
4.1 SCULPTEUR Introduction . . . 51
4.2 SCULPTEUR System Overview . . . 52
4.3 Content-Based Retrieval . . . 56
4.3.1 Reuse of existing technology . . . 59
4.3.2 The Algorithms . . . 59
4.3.3 Ease of Use . . . 60
4.3.4 MySQL Module . . . 60
4.3.5 Thumbnail Generator . . . 61
4.3.6 Similarity Distance Normalisation . . . 62
4.3.7 Concluding Words . . . 63
4.4 Overview of the Classier Agent . . . 63
4.4.1 Architecture . . . 63
4.4.1.1 3-D Object Data sets . . . 64
4.4.1.2 Classier Training . . . 65
4.4.1.3 Classier Optimisation . . . 66
4.4.1.4 3-D Object Classication . . . 66
4.4.2 Classier Agent Evaluation . . . 67
4.4.2.1 Evaluation Feedback . . . 68
4.4.3 Classier Agent Discussion . . . 69
4.5 Conclusions . . . 69
5 3-D Content-Based Retrieval 70 5.1 Introduction . . . 70
5.1.1 The Content-Based Retrieval Problem . . . 72
5.1.2 3-D CBR Problems . . . 72
5.2 Description of Algorithms . . . 74
5.2.1 Area Volume Ratio . . . 75
5.2.2 Cord Histograms . . . 76
5.2.3 Extended Gaussian Image . . . 76
5.2.4 Hough Transform . . . 76
5.2.5 Shape Distributions . . . 77
5.2.6 Modied Shape Distributions . . . 77
5.2.7 Augmented Multi-resolution Reeb Graph . . . 77
5.3 Description of Metrics . . . 78
5.4 Methodology . . . 78
5.4.1 3-D Object Data sets . . . 80
5.5 Evaluation Results . . . 81
5.5.1 Princeton Shape Benchmark Data set Results . . . 82
5.5.2 PSB Results Commentary . . . 88
5.5.3 Museum Data set Results . . . 88
5.5.4 Museum Results Commentary . . . 94
5.6 Conclusions . . . 95
6 3-D Object Classication 97 6.1 Introduction . . . 97
CONTENTS v
6.2.1 Classication Techniques . . . 98
6.2.1.1 k-Nearest Neighbour . . . 98
6.2.1.2 Multi-Layer Perceptron . . . 98
6.2.1.3 Radial Basis Function Networks . . . 100
6.2.1.4 Support Vector Machine . . . 100
6.2.2 Improving Performance . . . 101
6.2.3 Early Experimentation . . . 101
6.3 Experimentation . . . 104
6.3.1 Optimisation . . . 107
6.4 Results . . . 108
6.4.1 Base Classier Performance . . . 108
6.4.1.1 DCS: k versus Accuracy Evaluation . . . 113
6.4.1.2 Random classiers . . . 114
6.4.2 Optimisation Techniques . . . 115
6.5 Discussion . . . 116
6.6 Summary . . . 120
7 Semantic 3-D Object Annotation 122 7.1 Introduction . . . 122
7.2 Some Background . . . 123
7.3 Application . . . 125
7.4 Expanding Knowledge . . . 126
7.5 Some Open Issues . . . 128
7.6 Conclusions . . . 129
8 Conclusions and Future Work 130 8.1 Conclusions . . . 130
8.2 Future Work . . . 132
A Glossary 134
B PSB Classications 137
List of Figures
2.1 Example Mesh and Voxel representation of a Sphere . . . 6
2.2 Selecting a point on the surface of a triangle . . . 13
2.3 The Sector and Shell Models for the Shape Histograms . . . 15
3.1 Under and Over tting the Sine function . . . 33
4.1 Architecture Diagram . . . 52
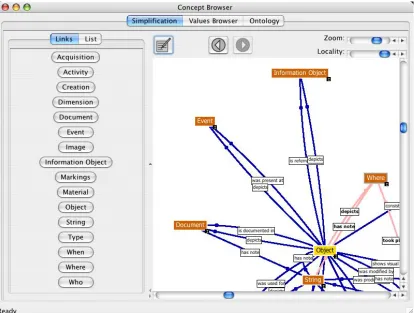
4.2 Example view from the Concept Browser . . . 53
4.3 Query Interface . . . 54
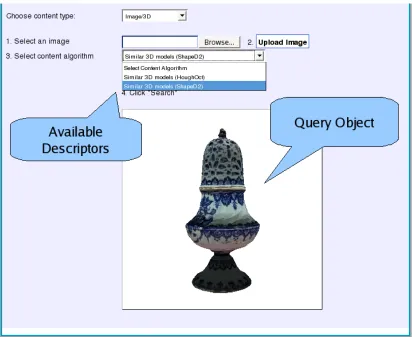
4.4 CBR with a query object uploaded . . . 55
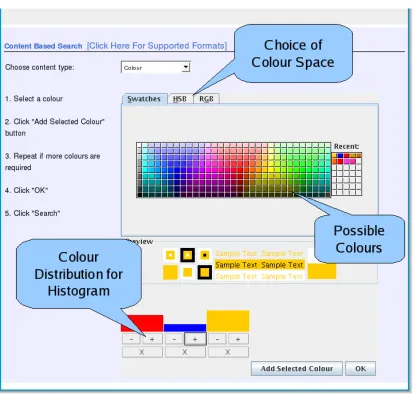
4.5 Colour Picker . . . 56
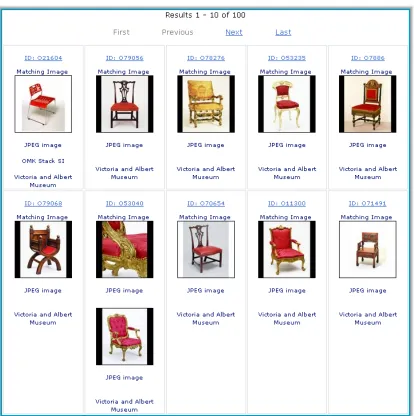
4.6 First page of results for query term chair and using the colour picker to select the colour red. . . 57
4.7 Two objects in the same co-ordinate system, but require viewing from dierent angles. . . 62
4.8 Example SRW Query to obtain all 3-D objects (Using VAM schema) . . . 65
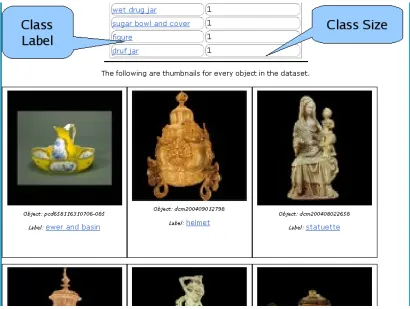
4.9 Data set Browser . . . 65
4.10 Classication Results . . . 67
5.1 Example 3-D Object . . . 72
5.2 Example Texture Map . . . 73
5.3 Untextured Object . . . 73
5.4 PSB Data set: Descriptor Comparison using the Euclidean Distance . . . 83
5.5 PSB Data set: Average Distance Metric Performance . . . 84
5.6 PSB Data set: Best Distance Metric for Descriptor . . . 85
5.7 PSB Data set: Tier Image for Shape D2 using Euclidean Distance . . . 88
5.8 Museum Data set: Descriptor Comparison using the Euclidean Distance . 90 5.9 Museum Data set: Average Distance Metric Performance . . . 92
5.10 Museum Data set: Best Distance Metric for Descriptor . . . 92
5.11 Museum Data set: Tier Image for Shape D2 using Euclidean Distance . . 95
6.1 Nearest Neighbour parameters for GA . . . 107
6.2 Multi-Layer Perceptron parameters for GA . . . 107
6.3 Radial Basis Function Network parameters for GA . . . 107
6.4 Neighbourhood size versus Accuracy . . . 113
6.5 Tier Image for Shape D2 . . . 117
6.6 Two objects conceptually dierent, but similarly shaped . . . 118
List of Tables
2.1 Descriptor Properties . . . 21
4.1 The Evaluation data set . . . 68
5.1 Short names of descriptors . . . 75
5.2 Short names of distance metrics . . . 78
5.3 Museum Data set: Classes and sizes . . . 80
5.4 PSB Data set: Ratio of Between Class and Mean Within Class Variance . 82 5.5 PSB Data set: Descriptor Performance using the Euclidean Distance . . . 83
5.6 PSB Data set: Average Distance Metric Performance . . . 84
5.7 PSB Data set: Best Metric for Descriptor - Based on highest DCG . . . . 86
5.8 PSB Data set: Best descriptor and metric for classes . . . 87
5.9 PSB Data set: Class Statistics for Shape D2 using Euclidean distance . . 89
5.10 Museum Data set: Ratio of Between Class and Mean Within Class Variance 89 5.11 Museum Data set: Descriptor Performance using the Euclidean Distance . 90 5.12 Museum Data set: Average Distance Metric Performance . . . 91
5.13 Museum Data set: Best Metric for Descriptor - Based on highest DCG . . 93
5.14 Museum Data set: Best Metric for Descriptor - Based on highest DCG . . 94
5.15 Museum Data set: Class Statistics for Shape D2 using Euclidean distance 94 6.1 SVM Test Data set . . . 102
6.2 SVM Results . . . 103
6.3 The PSO Data set . . . 103
6.4 PSO k-NN Results . . . 104
6.5 Museum data set . . . 105
6.6 Maximum accuracy achievable in PSB classications . . . 105
6.7 Nearest Neighbour Classier Accuracy . . . 109
6.8 MLP Classier Accuracy . . . 110
6.9 RBF Classier Accuracy . . . 112
6.10 Combination of all classiers accuracy . . . 113
6.11 Random - PSB Base - k-NN . . . 114
6.12 (PSB) GA Results for k-NN . . . 115
6.13 GA Results (Biased) - Museum Data set . . . 115
6.14 GA Results (Unbiased) - Museum Data set . . . 116
B.1 PSB Dataset: Classes and sizes . . . 137
B.1 PSB Dataset: Classes and sizes . . . 138
B.1 PSB Dataset: Classes and sizes . . . 139
Acknowledgements
Thanks to my supervisors, Paul H. Lewis and Kirk Martinez for all their support. Thanks to Hewlett-Packard for donations of equipment and to the SCULPTEUR project (IST-2001-35372) for funding, access to 3-D models of museum objects, and users for testing of the content-based retrieval system and classier agent versions. Tony Tung and Francis Schmitt from GET-ENST for initial implementation of 3-D shape representation algo-rithms (Area Volume Ratio, Cord Histograms, Shape Distributions, Extended Gaussian Image, 3-D Hough Transform and the augmented Multi-resolution Reeb Graph. Thanks to the Princeton Shape Retrieval and Analysis Group for providing an extensive collec-tion of 3-D objects and tools to evaluate retrieval performance. Finally I would like to thank my wife, Heather, and my parents for their continued support and encouragement throughout.
Chapter 1
Introduction
The growing number of large multimedia collections has led to an increased interest in content-based retrieval research. Content-based retrieval is concerned with retrieval based upon the data contained within a multimedia object (image, 3-D model, video etc), such as it's shape or colour rather than associated keywords which may or may not reect the full semantics of the object. Applications of content-based techniques to image retrieval is an active research area but much less work has been reported on content-based retrieval of 3-D objects in a multimedia database context. Such objects are increasingly being captured and added to multimedia collections and the European project, SCULPTEUR, developed a museum information system which includes the in-troduction of facilities for content-based retrieval of the 3-D representations. The project was also concerned with another rapidly developing area: the semantic web, which will aid the use of semantically described data both for machine processing and enhanced human interaction.
Content-Based Retrieval has been an active research area for the last few decades with many advances in the area of image-based retrieval. This research has naturally pro-gressed to other forms of multimedia; audio, video and now 3-D objects. 3-D objects oer many interesting advantages over traditional 2-D image retrieval. Such represen-tations are increasingly becoming attractive to museums wishing to digitise sculptures and other objects as the cost of 3-D acquisition becomes cheaper. A 3-D object is an explicit representation of the surface of an object and in some cases may contain the in-ternal structure as well. To gain the same information with a 2-D representation requires many images and special techniques to estimate the 3-D structure. In some cases such techniques can be used to create an actual 3-D representation of the object. Of course each dierent type of multimedia brings its own challenges and 3-D is no exception. A 3-D object can be represented in any orientation, position or scale. Additionally how the 3-D object is represented can dier vastly while still being visually similar. Two 3-D representations of the same object may dier considerably when looking closely at its representation. For example one version the surface can be composed of triangles
Chapter 1 Introduction 2 whereas in the other version it could be composed of quadrilaterals. Being able to cope with such dierences is a key feature in any 3-D retrieval algorithm.
Closely linked to object retrieval is object recognition. Once it is possible to retrieve similar objects to a query object, it should then be possible to use the same retrieval techniques to begin to classify objects into dierent groupings. Of course visual similarity does not necessarily equate to similar classes of object and not all techniques can be expected to yield good classication results.
Another area of research gaining attention is that of annotation. Annotation assigns textual keywords to an arbitrary item of data to help describe that item and to enable retrieval through textual search engines. It is also possible to annotate items of data with concepts in an ontology and this provides a much richer description as any relations associated with that concept can be associated with the data item as well. In one sense, annotation can be thought if as an extension of classication. Once some data has been classied, that classication can be used as an annotation for that data.
A large portion of this work was performed as part of the SCULPTEUR project and as such there was some collaboration in the software produced. The main software component produced was FVS, the underlying component that facilitated 2-D and 3-D content-based retrieval. The 2-3-D algorithms were ported from the FVG tool in the ARTISTE project and most of the 3-D algorithms were implemented by GET-ENST. My contribution to FVS was a re-write of the internal architecture of the FVG tool to more easily allow new algorithms to be integrated, added support for 3-D objects and to allow easy addition of further types of media, xed existing bugs and improved performance and memory utilisation. Additionally a MySQL UDF interface was written to allow fast retrieval when integrated with the rest of the SCULPTEUR system. A Java Native Interface was also written for experimentation within other systems. An ASCII based feature vector le format was implemented to allow experimentation with descriptor data in MATLAB. Multiple distance metrics have been implemented and integrated into some of the 3-D algorithms to investigate which distance metrics worked best with which descriptor. A novel component, the 3-D thumbnail generator, was also implemented using the FVS data structures for representing a 3-D object and has been integrated with Nautilus to allow previews of VRML objects on the le system. Nautilus is the le manager application that is part of the Gnome Desktop Environment. FVS has recently been released under the LGPL open source license. As part of the FVS development, numerous bug xes and enhancements have been passed back to the supporting libraries, most notably VIPS and Cyber X3D. Support was added in Cyber X3D for compressed VRML objects and the VRML parser was xed to allow 3-D objects with an arbitrary number of faces rather than only 3-D objects with a small number of faces.
Chapter 1 Introduction 3 wrapped a JSP web front-end around a MATLAB back end. This used a Support Vector Machine implementation and some Java to MATLAB code that is freely available on the web. This agent was a proof of concept system to investigate whether 3-D shape de-scriptors were usable as inputs to classiers. The second classier agent wrapped a PHP front-end around a C++ back-end. This used a custom implementation the k-Nearest Neighbour classier and k-Means clustering algorithms. A Particle Swarm Optimisa-tion and Genetic Algorithm implementaOptimisa-tion was also written to investigate automatic classier optimisation. A small application was written to communicate with a SCULP-TEUR system to create training data sets (using the SRW client application to encode a query and retrieve the response). This version of the agent provided a test bed for user trials on the interface and potential uses of the system. Final experimentation was performed in MATLAB to make use of existing classier implementations in the Netlab toolbox. Genetic Algorithms, Dynamic Classier Selection and Classier Ensembles were implemented in order to investigate how well these techniques can improve base classier performance. Much of this software is described in Chapter 4.
Two main conference papers have been published from this work as well as a number of contributions to more general papers on the SCULPTEUR project (Addis et al., 2003b; Sinclair et al., 2005b; Kim et al., 2004; Addis et al., 2005a; Goodall et al., 2004a; Addis et al., 2003a). The rst paper, Goodall et al. 2005a, is a comparison of a number of 3-D shape descriptors using both the Princeton Shape Benchmark and a data set composed of museum objects. The second paper, Goodall et al. 2005b, presents our initial experimentation with the Particle Swarm Optimisation algorithm that was part of the nal version of the Classier Agent.
The research objectives for this thesis are to design and develop a content-based retrieval system for 3-D objects using collections of multimedia objects from museums. This will include research into 3-D content-based retrieval algorithms, and classication techniques to speed up retrieval and provide recognition capabilities. The SCULPTEUR system has been tested with substantial museum collections and real users.
There are several main objectives for the work.
1. Evaluate suitability of various 3-D Content-Based Retrieval Algorithms for general purpose and specic retrieval operations.
2. Design and develop classiers using 3-D Content-Based Retrieval Algorithms as inputs to dierent classication techniques.
3. Explore and evaluate the use of 3-D classication for annotating 3-D objects.
Chapter 1 Introduction 4 with nding similar objects to the query using knowledge about the query to rene the retrieval process. For example if the query object is a vase, a technique that works well on vases can be selected.
This thesis begins with some background material relating to 3-D content-based re-trieval in Chapter 2 and classication techniques in Chapter 3. Chapter 4 introduces the SCULPTEUR project in more detail and describes the areas with which this thesis is concerned. This chapter describes the context in which the thesis has been written. This chapter also describes FVS, the content-base retrieval software developed during the course of this thesis and is the fundamental building block for content-based retrieval in SCULPTEUR and in the experimental work undertaken.
Chapter 5 gives an in depth analysis of various 3-D content-based retrieval algorithms against a publicly available data set, the Princeton Shape Benchmark and against a data set composed of 3-D objects provided by the museum partners. The 3-D descriptors are analysed for both their overall performance and on their performance for specic classes of object. Additionally, a number of dierent distance metrics are evaluated for each descriptor in order to determine what distance metrics improve the retrieval performance of a descriptor. A large range of dierent performance metrics are used to perform the evaluation.
Chapter 6 uses classication techniques to classify 3-D objects using as input the 3-D content-based retrieval techniques described in Chapter 5. Three popular classication techniques are used in the main body of work providing a large comparison for suitability as base classiers and for a combined approach.
Chapter 7 describes how the content-based retrieval and classication techniques can be integrated with semantic web technologies to facilitate 3-D object annotation.
Chapter 2
Content-Based Retrieval
Background
2.1 Introduction
In this chapter we review content-based retrieval techniques, in particular 3-D object retrieval. The chapter begins by discussing some of the issues involved with the retrieval of 3-D objects before describing a range of current 3-D descriptors and distance metrics. This chapter is also concerned with evaluating the retrieval performance of 3-D descrip-tors across dierent data sets, both for general purpose retrieval and for specic retrieval tasks.
2.2 3-D Object Representation
There are two main methods for representing arbitrary 3-D objects. One such method of representing a 3-D object is the mesh format. This is a collection of connected polygons forming either part of or the whole surface of an object. Many 3-D techniques assume that a mesh is composed of triangles rather than arbitrary sized polygons as this greatly simplies calculations. A 3-D object can be composed of one or more meshes.
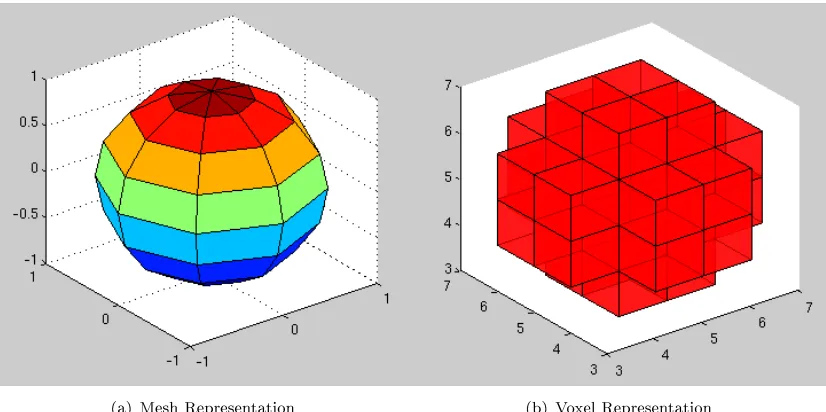
The other main method of representing a 3-D object is by using voxels. A voxel is a volume pixel, the 3-D equivalent of a pixel in a 2-D image. Unlike the mesh representation which models the surface of the object, a voxel models the whole volume of the object. As with 2-D images, increasing the scale of the model can result in blocky edges (pixelation). Often a model will be represented as a mesh and converted to voxels as needed. See Figure 2.1 for an example of a mesh and voxel representation of a sphere. The sphere has been shown deliberately low resolution to emphasise its construction.
Chapter 2 Content-Based Retrieval Background 6
[image:18.596.111.524.85.291.2](a) Mesh Representation (b) Voxel Representation
Figure 2.1: Example Mesh and Voxel representation of a Sphere
Another less commonly used method is to represent a 3-D object by a set of parameters. For example a sphere can be dened by a position and radius size. This method is only suitable for representing primitive objects, or those that can be represented easily by a pre-dened function.
2.3 3-D Content-Based Retrieval
3-D object matching is a growing research area and a wide range of diering techniques have been developed. 3-D content-based retrieval typically consists of four stages. The CBR descriptor generates a feature vector which contains the data representing a 3-D object according to the algorithm. In many cases this is a histogram.
• The rst stage is to convert the object into a suitable format that is understandable
by the rest of the process. This process may also involve re-sampling the object to provide a more even spread of vertices on the mesh. The initial sampling of the object (the creation of the mesh approximation at the time of acquisition or creation) may result in areas of the mesh being more densely populated than other areas. Typically atter areas can be represented in a few large faces and very curved areas require many small faces. This process may also try to correct problems in the object, such as holes in the mesh or triangle orientation inconsistencies. This can be done once and the result saved for future use as this process is independent of the CBR algorithm.
• The next stage is to normalise the object into a canonical co-ordinate frame; that
Chapter 2 Content-Based Retrieval Background 7 algorithms are invariant to some aspects of possible transformations, e.g. rotation, scale and translation. The exact requirements depend on the properties of the algorithm.
• Stage three is to generate the feature vector for the descriptor from the object
mesh.
• Stage four is to compare the feature vector with other feature vectors of the same
type using an appropriate distance metric.
2.4 3-D Storage Formats
There are a wide range of storage formats for 3-D objects. Most formats represent an object as a collection of polygons (typically triangles) that form a mesh. Additional information such as surface normals, texture co-ordinates (and texture maps) and colour information are also commonly stored. Some formats (e.g. VRML (Web 3D Consortium, 1997) and X3D (Web 3D Consortium, 2004)) also allow 3-D objects to be represented by parameters (e.g. radius and position for a sphere). Many formats have been developed in association with a 3-D modelling packages (such as 3-D Studio (Autodesk, Inc, No Year) and Blender (Blender Foundation, No Year)) and may represent an entire 3-D scene containing camera information, animations etc. Other formats are designed to be quick to load for use in high performance games (e.g. MD3/MD4 le format in Quake (ID Software, 1999)).
VRML is the Virtual Reality Modelling Language and is a widely used format for dis-tributing 3-D objects across the World Wide Web. It is a highly exible ASCII based format and there are numerous viewer applications and plug-ins for this format and many 3-D packages list VRML as a supported le type. However the format allows for too much variability in describing an object which can cause problems when processing an object. An often referred to problem is called polygon soup, typical to VRML, meaning that an object can be represented by any number of unconnected or unstructured poly-gons which may visually look ne as a whole, but are horrendous for processing. VRML has been superseded by X3D (Web 3D Consortium, 2004), an XML version of VRML. However, it does not yet have such widespread usage.
The OFF le format has been used by the Princeton Shape Benchmark data set (Shilane et al., 2004) to represent all the 3-D objects. It is a simple text based format storing only the vertex information for each object.
Chapter 2 Content-Based Retrieval Background 8
2.5 3-D Object Pre-Processing
The huge range of 3-D le formats, methods of object creation and user ability mean that the same object could be represented in many dierent ways but still be visually similar. Often some pre-processing of an object is required to bring it in line with other objects. Typically some processing would be required to transform all polygons into triangles, make sure the mesh is closed, make sure triangles connect to other triangles, x normals, redistribute vertices to give a uniform sampling. Typically, it would be expected that objects obtained from the World Wide Web (WWW) will require considerably more pre-processing than objects created from a 3-D acquisition system.
In order to be able to perform a good comparison between objects, they should be geometrically similar, in their scale, orientation and position. This is important for some descriptor schemes as almost identical objects with even a slight rotation between the two can have a large dierence in the resulting feature space. There are two main methods for achieving this. One is to build invariance into the descriptor itself (e.g. Saupe and Vrani¢, 2001), the other is to pre-process the model to transform it into a common reference frame (Vrani¢ et al., 2001; Paquet et al., 2000).
Typically, most descriptors require transforming an object into a canonical co-ordinate frame, i.e. to normalise the object. This is to ensure that a given object of an arbitrary scale, orientation and position will always produce an identical feature vector for an identical model with a dierent geometric transformation. Often a descriptor will not be invariant to all geometric transforms, only some of them.
2.5.1 Translation Invariance
Typically, an object is translated so it's centre of mass is at the origin of the co-ordinate system. Care needs to be taken for meshes with an uneven distribution of vertices as this can cause a bias in the centre point.
2.5.2 Rotation Invariance
Principal Components Analysis (PCA), also known as the Karhunen-Loeve or Hotelling transform, is a commonly used method to provide rotation invariance to an arbitrary 3-D object. As part of this process, translation invariance is usually applied to the object. PCA is more commonly used to reduce the dimensionality of feature vectors.
PCA is more commonly used to reduce the dimensionality of feature vectors. A 3x3 matrix, M, is calculated as M =X·XT where X is the set of all vertices in the mesh
Chapter 2 Content-Based Retrieval Background 9 matrix. This transforms the vertices in the mesh such that the greatest variation in vertex positions is along the x-axis. The y-axis points in the direction of greatest variation in
vertex position in theyz plane.
The problem with applying PCA to mesh data is that typically vertices are not uniformly distributed across the mesh. This can cause problems during the rotation stage as areas of higher vertex density will have a greater eect than areas of lower vertex density. Several researchers have tackled this problem and have come up with several dierent methods to provide a solution. Vrani¢ et al. (2001) weights each vertex against the surface area it represents, whilst Paquet and Rioux (1999b) use the centre of mass of the triangle as the input (instead of vertex position) weighted against the mass of the triangle. Ohbuchi et al. (2003a) use the point selected algorithm they modied from Osada et al. (2001) to provide a uniform distribution of points. An alternative method is to resample the object mesh to provide an even distribution of the vertices.
Sometimes PCA can align the object, but an axis can become ipped when the variance is equal in both directions along that axis. Körtgen et al. (2003) ips the object such that the heavier side of the object points along the positive direction on the axis. The heavier side is the side with the most triangles, or most mass.
2.5.3 Scaling Invariance
Typically, scale invariance is achieved by scaling the object so that the maximum extent of the object along one (isotropic) or all (anisotropic) axes is of unit length, or ts within a unit cube bounding box. The actual size does not matter particularly as long as it is consistent across all objects put through this stage.
2.5.4 Mesh Invariance
While not necessarily a pre-processing step, we mention mesh invariance here for com-pleteness. Depending on how a 3-D model was created for a given object, it could dier greatly in how the mesh is composed. Dierent models of the same object could vary in the number and types of polygons composing the mesh, the size of the polygons and to the degree of which the mesh approximates the object surface. Ideally, a 3-D descriptor will be able to overcome these dierences, but some techniques still require a helping hand.
Chapter 2 Content-Based Retrieval Background 10 The dierent shape descriptors described in the following section use a range of techniques to overcome this limitation. Paquet and Rioux (1999b) use the surface area of the triangle under consideration as a weighting factor. Vrani¢ et al. (2001) use a similar approach, however they weight the individual vertices rather than the triangle surface area. Osada et al. (2001) have developed a technique to pick random points on the surface of the object rather than a particular vertex or triangle.
With all of these techniques, there is still an element of variation as the mesh only approximates the surface of an object. Shape descriptors therefore need to be tolerant to variations in the surface between model representations.
2.6 3-D Algorithms
The majority of the work on 3-D model matching is based on nding similar shaped objects (Shilane et al., 2004; Tangelder and Veltkamp, 2004; Iyer et al., 2005). There have been some attempts at nding similarly coloured objects (Paquet and Rioux, 1999b) however this is not an area that has received much attention so far. The following provides an overview of a range of 3-D content-based descriptors.
The Area Volume Ratio descriptor, Cord Histograms, Shape Distributions, Modied Shape Distributions, Extended Gaussian Image, 3-D Hough Transform and the Aug-mented Multi-Resolution Reeb graph are used in the work presented in this thesis. These are the algorithms implemented within the SCULPTEUR project (see Chapter 4). The descriptions of the other algorithms are included for completeness.
2.6.1 Area Volume Ratio Descriptor
A simple geometric descriptor described by Tung and Schmitt (2004) is the ratio between surface area and volume of an object. Equation 2.1 shows the ratio in a dimensionless form. This is a single valued descriptor capturing only basic geometric properties, how-ever it is invariant to rotation, scale and translation transforms and relatively quick to compute.
ratio= Area 3
V olume2 (2.1)
Area= 1 2
N
X
i
|(Vi,1−Vi,0)×(Vi,2−Vi,0)| (2.2)
Chapter 2 Content-Based Retrieval Background 11
V olume= 1 6
N
X
i
(−Vi,x2Vi,y1Vi,z0+Vi,x1Vi,y2Vi,z0+Vi,x2Vi,y0Vi,z1
−Vi,x0Vi,y2Vi,z1−Vi,x1Vi,y0Vi,z2+Vi,x0Vi,y1Vi,z2) (2.3)
whereVi,ja is thex,yor z component (a) from the jth vertex (0, 1 or 2),V, of trianglei
(Zhang and Chen, 2001).
2.6.2 Cord Histograms
The Cord Histograms by Paquet and Rioux (1999b) dene an object in terms of cords. A cord is dened as the vector between the centre of mass of an object and a point on its surface. Three versions of the Cord Histogram are dened. The rst is a histogram of cord lengths. The second type is a feature vector containing two histograms; a histogram of angles between a cord and the rst principal axis, and a histogram of angles between a cord and the second principal axis. The third type is a bi-dimensional histogram indexed by angles between a cord and the rst principal axis along one dimension and angles between a cord and the second principal axis along the other dimension. The cord histograms are dened using the centre point of each face, weighted according to the relative surface area of the face. The histograms are rotation and translation independent. Normalisation for scale is required for the rst histogram type, however the other histograms are inherently invariant to scale. The Cord Histograms capture basic geometric information and so while relatively quick to compute, they will not be very discriminating.
2.6.3 Colour Descriptor
Chapter 2 Content-Based Retrieval Background 12 2.6.4 Shape Distributions
The Shape Distributions by Osada et al. (2001) are a collection of descriptors that capture distributions of various features of the shape of an object. The study performed by Osada et al. (2001) determined that the D2 variant resulting in a probability density function performed best overall. The D2 variant captures the distribution of the distances between pairs of random points on the surface of a 3-D object. This descriptor is invariant to translation and rotation transforms. It is also robust against changes in mesh resolution for a given object. It is however sensitive to changes in object scale and so requires normalisation for scale.
The dierent variations are:
A3 Measures the angle between three random points (A, B, C)on the surface of a 3-D
model. This is the angle between vectors −BA−→ and−BC−→.
D1 Measures the distance between a xed point (e.g. centroid) and a random point on the surface of the model. This is similar to Cord length in the rst Cord Histogram of Paquet and Rioux (1999b).
D2 Measures the distance between two random points on the surface.
D3 Measures the square root of the area of the triangle between three random points on the surface.
D4 Measures the cube root of the volume of the tetrahedron between four random points on the the surface.
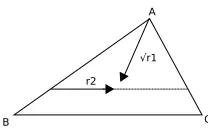
The point selection algorithm used is important as it treats an object as a surface instead of individual triangles. This provides invariance to mesh resolution in a way that can be applied to many dierent techniques. To select a point on the surface, a table of the cumulative triangle surface area is generated. A random number generator is used to obtain a cumulative area value which corresponds to a triangle in the table. Two random numbers,r1 andr2, are generated in the range [0.0, 1.0]. Equation 2.4 generates a point, P, on the triangle (A,B,C) surface given r1 and r2. As a global descriptor, the shape
distributions may not be able to capture the ner details of more complicated objects. Figure 2.2 helps illustrate this equation.
P = (1−√r1)A+
√
r1(1−r2)B+
√
Chapter 2 Content-Based Retrieval Background 13
Figure 2.2: Selecting a point on the surface of a triangle
2.6.5 Modied Shape Distribution
Based on the work on Shape Distributions by Osada et al. (2001), Ohbuchi et al. (2003a) proposes several descriptors based upon the Shape D2 descriptor. These are the modied Shape D2 (mD2), the Angle-Distance (AD) histogram and the Absolute-Angle Distance (AAD) histogram descriptors, the latter two additionally take into account surface ori-entation. These versions of the Shape D2 descriptor both calculate the distribution from all possible parings of points selected, using a quasi-random number sequence (QRNS) to select the inputs to the point selection algorithm, (r1 and r2), on the surface of the
triangle. This diers from a pseudo-random number sequence (PRNS) in that the QRNS produces more consistent feature vectors as the same points will always be selected for a given model.
Chapter 2 Content-Based Retrieval Background 14 median and mode. The maximum method splits the values between the maximum and the minimum distances into equally spaced intervals. The average method is similar, except the intervals above the average values can be of dierent spacing to those below the average. The median and mode methods are similar, except using the median and mode instead of the average respectively. While the mD2 is still very similar to the Shape D2 descriptor, the AD and AAD give better retrieval performance results.
2.6.6 Parameter Methods
Ohbuchi et al. (2002) developed a descriptor based on a parametrised approach. They reason that a collection of descriptors will perform better than any single descriptor. The descriptor is composed of three statistics applied to the three principal axes. These are moments of inertia about the axis, the average distance to surface points from the axis and the variance of the distance to the surface points from the axis. The Euclidean and elastic distance metrics are used for matching on the moments of inertia and the other statistics are used as a weighting factor if required. While the authors do not compare this descriptor against any others, they are keen to point out that this is a more general descriptor framework dependant upon the choice of statistics used.
The parametrisation splits an object into slices along each of the principal axis in turn. A sliding window is applied to all consecutive pairs of slices to allow for mis-alignment of the object during pose normalisation. The statistics are calculated on each window position. This results in nine vectors, one per statistic per axis, which are concatenated together into a single vector.
2.6.7 Multiple Orientation Depth Fourier Descriptor
Chapter 2 Content-Based Retrieval Background 15
(a) The Sector Model (b) The Shell Model
Figure 2.3: The Sector and Shell Models for the Shape Histograms
2.6.8 3-D Shape Histograms
The Shape Histograms by Ankerst et al. (1999) partition the space inside the bounding sphere of an object either with shells (concentric spheres), sectors (planar slices) or a combination of the two. The shell based approach records the distance between the centre of mass to points on the surface (see Figure 2.3 (b)). This is similar to the rst kind of cord histogram by Paquet and Rioux (1999b) and the Shape D1 descriptor by Osada et al. (2001). The sector based approach records the area of the model contained within each sector (see Figure 2.3 (a)). The shell model is rotation and translation invariant but requires normalisation for scale. The sector model is scale and translation invariant, however normalisation for rotation in Ankerst et al. (1999) use models represented by uniformly distributed points, such that the shells and sectors bins can be calculated by the number of points within the partitioned space. However the volume of the object contained within the space could also be used. These descriptors were evaluated by Shilane et al. (2004) and showed that the sector-shell model performed quite well, whilst the shell model performed worst out of the descriptors evaluated. The sector model gave better performance than the Shape D2, but still signicantly worse than the sector-shell model.
2.6.9 3-D Shape Contexts
Chapter 2 Content-Based Retrieval Background 16 projecting the principal axis onto the plane dened by the selected point and the rst axis (as if it was the normal to the plane).
Similarity calculation compares the features points on one object to the points on another object. Three features are described; The Shape Term compares the shape histograms of the two points. The Appearance Term measures the distance between the orientation of the two histograms. The Position Term measures the distance between the two points, using a function similar to the squared Euclidean distance. Finally, the three terms are combined using a a set of user or automatically dened weights. The results showed good retrieval results, however they were not compared against other descriptors.
2.6.10 Extent Descriptor
Heczko et al. (2001) introduced a simple shape descriptor that measures the extent of an object along a xed set of uniformly distributed vectors radiating from the centre of mass. It is referred to as the Extent Descriptor here, but it is sometimes referred to as the Radial Descriptor in the literature. In the case of multiple surface intersections along a vector, the furthest extent is used. Matching can then be performed by comparing the distance between corresponding vectors on dierent objects. This descriptor requires normalisation for scale and rotation invariance. The descriptor is sensitive to noise.
2.6.11 Spherical Harmonics
Further to the original extent descriptor, Vrani¢ et al. (2001) makes use of spherical harmonics to improve the robustness while representing the object with a few coecients in the spectral domain. Spherical harmonics allow any spherical function f(θ, φ) to be
decomposed into the sum of its harmonics;
f(θ, φ) = ∞ X
l=0
m=l
X
m=−l
ˆ
r(l, m)Ylm(θ, φ)
where Ym
l (θ, φ) is the spherical harmonic function and rˆ(l, m) is a weighting for the
Chapter 2 Content-Based Retrieval Background 17 2.6.12 Discrete Fourier Transform
In alternative work by Vrani¢ and Saupe (2001a), a voxel representation of an object is rst normalised for orientation and a discrete Fourier transform is applied to it. This represents the object in the frequency domain. It requires a suitably high degree of resolution for the voxelisation process in order to capture the ner details of the object. The Fourier transform provides a small number of co-ecients which compose the feature vector. For a octree of N3 cells, each coecientguvw can be calculated by Equation 2.5
whereqikl is a cell in the octree. Vrani¢ and Saupe (2001a) suggest a value of 128 for N
with values ofu,v and w in the range of [-3:3].
guvw =
1
√
N3 N
2−1 X
i=−N 2
N 2−1 X
k=−N 2
N 2−1 X
l=−N 2
qiklexp
−j2π
N (iu+kv+lw)
(2.5)
2.6.13 3-D Moments
3-D Moments are a popular type of descriptor that has received the attention of several researchers. Paquet and Rioux (1999a) calculate moments in terms of the centre of mass for all triangles with respect to the mass of the triangle (See Equation 2.6). Saupe and Vrani¢ (2001) calculate moments in terms of the extent of an object in a given direction with respect to the surface area of the object. In this case mi is the surface area of
triangleimultiplied by the distance from the centre of mass of the object. In both cases,
a normalisation step is required for rotation invariance. The 3-D moments usually have low retrieval performance, although this strongly depends upon the order used.
Mqrs= N
X
i=1
mi(xi−xcm)q(yi−ycm)r(zi−zcm)s (2.6)
whereq, r, s are the moments order, (xcm, ycm, zcm) is the centre of mass of the object,
mi is the mass of the triangle with a centre of mass atxi,yi andzi. N is the number of
triangles.
Saupe and Vrani¢ (2001) use1≤q+r+s≤m for m values ranging from 2 to 6.
2.6.14 Extended Gaussian Image
Chapter 2 Content-Based Retrieval Background 18 mesh based objects. For each triangle, the surface area is added to the histogram bin representing the direction of the surface normal. The Complex EGI (Kang and Ikeuchi, 1993) stores a complex number where the real component represents surface area and the phase component represents the distance of the surface from the origin.
2.6.15 3-D Hough Transform
Zaharia and Preteux have developed several successive versions the Hough Transform for use in 3-D. The original development (Zaharia and Prêteux, 2001b) produced the Optimised 3-D Hough Transform Descriptor (O3DHTD) then in later work (Zaharia and Prêteux, 2002) the Canonical 3D Hough Transform Descriptor (C3DHTD). The Hough Transform transforms an object into Hough Space; an accumulator which gathers evidence of how similar the query is to the reference. For each object, a look up table is generated to perform this mapping.
The 3-D Hough Transform requires calculating a Hough Transform (HT) from all possible orientations of thex,y andz axes from views down each axis, however this number can
be reduced by taking into account the fact that some pairs of orientation are equivalent, and that other views can be generated through a simple geometric transform. This culminated in the O3DHTD based on three views. The C3DHTD reduced this to a single HT by dening the object in such a way that all views become equivalent. The largest disadvantage of using a HT is that it requires a large amount of processing to provide a comparison as the computationally expensive part (populating the accumulator) cannot be pre-computed. It also requires normalisation for rotation, scale and translation. Similarity matching is performed by comparing the tables treated as histograms. The true Hough Transform method creates an accumulator that maps one object into another one and sees how well it matches. However, this is quite slow compared to matching just the histograms.
2.6.16 The 3-D Shape Spectrum Descriptor
Chapter 2 Content-Based Retrieval Background 19 sides) will be treated dierently. The 3DSSD is the descriptor used by MPEG-7 (see Section 2.7).
2.6.17 Light Field Descriptors
The Light Field Descriptors by Chen et al. (2003) convert the 3-D shape matching problem into a 2-D shape matching problem by generating 2-D silhouettes of the 3-D object at various camera positions and orientations. These 2-D silhouettes are compared by using a combination of 2-D shape matching techniques to determine the similarity. These are Zernike moments (Zhang and Lu, 2002b) and Fourier descriptors (Zhang and Lu, 2002a). A combined feature vector based on the moments and Fourier coecients is the result.
Similarity is performed by calculating the sum similarity of each image match. Images are matched by nding the orientation of images that gives the maximum similarity. This provides a degree rotation invariance.
Ten silhouettes were determined to be sucient to represent the whole 3-D object. The use of silhouettes exploits the fact that they are mirrored when the object is rotated by 180 degrees as twenty views would otherwise be required.
2.6.18 Reective Symmetry Descriptor
The Reective Symmetry descriptor by Kazhdan et al. (2002) is a descriptor that mea-sures the amount of symmetry (or not) in an object. In the 2-D case, it works by averaging an image against itself reected along a line of symmetry. The descriptor is dened for all planes that go through the centre of mass. To do this eciently, the fast Fourier Transform is used to calculate the symmetry. Extended to the 3-D case, slices or projections of a sphere are used to make into multiple 2-D problems. Visually, this is represented by deforming a unit sphere. Areas of higher symmetry cause the sphere to extend outwards, whereas areas of lower symmetry will not. Comparisons with the Shape Distributions of Osada et al. (2001), moments and random retrievals show that the reective symmetry descriptor performs signicantly better.
The 3-D object is converted to a voxel representation and decomposed into a series of concentric spheres. A Fourier Transform is then applied. The use of a FT dened on a sphere allows for rotation invariance.
2.6.19 Sphere Projection
Chapter 2 Content-Based Retrieval Background 20 sphere. Energy is proportional to the average distance between the pairs of points on the surface of the object and the corresponding points on the sphere that lie in the same direction with respect to centre of mass. The feature vector is composed of two parts. The rst part represents the minimal distances from the sphere to the object's surface. The second part represents the object's surface in terms of spherical coordinates.
2.6.20 Octree
An octree is the 3-D equivalent of a quad-tree (Ayala et al., 1985). It recursively decom-poses a bounded 3-D space into eight equally sized partitions. Typically this method is used to eciently store a voxel representation of a 3-D object. Each cell of an octree will either contain no voxels, be completely full of voxels, or it will be further partitioned into another eight cells. Leifman et al. (2003) use the octree as a descriptor by comparing the dierence in volume between corresponding tree nodes. The octree is translation and scale independent, however it requires normalisation for rotation.
2.6.21 Reeb Graphs
The Reeb graph represents the skeletal and topological structure of an object. This is represented in a graph of interconnected nodes based upon a suitable function. The most common function is the height function on a 2-D manifold. Hilaga et al. (2001) proposes a multi-resolution version that construct a Reeb graph at various resolutions by re-partitioning at each node. Tung and Schmitt (2004) takes this approach further and store geometrical attributes at each node on the graph. These features are the Cord histograms and colour statistics of Paquet and Rioux (1999b), local curvature as used in the 3-D Shape Spectrum Descriptor by Zaharia and Prêteux (2001a) and volume associated with the node. It is invariant to rotation and translation transforms.
2.6.22 Descriptor Summary
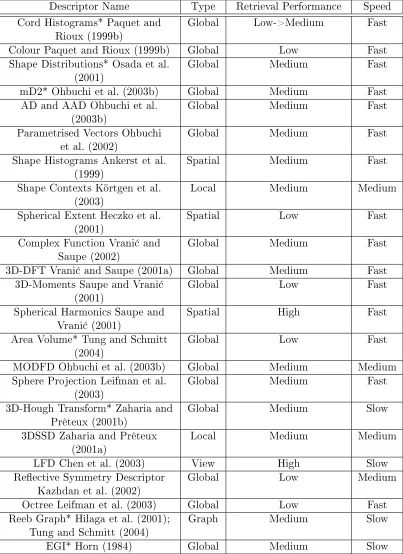
Chapter 2 Content-Based Retrieval Background 21
Descriptor Name Type Retrieval Performance Speed Cord Histograms* Paquet and
Rioux (1999b) Global Low->Medium Fast Colour Paquet and Rioux (1999b) Global Low Fast Shape Distributions* Osada et al.
(2001) Global Medium Fast
mD2* Ohbuchi et al. (2003b) Global Medium Fast AD and AAD Ohbuchi et al.
(2003b) Global Medium Fast
Parametrised Vectors Ohbuchi
et al. (2002) Global Medium Fast
Shape Histograms Ankerst et al.
(1999) Spatial Medium Fast
Shape Contexts Körtgen et al.
(2003) Local Medium Medium
Spherical Extent Heczko et al.
(2001) Spatial Low Fast
Complex Function Vrani¢ and
Saupe (2002) Global Medium Fast
3D-DFT Vrani¢ and Saupe (2001a) Global Medium Fast 3D-Moments Saupe and Vrani¢
(2001) Global Low Fast
Spherical Harmonics Saupe and
Vrani¢ (2001) Spatial High Fast
Area Volume* Tung and Schmitt
(2004) Global Low Fast
MODFD Ohbuchi et al. (2003b) Global Medium Medium Sphere Projection Leifman et al.
(2003) Global Medium Fast
3D-Hough Transform* Zaharia and
Prêteux (2001b) Global Medium Slow
3DSSD Zaharia and Prêteux
(2001a) Local Medium Medium
LFD Chen et al. (2003) View High Slow
Reective Symmetry Descriptor
Kazhdan et al. (2002) Global Low Medium
Octree Leifman et al. (2003) Global Low Fast Reeb Graph* Hilaga et al. (2001);
Tung and Schmitt (2004) Graph Medium Slow
[image:33.596.116.519.136.690.2]EGI* Horn (1984) Global Medium Slow
Chapter 2 Content-Based Retrieval Background 22 more complex feature vectors and have much greater computational requirements. Gen-eration speed is much slower by comparison, however it is less important and genGen-eration of features can typically be done oine.
2.7 MPEG-7
MPEG-7 (Martínez, 2004) is a content description specication. It is known as Multime-dia Content Description Interface and it provides a framework for describing multimeMultime-dia content. It has three main elements. The descriptor, D, the description scheme, DS and the description denition language, DDL, dened in XML.
The descriptor is the feature representation. The description scheme species the struc-ture of the descriptor(s) and the relationship between them. The DDL is the language used to specify the description scheme.
2.8 Distance Metrics
In order to establish the similarity (closeness) of two feature vectors in some feature space, a wide range of distance metrics have been presented in the literature.
A distance metric calculates the distance between two point sets in metric space. A distance metric satises the following properties (Iyer et al., 2005);
• d(x,y)≥0 (positivity),
• d(x,y) = 0 i x=y (identity),
• d(x,y) =d(y,x) (symmetry),
• d(x,y) +d(y,x)≥d(x,z)(triangle inequality).
whered(x,y) is the distance between a vectorxand a vectory.
Chapter 2 Content-Based Retrieval Background 23
• Minkowski Norms
The most commonly used metrics are the Minkowski norms (Equation 2.7). Typically theL1norm (the city-block distance) and theL2norm (the Euclidean distance) are used.
d(x,y) =
N
X
i=1
|xi−yi|L
!1/L
(2.7)
whereLis the degree of the norm and N is the number of elements in the vectors. The
norms are popular not only due to their simplicity and speed of calculation, but to the quality of results obtained given their simplicity.
• Histogram Intersection
The histogram intersection (Hetzel et al., 2001) (Equation 2.8) is another simple distance metric that is often used. For histograms normalised so that the sum of the bins is one, the distance is calculated as one minus the sum of the minimum values of corresponding bins between two histograms.
d(x,y) = 1−
N
X
i=1
min(xi, yi) (2.8)
• Chi Squared
Theχ2(chi squared) distance (Hetzel et al., 2001) (Equation 2.9 for comparing unknown
distributions) is based on theχ2 statistical test, however, the nal score is not required
for a distance calculation, only theχ2-divergence.
d(x,y) =
N
X
i=1
(xi−yi)2
xi+yi (2.9)
• Bhattacharyya Distance
Other distance metrics include the Bhattacharyya distance (Thacker et al., 1997) (Equa-tion 2.10 and 2.11), a statistical measure often used for comparing two probability density functions,
d(x,y) =
N
X
i=1
√
xi
√
Chapter 2 Content-Based Retrieval Background 24
d(x,y) =−log
N X i=1 √ xi √
yi (2.11)
• Kullback-Leibler
The Kullback-Leibler distance (Hetzel et al., 2001) is another measure often used for comparing probability density functions. See Equation 2.12 for the symmetrical version (also known as the Jerey's Divergence) and Equation 2.13 for the non-symmetric version (this is not strictly a distance metric although its often used) where ln is the natural
logarithm and log2is logarithm to the base of 2.
d(x,y) =
N
X
i=1
(xi−yi) ln
xi
yi (2.12)
d(x,y) =
N
X
i=1 xilog2
xi
yi
(2.13)
• Earth Mover's Distance
The Earth Mover's distance (Rubner et al., 1998) (Equation 2.14),
d(x,y) = P
iı
P
j
cijfij
P
j
yj (2.14)
where cij is the distance between two points, and fij is the set of ows that minimises
the cost ofP
iı
P
j
cijfij subject to the following conditions:
fij ≥0 i∈I, j ∈J
P
i∈Ifij =yi j ∈J
P
j∈Jfij ≤xi i∈I
whereI is the set of indicies into vectorxand J is the set of indicies into vectory.
• Mahalanobis Distance
The Mahalanobis distance (Bishop, 1997a) (Equation 2.15),
Chapter 2 Content-Based Retrieval Background 25 where C is the covariance matrix. The Hausdor distance (Huttenlocher et al., 1993)
(Equation 2.16) is unique in regard to the other metrics listed here in that it does not require x and y to have the same number of elements. It compares points sets rather
than vector to vector.
• Hausdor Distance
The Hausdor distance is recommended by Vrani¢ and Saupe (2001b) as the distance metric to use when comparing structures such as an octree.
d(x,y) = max
xX
min
yY {d(x, y)}
(2.16)
The quadratic distance (Ankerst et al., 1999) (Equation 2.17);
dA(x,y) =
q
(x−y)·A·(x−y)T (2.17)
whereAis the similarity matrix. The components ofA, are calculated byaij =e−σ·d(i,j)
whered(i, j)is a distance function between the ith and jth component of xand y. The
quadratic distance is a generalised case of the Euclidean distance which attempts to take into account the similarity or correlation between histogram bins.
• Quadratic Distance
The quadratic distance allows small variations in the histograms. E.g. due to numerical precision, a particular value may end up in one bin, or in the one next to it. According to Ankerst et al. (1999) varyingσ had little signicant eect on performance.
The choice of distance metric to use greatly depends upon application. For general usage, the Minkowski norms will often suce, for applications where speed is preferred over accuracy, the L1 norm or histogram intersection can be used. For applications
where the dierent components cannot be assumed to be independent, a metric such as the Mahalanobis distance may be preferable.
2.9 Evaluation Techniques
Chapter 2 Content-Based Retrieval Background 26 The Precision and Recall graphs, E-Measure, Nearest-Neighbour, First and Second Tier, DCG, and the Distance and Tier Images are all provided as part of the Princeton Shape Benchmark tools.
• Precision and Recall
The precision-recall graph is a commonly used method of evaluating the quality of a descriptor. Precision is dened as the proportion of relevant results out of the results returned (Equation 2.18). Recall is dened as the proportion of relevant results returned out of all the possible relevant results (Equation 2.19). Typically, one would expect that as recall increases, precision decreases.
P recision= #Relevant Items Returned
#All Items Returned (2.18)
Recall= #Relevant Item Returned
#All Relevant Items (2.19)
The basic precision-recall graph (showing precision against recall as the size of the re-turned set increases) is sometimes considered inadequate and the work by Huijsmans and Sebe (2001) suggests adding the precision-recall curve for a random retrieval and to take into account generality (the size of the class compared to the size of the database).
• Fallout
Related to these is fallout. Fallout is what is leftover, it is the proportion of irrelevant results out of the results returned.
F allout= 1−P recision (2.20)
• Mean Average Precision
Another performance metric gaining attention is Mean Average Precision (MAP). MAP is the average precision of all relevant items returned. In Equation 2.21 the precision for each returned document, r, is calculated. The function Relevance returns 1 if the
document is relevant, 0 otherwise. This results in the sum precision of relevant documents from the topN returned documents over all possible relevant documents.
M AP =
PN
r=1P recision(r)Relevance(r)
Chapter 2 Content-Based Retrieval Background 27
• The E-Measure
The E-Measure (Shilane et al., 2004) is one of several such criteria that combines preci-sion (P) and recall (R) into a single value (See Equation 2.23). However Järvelin and
Kekäläinen (2000) quotes this as the F-Measure, and the E-Measure as Equation 2.22.
Ja¨rvelin's E = b
2P R+P R
b2P+R (2.22)
Shilane's E= 1 2
P +
1
R
(2.23)
• Borko and Vickery Methods
Wherebis a constant term, often 1. Other measures include the Borko (van Rijsbergen,
1975) method (simply B=P+R−1) and the Vickery measure (van Rijsbergen, 1975)
(Equation 2.24).
V = 1− 1
2 P1
+ 2 R1
−3 (2.24)
• Nearest Neighbour
The nearest neighbour criterion is the percentage of objects for which the nearest object is of the same class.
• First and Second Tier
The rst and second tier criteria are the percentage of the rstK elements that are of
the same class, where K, for the rst tier, is the size of the class. The second tier uses K as twice the size of the class. More specically for a class C, K = |C| −1 for the
rst tier and K = 2∗(|C| −1) for the second tier where |C| is the size of class C (−1
to ignore the query object). The second tier is also known as the Bull-Eye percentage (Zaharia and Prêteux, 2001a).
• Discounted Cumulative Gain
The Discounted Cumulative Gain (DCG) is a measure that weights correct results re-turned earlier higher than those rere-turned later within a ranked list. It is dened recur-sively in Equation 2.25 whereGis a vector andGi corresponds to the ith element in the
Chapter 2 Content-Based Retrieval Background 28
DCGi=
(
Gi, i= 1
DCGi−1+Gi/lg2i, otherwise
(2.25)
For example, G can be h1,0,1,1,1,0i which results in 1 + lg0 22+
1
lg23 + 1
lg24 + 1
lg25 + 0
lg26 =2.56. The DCG is then normalised into the range 0.0 to 1.0 by dividing the result
by the value computed if G was a vector of ones. In the example above, this would yield 0.649.
• Distance and Tier Images
Two other visual techniques are available the distance image and the tier image (Shilane et al., 2004). In both cases, an image is generated showing a matrix that compares each object against every other object and groups object according to class. This makes it easy to see class and inter-class relations. The distance image shows the distance or similarity between objects. Black pixels mark very similar objects, white pixels mark very dissimilar objects with grey values representing intermediate distances. Ideally each class would be a black box on the diagonal, and white otherwise indicating that objects in the same class were very similar, and other objects were very dissimilar. Black boxes between other classes indicate similarities between those classes.
The tier image is perhaps more useful than the distance image and shows nearest neigh-bour, rst tier and second tier scores. The images are much clearer as they show the best matches for each model and ignore the other matches. This image shows the nearest neighbour (black) and the rst (red) and second tier (blue) results for each object in the data set. White pixels mean objects are very dissimilar. The image diagonal should be black indicating that each object is matched best by itself. If the diagonal is not fully coloured with nearest-neighbour matches then this indicates a possible problem with the algorithm. Ideally all the coloured pixels would be within the class boundaries along the diagonal.
2.10 3-D Data sets
Chapter 2 Content-Based Retrieval Background 29 group and contains a large range of classes (161). The Viewpoint data set (Funkhouser et al., 2003) is the next largest data set, however it is not publicly available. There are several 3-D object repositories available on the World Wide Web such as (3D Cafe, No Year) containing a wide range of models. However these are not designed or intended as a benchmark data set and typically lack classication details, or contain only general indications of what the model is. Many of the web repositories are commercial entities with some sample objects free for use.
The PSB classication was manually created by partitioning a larger data set down to atomic concepts such as human and airplane. Further partitioning was done on geometric aspects such as human_arms_out. Any classes with less than four objects were removed from the data set (Shilane et al., 2004).
2.11 3-D Search Engines
There are numerous 3-D search engines available on the web. Typically these are the test systems documented in the literature (E.g. Tzovaras and Daras, 2004; Ansary et al., No Year; Suzuki, No Year; Corney, No Year; Antini, No Year; Funkhouser et al., No Year; Vrani¢, No Year). There are few production systems available. Typically these engines contain a xed data set and only oer searching based on items already in the data set. Many engines oer several data sets. Typically, these are a custom data set and often the Princeton data set is also available. Some of the engines (such as CCCC and Princeton) allow the user to upload a query object and the Princeton system has a 2-D and 3-D sketch interface. Some of these engines allow searching using a number of dierent algorithms, but some only allow a single algorithm.
Typically all these engines only allow 3-D content-based searching. Princeton for example also allow a free text search on keywords when combined with a 2-D or 3-D sketch, but not when uploading a custom object.
2.12 Summary
Chapter 3
Classication Background
3.1 Introduction
Classication is the act of forming a distribution into groups or classes according to some common criteria. This chapter begins with some terms and denitions related to classication. A similar topic is called regression which returns a real valued output rather than a class label. This topic is not within the scope of this thesis.
Generalisation
Generalisation is the ability for a classier to correctly classify examples that it has not seen before. Typically generalisation is evaluated by setting aside some of the data set used to train a classier for use as a test set later on.
Inputs, Outputs and Targets
Every classier takes a set of input patterns and produces one or more outputs. Inputs can be anything from the values in a descriptor to items of metadata. Typically, input data needs to be continuous (each input will usually need to be between 0.0 and 1.0). A technique to convert discrete data to continuous data called one-of-N encoding is described later. The outputs are what the classier decides the inputs represent, i.e. the class or label that the inputs belong to. Targets are the correct classications for the input data. During the supervised learning (see below) of a classier, they are used to calculate the error of the classier and the results are fed back into the learning algorithm.