A STATISTICAL MODEL FOR DETERMINING FRICTION AND WEAR OF SK11 IN ENGINE OIL
NOR HIDAYU BINTI MOHD ARIF
A STATISTICAL MODEL FOR DETERIMINING FRICTION AND WEAR OF SK 11 IN ENGINE OIL
NOR HIDAYU BINTI MOHD ARIF
This report is submitted
in fulfillment of the requirement for the degree of Bachelor of Mechanical Engineering (Automotive)
Faculty of Mechanical Engineering
UNIVERSITI TEKNIKAL MALAYSIA MELAKA
ii
DECLARATION
I declare that this project report entitled “A Statistical Model for Detremining Friction and Wear of SK11 Ball Bearing in Engine Oil” is the result of my own work except as cited in the references.
iii APPROVAL
I hereby declare that I have read this project report and in my opinion this report is sufficient in terms of scope and quality for the award of the degree of Bachelor of Mechanical Engineering (Automotive).
iv
DEDICATION
v ABSTRACT
vi ABSTRAK
Dalam projek ini, terdapat beberapa kaedah dan alatan yang digunakan semasa
menjalankan eksperimen. Pertama, ia terdiri daripada balan pelincir seperti minyak engine
jenidd SAE 15W-40 dan bola SK11. Daripada bahan-bahan ini, terdapat beberapa
parameter yang perlu diikuti sebelum menjalankan eksperimen. Yang kedua, eksperimen ini
dijalankan mengunakan mesin Four-Ball. Beberapa parameter perlu di set pasa mesin
sebelum menjalan eksperimen seperti nilai beban, kelajuan dan suhu. Nilai geseran dan
kadar calar bola yang dihasilkan akan digunakan sebagai data hasil dari eksperimen ini.
Seterusnya, hasil tersebut akan dianalisi ke dalam nisbah S/N dan ANOVA dengan
mengunakan kaedah Taguchi untuk mendapatkan model statistic yang sepatutnya. Merujuk pada analisis, optimum parameter untuk kadar calar pada bola dan kadar geseran telah
ditentukan. Melihat dari kedua-dua nilai tersebut, data yang didapati untuk kedua-dua
vii
ACKNOWLEDGEMENT
I would like to express my deepest appreciation to my supervisor, Prof. Madya. Dr Mohd Fadzli bin Abdollah for giving me this opportunity to do final year project with him. He never hesitated to give me advice and guidance whenever I confronted problems. I am thankful for his patience and advice while leading me in this project.
Secondly, I would like to thank a seniors for spending their time to guide me. They would share their knowledge in the field of tribology with me and guide me to do experiment. Also, I would like to thank laboratory assistant for his kindness in suggesting me the suitable time to use laboratory equipment for his action saved me a lot of time.
viii
TABLE OF CONTENTS
CHAPTER CONTENT PAGE
DECLARATION ii
APPROVAL iii
DEDICATION iv
ABSTRACT v
ACKNOWLEDGEMENT vii
TABLE OF CONTENTS viii
LIST OF FIGURE x
LIST OF TABLE xii
LIST OF ABBREVIATIONS xiii
CHAPTER 1 INTRODUCTION
1.1 Overview 1
1.2 Problem Statement 2
1.3 Objective of project 2
1.4 Scope of Project 2
CHAPTER 2 LITERATURE REVIEW
2.1 Lubricants Regimes 3
2.2 Lubricant Coefficient of Friction 4
2.3 Wear Testing 7
2.4 Optimization Parameters 11
CHAPTER 3 METHODOLOGY
3.1 Introduction 16
3.2 Design of Parameter 18
3.3 Preparing of sample 19
3.4 Tribology Test 20
ix
3.4.2 Wear Scar Diameter Experiment 21 3.5 Analysis and Purposed Solution 22 3.5.1 Coefficient of Friction and Wear Scar Diameter 22 3.5.2 Signal to Ratio (S/N) Analysis 23 3.5.3 Analysis of Variance (ANOVA) 24
CHAPTER 4 RESULT AND ANALYSIS
4.1 Result for analysis of coefficient of friction 25 4.1.1 Signal to noise (S/N) analysis of COF 25 4.1.2 Analysis of variance (ANOVA) of COF 28 4.1.3 Multiple linear regression model of COF 30 4.2 Result for analysis of wear rate 30 4.2.1 Signal to noise (S/N) analysis of wear rate 30 4.2.2 Analysis of variance (ANOVA) for wear rate 35 4.2.3 Multiple linear regression model of wear rate 36
4.3 Confirmation test 37
CHAPTER 5 CONCLUSION AND RECOMMENDATION 38
x
LIST OF FIGURE
FIGURE TITLE PAGE 2.1 Stribeck Curve Showing Three Lubrication Regimes 4 2.2 The Friction Coefficient and Contact Resistance Curve for the Specific
Test Method 5
2.3 The Friction of Coefficient and Contact Resistance curves for the Standard Test Method. 5 2.4 The Load vs Friction curve of 4 oil. 6 2.5 Effect of temperature on coefficient of friction for Jatropha and hydraulic oil 7 2.6 Specific Speed Method Sear Scar Result 8
2.7 Standard Test Method Wear Scar Result. 8
2.8 Bottom (left) and top (right) ball bearing from low-wear test using engine 9 2.9 Bottom (left) and top (right) ball bearing from high-wear test using engine oil. 9 2.10 Wear scar on the balls specimen with different temperature 10
2.11 Wear scar on the balls specimens at different load 10
2.12 Effect of speed on wear scar diameter
11
2.13 S/N ratio for gasoline 12
3.1 Flow Chart of the General Project. 17
3.2 Schematic Diagram for Four Ball Tester 21
3.3 Schematic diagram for Inverted microscope 22
4.1 S/N ratios for Coefficient of Friction. 28
xi
4.3 S/N ratio for wear rate 33
4.4 wear diameter (a) 100N, 100rpm, 27°C (b) 100N, 300rpm, 50°C
(c) 100N, 500rpm, 100°C (d) 300N, 100rpm, 50°C
(e) 300N, 300rpm, 100°C (f) 300N, 500rpm, 27°C
(g) 500N, 100rpm, 100°C (h) 500N, 300rpm, 27°C
(i) 500N, 500rpm, 50°C 34
xii
LIST OF TABLE
TABLE TITLE PAGE
2.1 Design parameters at three different levels. 13
2.2 Taguchi L9 (33) orthogonal arrays 14
3.1 Design parameters at three different level 18
3.2 Taguchi L9 (33) orthogonal array. 19
4.1 Experimental lay out and results with calculated S/N ratios for
coefficient of friction of SK11 26
4.2 S/N responses table for coefficient of friction of SK11 27
4.3 The ANOVA for the coefficient friction loss 29 4.4 Result with calculated S/N ratio for wear rate 31
4.5 S/N responses table for wear rate of SK11 32
4.6 The ANOVA for wear rate 35
xiii
LIST OF ABBREVIATIONS
DOE Design of Parameters
ANOVA Analysis of Variance
OA Orthogonal Array
WSD Wear Scar Diameter
SK11 Carbon Chrome Steel
S/N Signal to Noise
1 CHAPTER 1 INTRODUCTION
1.1 OVERVIEW
The focus for the project is about wear and friction. Lubricant are usually liquid, solid and gases or any combination of solids, liquids and gases. Lubrication used in an engine is important to separate surfaces in relative movement, flushing away particles, cooling the engine and reducing wear and friction. In order to reduce wear and friction, lubrication oil will be the main issued. Lubricant usually consists of two main components which are 90% base oil and 10% additives. Besides, consumption of lubricant oil increase with 1.5 % to 2% annually, thus by eliminating or reducing them is now impossible (Golshokouh, et al, 2014).In other hand, lubricants are an integral part of industrial application and in automobile engine.
Wear is a surface damage that occur due to the removal of material during sliding contact of two surfaces. Wear can occur as a result of several mechanism which includes abrasion and adhesion (Les Girard, et al, 2015). (Girard. L. et al) run a wear test that show the scar size of bearing lubricated with engine oil was a lot smaller compared with the scar size of bearing lubricated with mineral oil.
2
1.2 PROBLEM STATEMENT
Friction and wear are the important aspect in the engine oil performance. Existing engine oil is only at high temperature, speed and load. So, in this project low value of load, speed and temperature with engine oil will be test to improve the performance of engine right after engine start up. Hence, Taguchi method is the method that will be used while doing the research because of the variance reduction for the experiment with optimum setting of control parameters.
1.3 OBJECTIVE OF PROJECT
The objectives of this project are as follows:
i. To define the optimal parameters for friction and wear reduction of SK 11 ball bearing in engine oil type of SAE 15W-40.
ii. To determine statistical model for friction and wear of SK 11 ball bearing in engine oil using L9 Taguchi orthogonal arrays method.
1.4 SCOPE OF PROJECT
This research is carried out to study the prediction for friction and wear of SK11 in engine oil. The Four-Ball Tester experiment will be conducting for this research. The design of experiment under Taguchi method will be uses to set up the parameter for this research by using Minitab software. The parameter that are going to be used in this experiment are load, speed and temperature. The analysis of variance (ANOVA) and S/N ratio is used to analyse the friction and wear of SK11 ball bearing in engine oil.
3
CHAPTER 2
LITERATURE REVIEW
2.1 LUBRICANT REGIMES
Based on the friction experiment of bearing, Stribeck curve will expressed which part that the lubricant occurs. In the diagram, friction coefficient, f plotted as a function of the
Stribeck number, ƞU/P where ƞ is the dynamic viscosity of the oil, U is the relative speed between lubricated surfaces and P is pressure or load between the surfaces. Lubricating friction are divided into three regimes such as boundary, mixed or elastohydrodynamic and hydrodynamic lubrication.
𝑙𝑢𝑏𝑟𝑖𝑐𝑎𝑛𝑡 𝑟𝑒𝑔𝑖𝑚𝑒𝑠 ≡
𝑠𝑞𝑢𝑒𝑒𝑧𝑒𝑑 𝑓𝑖𝑙𝑚 𝑡ℎ𝑖𝑐𝑘𝑛𝑒𝑠𝑠,ℎ𝑎𝑣𝑒𝑟𝑎𝑔𝑒 𝑠𝑢𝑟𝑓𝑎𝑐𝑒 𝑟𝑜𝑢𝑔ℎ𝑛𝑒𝑠𝑠,𝑅𝑎
(1)
From the equation (1) (Les Girard, et al, 2015), if ℎ < 𝑅𝑎, the direct contact occurs between
high asperities of bearing surfaces. This lubricant called boundary lubrication and the regime will result in high friction and high wear. At this regimes, the friction coefficient is a constant and relatively large value of approximately 0.1 (Coy, 1998). Mixed lubrication where ℎ ≈ 𝑅𝑎 is characterized of intermittent contact between sliding surfaces at moderates speed and
loads. During the mixed lubrication, the friction coefficient drops drastically to a minimum on the order of 0.001 to 0.002. The majority of the normal load between surfaces are supported by the pressurized lubricant and only a few sharp surfaces are brought into contact (Les Girard, et al, 2015). Last lubricant regimes is hydrodynamic lubrication where ℎ ≫ 𝑅𝑎.
4
[image:18.595.194.454.118.299.2]These three lubrication regimes can be visualized in the Stribeck curve as shown in figure 2.1.
Figure 2.1: Stribeck curve showing three lubrication regimes. (Les Girard, et al, 2015)
2.2 LUBRICANT COEFFICIENT FRICTION
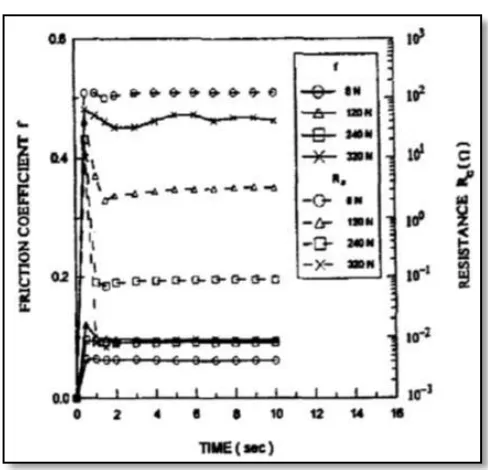
Determination of lubricants friction coefficient is a kind of oiliness test in the friction and wear test. Based on the changing of experimental parameters, contact
resistance curves can be obtained. From the specific test method, the relationship between the friction coefficient and the contact resistance show that the friction coefficient increase rapidly with time to a saturated value. Generally, the value of contact resistance decreases with increasing normal load, but the friction coefficient increase as the normal load
increase. Then, for standard test method it shown that the start of the test contact resistance quickly increase to a maximum value. It is because the initial lubricant condition between sliding and stationary ball is one of direct contact, so the contact resistance will present at lower value at the beginning of the test (Kuo, Chiou, & Lee, 1996). The different of both test are shown in Figure 2.2 and Figure 2.3.
5
Figure 2.2: The Friction Coefficient and Contact Resistance Curve for the Specific Test Method. (Kuo et al., 1996)
Figure 2.3: The Friction of Coefficient and Contact Resistance curves for the Standard Test Method. (Kuo et al., 1996)
[image:19.595.202.446.382.617.2]
6
In the past, there are only determining lubricant friction coefficient at certain load and cycles by using oiliness testing machine and Falex Ring-Block Test Machine. As the result, the differential ability of those test is very limited. It only provide the result for certain load condition.
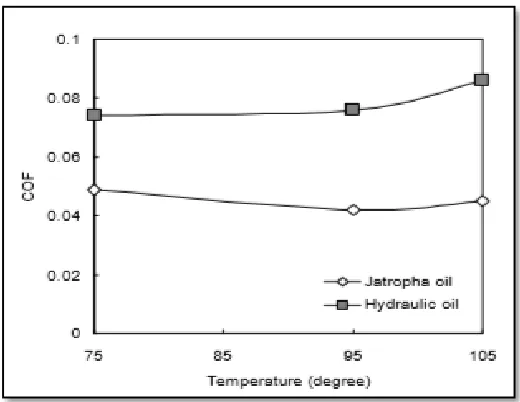
From the graph above, it shown that friction coefficient tends to decrease as the load is increase. It show the better improvement of friction reduction and the test state in boundary lubrication. If the friction coefficient is between 0.05-0.1, it is occur in boundary lubricating state. As a result, it can reduce friction coefficient, decrease wear rate, increase load-carrying capacity and improve boundary lubricating effect (Jiyuan, Quan, & Lixia, 2001). According to Figure 2.5, there are no significant changes show in coefficient of friction of Jatropha oil and hydraulic with increasing of temperature (Golshokouh et al., 2014).
[image:20.595.97.551.190.341.2]
Figure 2.4: The load vs friction curve of 4 oil. (Jiyuan et al., 2001) Mobil HD 80w/90 Mobil - 632 - 3
7
Figure 2.5: Effect of temperature on coefficient of friction for Jatropha and hydraulic oil. (Golshokouh et al., 2014).
2.3 WEAR TESTING
Wear is defined as surface damaged due to the removal of material during contact between two surfaces. The process of wears can be analysed in term of four mechanism which is adhesion, abrasion, tribo-fatigue and tribo-chemical reaction. In case of
relationship between wear scar diameter and contact resistance, the specific speed method has larger contact resistance than the standard test method because it possess a better initial lubricant conditions. Based on the test between specific speed method and standard test method, it shown that there are no wear scars occurs at the contact surface under light load. But, small wear scar occurs in standard test method under same operation. It is believed that standard test method are mainly caused the wear scar occurs by initial direct contact (Kuo et al., 1996). The result as shown in the Figure 2.6 and Figure 2.7. In general, the higher the value of wear scar diameter, the more severe the wear (Kapsiz, Durat, & Ficici, 2011).
8
[image:22.595.218.382.299.485.2]Figure 2.6: Specific Speed Method Sear Scar Result.(Kuo et al., 1996)
Figure 2.7: Standard Test Method Wear Scar Result.(Kuo et al., 1996)
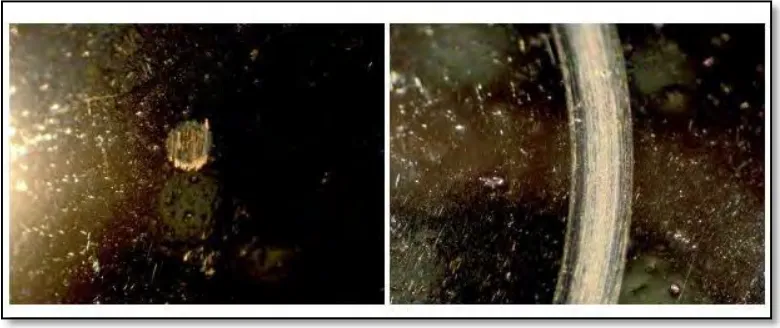
Wear testing is important in engineering from two aspect. Firstly, from a material aspect which is it important to understand the wear properties of material in order to determine whether it suitable to use or not. Secondly, this testing also used to review surface treatment and conditions in order to find the most optimized setup. As a result, wear will occurs in several mechanism, including abrasion and adhesion. Abrasion is the removal of surface material, while adhesion is another mechanism of wear which is result in the transfer of material from surface to another. Based on the test with lubricant type and normal load, the diameter of surface scar in the high-wear test are larger than low-wear test as shown in Figure 2.7 and Figure 2.8. This improved that the higher load correspond to bigger wear (Les Girard, Naomi Kibrya, 2015).
9
[image:23.595.128.521.342.491.2]Figure 2.8: Bottom (left) and top (right) ball bearing from low-wear test using engine oil. (Les Girard, Naomi Kibrya, 2015)
Figure 2.9: Bottom (left) and top (right) ball bearing from high wear test using engine oil. (Les Girard, Naomi Kibrya, 2015)
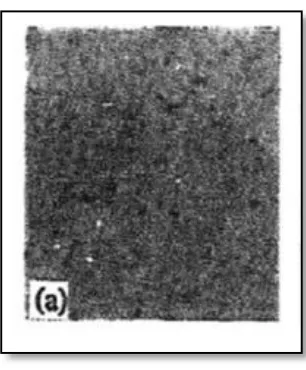
Based on effect of temperature and normal load, it shown that wear scar on the ball surface increase with increasing the temperature. Same way to the normal load, where the wear scar has direct relationship with the increase of loads (Syahrullail, et al, 2013). An experiment was carried to improve the result. Figure 2.10 shows the wear scar on ball specimen at different temperature while Figure 2.11 shows the wear scar on ball specimen with different load.
10
Figure 2.10: Wear scar on the balls specimen with different temperature (Syahrullail et al., 2013)
Figure 2.11: Wear scar on the balls specimens at different load.(Syahrullail et al., 2013)
These figure shown the ball surface at temperature 75°C is covered with small pits where it appear due to material transfer between contact parts. Also, from the figure for normal load 300N, several micro cutting observed on the balls. Micro cutting appeared when the adhesive wear occurs between surfaces and the lubricating film was broken down. In term of rotational speed, it showed that the wear scar diameter increase as the rotating speed increases. It is shown in the Figure 2.12. It is observed that higher speed will cause the higher wear scar diameter. The increased wear with increase of speed may be related to the generation of higher heat between the contact surface as a consequence of higher speed (Fazal, Haseeb, & Masjuki, 2013)
(a) 300N
( b ) 400 N
(c) 500N (
a P
27°C
[image:24.595.87.533.287.410.2]