Methane emissions and mitigation technologies in cattle, sheep and red deer : a thesis presented in partial fulfilment of the requirements for the degree of Doctor of Philosophy in Animal Science at Massey University, Palmerston North, New Zealand
245
0
0
Full text
(2) Methane emissions and mitigation technologies in cattle, sheep and red deer. A thesis presented in partial fulfilment of the requirements for the degree of. Doctor of Philosophy in Animal Science. At Massey University, Palmerston North, New Zealand. Natasha Madeleine Swainson 2011.
(3) ABSTRACT Enteric fermentation of ingested feed by ruminant livestock is an important source of methane (CH4), a potent greenhouse gas (GHG).. Ruminant CH4 emissions. contribute approximately 31% of New Zealand’s total GHG inventory; therefore reducing CH4 emissions from ruminant livestock is a national priority. The aims of this research were to investigate the effectiveness of potential mitigation technologies on the CH4 emissions in sheep. This included the supplementation of monensin and coconut oil, individually or in combination, and the feeding of chicory as an alternative forage to perennial ryegrass-based pasture (pasture). The influence of ruminant age (grazing red deer) and ruminant species (housed cattle, sheep and red deer) on CH4 yield were also explored. This research showed that the supplementation of monensin to sheep may provide reductions in CH4 yield (g CH4/kg dry matter intake, DMI) of up to 30%, but this was not consistent between experiments. Sheep fed chicory yielded less CH4 (17%) compared with sheep fed pasture, which was suggested to be due to faster degradation rates of chicory, leading to the increased outflow rate of digesta from the rumen; this theory needs to be tested. Neither, the supplementation of coconut oil or the combination of mitigation technologies resulted in a significant reduction in CH4 yield. Nevertheless, as the power to detect a significant difference between treatments was reduced, due to the high variability of estimated CH4 production, it is recommended that the effects of combined mitigation technologies be retested. Methane yield was influenced by deer age, but only at 4.5 months of age as CH 4 yields of deer aged 6.5 to 11.5 months did not differ and may be an artefact of the method used to estimate DMI. Mean differences of CH4 yield (up to 32%) between ruminant species was found when animals were offered the same diet and constant feeding levels; cattle > sheep > deer. This study indicates that the use of a single ruminant species to model potential CH4 mitigation technologies may not represent all target populations due to differences of age or species found in this study. Research is required to confirm if differences between ruminant species persist when animals are fed fresh forages and to determine if responses to potential mitigation technologies are similar with age or between ruminant species.. i.
(4) ii.
(5) ACKNOWLEDGEMENTS I would like to express my gratitude and thanks to all those that have helped me, for without them this thesis would not have been possible. The process of a PhD is always so much more than just the production of a thesis; it is a journey of learning, both academically and personally, and even at times a contest of pure stubbornness. - My supervisors Drs Simone Hoskin, Harry Clark and Ian Brookes. - A special thanks is owed to Dr Ian Brookes and Prof. Garry Waghorn. Thank-you for your patience, advice and tolerance, I have am very grateful to both of you. - To those that have helped me in the running of the experiments thank-you for all of your help, we survived the destruction of buildings, advancement of heavy machinery, make-shift facilities, flooding, the re-building of animal facilities and all that goes with it. Special thanks go to the Ruminant Nutrition and Greenhouse Gas Mitigation team at AgResearch, particularly German Molano, Anna Garland, Cesar Pinares-Patiño and Adrienne Smith, and the Deer Research Group at Massey University, particularly Martin Chesterfield and Geoff Purchas who were always there to give a lending hand with the deer. - Dr Alasdair Noble and Dr Nicolas Lopez-Villalobos, whose advice with statistics was greatly appreciated. Gabrielle David and Kirsty Hammond for the tedious task of helping me to proof read. - Personal and project financial assistance was gratefully received from the G.O. Antiss Postgraduate scholarship, Enterprise Scholarship, Elanco Animal Health (a division of Eli Lilly and Company), DEEResearch Ltd, Ministry of Agriculture and Forestry, Massey University Research Fund, Institute of Veterinary, Animal and Biomedical Sciences travel and postgraduate research fund, the Pastoral Greenhouse Gas Research Consortium (PGgRc) and AgResearch Ltd. -Last, but not least, I would like thank Kristy Hammond and my partner Owen Mudgway for their support and for just being there.. iii.
(6) TABLE OF CONTENTS ABSTRACT ..................................................................................................................... I ACKNOWLEDGEMENTS......................................................................................... III TABLE OF CONTENTS..............................................................................................IV LIST OF TABLES .................................................................................................... VIII LIST OF FIGURES ......................................................................................................XI LIST OF PLATES .................................................................................................... XIII CHAPTER 1 LITERATURE REVIEW............................................................................................... 1 1.1 INTRODUCTION ................................................................................................................................2 1.2 NEW ZEALAND’S ENTERIC METHANE INVENTORY .............................................................3 1.3 RUMINANT ENTERIC METHANE PRODUCTION .....................................................................5. 1.3.1 Sites of methanogenesis and excretion............................................................................. 5 1.3.2 Methanogens .................................................................................................................... 7 1.3.3 Methanogenesis ................................................................................................................ 8 1.3.4 Methods to measure methane emissions ........................................................................ 10 1.3.4.1 Indirect calorimetry ...............................................................................................................10 1.3.4.2 Sulphur hexafluoride tracer technique ...................................................................................12 1.4 FACTORS EFFECTING ENTERIC METHANE PRODUCTION AND YIELD .......................13. 1.4.1 Feed Intake ..................................................................................................................... 13 1.4.2 Chemical composition of the diet................................................................................... 14 1.4.2.1 Quantification and prediction of relationship between dietary chemical composition and CH4 yield ...........................................................................................................................................14 1.4.2.2 Carbohydrates .......................................................................................................................15 1.4.2.3 Non-carbohydrate components ..............................................................................................15 1.4.2.4 Secondary plant compounds ..................................................................................................16. 1.4.3 Apparent nutrient digestibility ....................................................................................... 17 1.4.4 Rate of digesta passage and particle degradation ........................................................... 18 1.4.5 Ruminant maturity/age ................................................................................................... 19 1.4.6 Farmed ruminant species ................................................................................................ 21 1.5 METHANE MITIGATION ...............................................................................................................23. 1.5.1 Targets for CH4 mitigation management........................................................................ 26 1.5.1.1 Microbial management ..........................................................................................................26 1.5.1.2 Animal management .............................................................................................................27 1.5.1.3 Combining management strategies........................................................................................28. 1.5.2 Potential mitigation technologies ................................................................................... 28 1.5.2.1 Diet ........................................................................................................................................28 Forage quality ...................................................................................................................................28 Alternative fresh forages to ryegrass pasture ....................................................................................29 1.5.2.2 Oils ........................................................................................................................................32 1.5.2.3 Monensin ...............................................................................................................................34 1.6 CONCLUSIONS .................................................................................................................................37. 1.6.1 Aims of this thesis .......................................................................................................... 39. CHAPTER 2. iv.
(7) METHANE EMISSIONS FROM RED DEER (CERVUS ELAPHUS) STAGS POST-WEANING UNTIL ONE YEAR OF AGE GRAZING PERENNIAL RYEGRASS (LOLIUM PERENNE) BASED PASTURE.......................................... 41 2.1 ABSTRACT ........................................................................................................................................ 42 2.2 INTRODUCTION .............................................................................................................................. 43 2.3 MATERIALS AND METHODS ....................................................................................................... 45. 2.3.1 Experimental design and animals .................................................................................. 45 2.3.2 Diet and dry matter intake ............................................................................................. 46 2.3.3 Methane measurements ................................................................................................. 48 2.3.3.1 SF6 release rate correction .................................................................................................... 50. 2.3.4 Chemical analysis and forage sampling......................................................................... 52 2.3.5 Statistical analysis.......................................................................................................... 52 2.4 RESULTS ........................................................................................................................................... 52. 2.4.1 Dietary chemical and botanical composition ................................................................. 52 2.4.2 Live weight and liveweight gain.................................................................................... 54 2.4.3 Dry matter intake ........................................................................................................... 54 2.4.4 Methane production and yield ....................................................................................... 56 2.4.4.1 SF6 release rates .................................................................................................................... 56 2.4.4.2 Methane production and yield .............................................................................................. 58 2.5 DISCUSSION ..................................................................................................................................... 59. 2.5.1 Methane yield ................................................................................................................ 59 2.5.2 SF6 release rate .............................................................................................................. 65 2.5.3 Conclusion ..................................................................................................................... 68 2.6 APPENDIX ......................................................................................................................................... 69. CHAPTER 3 THE EFFECT OF MONENSIN ON THE METHANE EMISSIONS OF TWINBEARING EWES IN EARLY LACTATION ............................................................ 71 3.1 ABSTRACT ........................................................................................................................................ 72 3.2 INTRODUCTION .............................................................................................................................. 73 3.3 MATERIALS AND METHODS ....................................................................................................... 75. 3.3.1 Experimental design ...................................................................................................... 75 3.3.2 Animals and housing ..................................................................................................... 77 3.3.3 Diet and feeding............................................................................................................. 78 3.3.4 Apparent digestibility and urine production .................................................................. 79 3.3.5 Monensin treatment ....................................................................................................... 80 3.3.6 Methane measurements ................................................................................................. 80 3.3.7 Blood sampling .............................................................................................................. 81 3.3.8 Milk production ............................................................................................................. 81 3.3.9 Rumen fluid sampling.................................................................................................... 81 3.3.10 Laboratory analysis...................................................................................................... 83 3.3.11 Statistical analysis........................................................................................................ 83 3.4 RESULTS ........................................................................................................................................... 84. 3.4.1 Dietary chemical composition ....................................................................................... 84 3.4.2 Live weight and liveweight gain.................................................................................... 86 3.4.3 Milk production ............................................................................................................. 89 3.4.4 Feed intake ..................................................................................................................... 89 3.4.5 Apparent digestibility .................................................................................................... 89 3.4.6 Methane emissions ........................................................................................................ 92 3.4.7 Energy and nitrogen balance ......................................................................................... 95 v.
(8) 3.4.8 Blood metabolites........................................................................................................... 98 3.4.9 Rumen fermentation ....................................................................................................... 98 3.5 DISCUSSION ....................................................................................................................................104. 3.5.1 Methane emissions ....................................................................................................... 104 3.5.2 Diet and animal production .......................................................................................... 106 3.5.3 Blood metabolites......................................................................................................... 109 3.5.4 Conclusion.................................................................................................................... 110 3.6 Appendix............................................................................................................................................111. CHAPTER 4 THE EFFECT OF MONENSIN AND/OR COCONUT OIL SUPPLEMENTATION ON METHANE EMISSIONS OF SHEEP FED EITHER PERENNIAL RYEGRASS-BASED PASTURE OR CHICORY........................... 113 4.1 ABSTRACT ......................................................................................................................................114 4.2 INTRODUCTION ............................................................................................................................115 4.3 MATERIALS AND METHODS .....................................................................................................117. 4.3.1 Experimental design ..................................................................................................... 117 4.3.2 Animals and treatments ................................................................................................ 118 4.3.3 Diets and feeding.......................................................................................................... 120 4.3.4 Methane measurements ................................................................................................ 121 4.3.5 Rumen fluid sampling for pH, volatile fatty acids, and ammonia................................ 122 4.3.6 Laboratory analysis ...................................................................................................... 123 4.3.7 Statistical analysis ........................................................................................................ 123 4.4 RESULTS ..........................................................................................................................................124. 4.4.1 Dietary chemical and botanical composition ............................................................... 124 4.4.2 Dry matter intake.......................................................................................................... 126 4.4.3 Methane emissions ....................................................................................................... 129 4.4.4 Rumen fermentation ..................................................................................................... 132 4.5 DISCUSSION ....................................................................................................................................136. 4.5.1 Chicory ......................................................................................................................... 136 4.5.2 Potential mitigation agents ........................................................................................... 139 4.5.2.1 Monensin .............................................................................................................................139 4.5.2.2 Coconut oil ..........................................................................................................................143 4.5.2.3 Combining potential mitigation agents and technologies ....................................................146. 4.5.3 SF6 technique................................................................................................................ 146 4.5.4 Conclusion.................................................................................................................... 151 4.6 APPENDIX ........................................................................................................................................152. CHAPTER 5 COMPARATIVE METHANE EMISSIONS IN CATTLE, SHEEP AND RED DEER AND APPARENT DIGESTIBILITY IN SHEEP AND RED DEER FED ENSILED LUCERNE CHAFF (MEDICAGO SATIVA, FIBREPRO®) DURING SUMMER AND WINTER ......................................................................................... 153 5.1 ABSTRACT ......................................................................................................................................154 5.2 INTRODUCTION ............................................................................................................................155 5.3 MATERIALS AND METHODS .....................................................................................................157. 5.3.1 Experimental design ..................................................................................................... 157 5.3.2 Animals ........................................................................................................................ 157 5.3.3 Diets and feeding.......................................................................................................... 157 vi.
(9) 5.3.4 Apparent digestibility and urine measurements........................................................... 158 5.3.5 Methane emissions ...................................................................................................... 159 5.3.6 Rumen fermentation .................................................................................................... 160 5.3.7 Laboratory analysis...................................................................................................... 161 5.3.8 Statistical analysis........................................................................................................ 161 5.4 RESULTS ......................................................................................................................................... 162. 5.4.1 Dietary chemical composition ..................................................................................... 162 5.4.2 Dry matter intake ......................................................................................................... 162 5.4.3 Apparent digestibility .................................................................................................. 163 5.4.4 Methane emissions ...................................................................................................... 165 5.4.5 Energy balance ............................................................................................................ 166 5.4.6 Rumen fermentation .................................................................................................... 170 5.5 DISCUSSION ................................................................................................................................... 174. 5.5.1 Methane emission differences between ruminant species ........................................... 174 5.5.2 Digestive physiology and CH4 emissions .................................................................... 175 5.5.3 Seasonality ................................................................................................................... 178 5.5.4 Variability in CH4 production measurements .............................................................. 179 5.5.5 Conclusion ................................................................................................................... 179. CHAPTER 6 GENERAL DISCUSSION ......................................................................................... 181 6.1 INTRODUCTION ............................................................................................................................ 182 6.2 DISCUSSION ................................................................................................................................... 182. 6.2.1 The effect of potential mitigation technologies for reducing on methane emissions .. 182 6.2.1.1 Chicory ............................................................................................................................... 182 6.2.1.2 Monensin ............................................................................................................................ 184 6.2.1.3 Coconut oil ......................................................................................................................... 187 6.2.1.4 Combining potential mitigation technologies ..................................................................... 187 6.2.1.5 Economic benefit of methane mitigation technologies ....................................................... 188. 6.2.2 Influence of age and ruminant species on methane emissions .................................... 191 6.2.2.1 Age ..................................................................................................................................... 191 6.2.2.2 Ruminant species ................................................................................................................ 192. 6.2.3 Retrospective power analysis and the SF6 technique................................................... 194 6.2.3.1 Retrospective power analysis .............................................................................................. 194 6.2.3.2 The SF6 technique ............................................................................................................... 198 6.3 CONCLUSIONS AND RECOMMENDATIONS FOR FUTURE RESEARCH ........................ 200. 6.3.1 Conclusions ................................................................................................................. 200 6.3.2 Recommendations for future research ......................................................................... 201. ANNEX A DECISION ANALYSIS TREE FOR THE EXCLUSION OF METHANE EMISSION DATA FROM STATISTICAL ANALYSIS – CATTLE AND SHEEP. ....................................................................................................................................... 203 CHAPTER 7 LIST OF REFERENCES ........................................................................................... 213. vii.
(10) LIST OF TABLES Table 1.1: Options for reducing methane emissions, in total, per unit of feed intake or per unit of product from ruminants fed fresh forages (Waghorn & Woodward, 2006). ............... 24 Table 1.1(continued): Options for reducing methane emissions, in total, per unit of feed intake or per unit of product from ruminants fed forages (Waghorn & Woodward, 2006) .... 25 Table 1.2: Methane (CH4) production (g CH4/day), and yield (expressed in terms of dry matter intake (g CH4/kg DMI) or digestible dry matter intake (g CH4 per kg DDMI)), from cattle, sheep and red deer fed a range of fresh forage diets indoors. ....................................... 31 Table 1.3: Summary of sheep supplemented with coconut oil and its effect on methane (CH4) production (CH4p, g/day) and CH4 yield (CH4y, g/kg DMI). ................................................. 32 Table 1.4: Effect of monensin supplementation on methane (CH4) production (g/day) and yield (g/kg dry matter intake, DMI) (Beauchemin et al., 2008).............................................. 36 Table 2.1: Chemical composition (g/kg dry matter, DM) of pasture offered during the five day methane measurement periods when deer were 4.5, 6.5, 9.0 and 11.5 months of age. .... 53 Table 2.2: Botanical composition (clover, dead, ryegrass and weeds) expressed as a proportion of the total sample DM of the pasture during the 5 day methane measurement periods when deer were 4.5, 6.5, 9.0 and 11.5 months of age. ............................................... 54 Table 2.3: Live weight (kg), liveweight gain (g/day) and calculated dry matter (DM) intake (DMI; kg/day) of red deer stags at 4.5, 6.5, 9.0 and 11.5 months of age when grazing perennial ryegrass pasture. ...................................................................................................... 55 Table 2.4: Uncorrected (Puncorr) and corrected (Pcorr) release rates from permeation tubes (n = 13) during methane measurement periods when deer were 4.5, 6.5, 9.0 and 11.5 months of age. .......................................................................................................................................... 57 Table 2.5: Methane (CH4) production (g CH4/day) of red deer stags calculated using uncorrected and corrected SF6 release rates when deer were 4.5, 6.5, 9.0 and 11.5 months of age. .......................................................................................................................................... 57 Table 2.6: Dry matter (DM) intake (DMI; kg/day) and methane (CH4) production (g CH4/day) and yield (g CH4/kg DMI) based on corrected SF6 reelase rates of 20 red deer stags, at 4.5, 6.5, 9.0 and 11.5 months of age, grazing perennial ryegrass pasture. .......................... 58 Table 2.7. Dry matter intake (DMI kg/day) and methane (CH4) yields (CH4y, g CH4/kg DMI) from young and old sheep, cattle and deer. ............................................................................. 61 Table 2.8: Uncorrected release rates of sulphur hexafluoride (SF6) pre-deployment and corrected release rates when recovered from red deer stags at slaughter (n = 13). The uncorrected release rates of SF6 gas are determined from the linear regression of a permeation tube’s weights over time and then extrapolated to estimate release rates in situ, but corrected values are based on a curvilinear linear regression. ................................................................ 69 Table 2.9: Methane (CH4) production (grams per day) averaged over a 5 days of collection of red deer stags using uncorrected and corrected release rates of sulphur hexafluoride (SF6). 70 Table 3.1: Timetable of main activities during the experiment. ............................................. 77 Table 3.2: Chemical composition (g/kg dry matter, DM) of the FibrePro diet (ensiled lucerne, Medicago sativa, chaff with added molasses; n = 2) to and refused by sheep and the in vitro digestibilities (% DM) and organic matter (% DM) of feed offered to sheep during the three measurement periods; pre-lambing, 3 weeks and 6 weeks post-lambing. ................ 85 Table 3.3: Daily dry matter (DM) intake (DMI), digestible DMI, organic matter (OM) intake (OMI) and in vivo apparent digestibilities of DM and OM at 3 and 6 weeks post-lambing in twin-bearing ewes either with (monensin, n = 10) or without (control, n = 10) monensin supplementation and fed FibrePro (ensiled lucerne, Medicago sativa, chaff with added molasses). ................................................................................................................................ 91 Table 3.4: The planned number of animals to be used within each treatment group (control, and monensin), versus the actual number of animals used in the final analysis of methane emissions (pre-lambing and post-lambing). ............................................................................ 93 viii.
(11) Table 3.5: Methane emissions (covariate adjusted means ± SEM) of twin-bearing ewes fed FibrePro (ensiled lucerne, Medicago sativa, chaff with added molasses) , with (monensin) and without (control) monensin supplementation at 3 and 6 weeks post-lambing. ................ 94 Table 3.6: Nitrogen flows (mean ± SEM, g/day) in ewes supplemented with monensin and fed FibrePro (ensiled lucerne, Medicago sativa, chaff with added molasses) at 3 and 6 weeks post-lambing. .......................................................................................................................... 96 Table 3.7: Energy flows (mean ± SEM, MJ/day) in ewes supplemented with monensin and fed FibrePro (ensiled lucerne, Medicago sativa, chaff with added molasses) at 3 and 6 weeks post-lambing. .......................................................................................................................... 97 Table 3.8: Mean (covariate adjusted ± SEM) total volatile fatty acid (VFA), ammonia concentrations (m mol/100 ml), and individual VFA as a proportion of total VFA concentration in the rumen fluid of twin-bearing ewes fed FibrePro (ensiled lucerne, Medicago sativa, chaff with added molasses) , with (monensin) and without (control) monensin supplementation at 3 and 6 weeks post-lambing. ................................................. 103 Table 3.9: Adjusted live weight (kg) and liveweight gain (g/day) (mean ± SEM g/day) of twin-lambs from ewes with (monensin) and without (control) monensin supplementation and fed FibrePro (Fibre Fresh Feeds, Reporoa, New Zealand). .................................................. 111 Table 4.1: Timetable of activities during the experiment. ................................................... 118 Table 4.2: Dietary chemical composition (± SEM, g/kg dry matter, DM), gross energy, in vitro DM digestibility (%) and metabolisable energy concentration of the pasture and chicory offered to sheep during treatment measurement periods. ..................................................... 125 Table 4.3: Fatty acid (FA) profile (expressed as either g/100g or percentage of total FA) of the fatty acids detected in the coconut oil administered to sheep. ........................................ 126 Table 4.4: Intake of forage dry matter (DM), feeding level (multiples of ME energy requirements for maintenance), metabolisable energy (ME) and gross energy (GE) of sheep fed either chicory or pasture and treated with monensin and/or coconut oil. Values presented are the mean (± SEM) of the two treatment periods. ............................................................ 127 Table 4.5: Planned number of animals versus the actual number of animals used and the number of data points included in the final analysis of methane (CH4) production (g CH4/day) and yield (g CH4/kg DMI) within each measurement period. .............................................. 128 Table 4.6: Methane (CH4) production (CH4 g/day), CH4 yield (CH4 g/kg dry matter intake, DMI), CH4 per kg digestible DMI (CH4 g/kg DDMI) and CH4 energy expressed as a percentage of gross energy intake (GEI) (CH4 as a % GEI) for sheep fed chicory or pasture and supplemented with monensin and/or coconut oil. Values presented are the mean (± SEM) of the two treatment periods. ................................................................................................ 131 Table 4.7: Rumen fluid concentrations of total volatile fatty acid (VFA, m mol/100 ml) and individual VFA as a percentage of total VFA concentration of sheep fed chicory (n = 20) or pasture (n = 20) and treated with monensin (n = 8) and/or coconut oil (n = 12 coconut oilonly; n = 12 coconut oil plus monensin). Values presented are the mean (± SEM) of the two treatment periods. ................................................................................................................. 134 Table 4.8: Rumen fluid pH and ammonia (NH3) concentrations (m mol/L) from sheep fed fresh chicory (n = 20) or pasture (n = 20) and treated with monensin (n = 8) and/or coconut oil (n = 12 coconut oil; n = 12 coconut oil plus monensin). Values presented are the mean (± SEM) of the two treatment periods. ...................................................................................... 135 Table 4.9: Effect of monensin on methane (CH4) production and yield. Adapted from Beauchemin et al. (2008)...................................................................................................... 142 Table 4.10: Summary of in vivo experiments of sheep supplemented with coconut oil and its effect on methane (CH4) production (CH4p, g/day) and CH4 yield (CH4y, g/kg DMI). ....... 145 Table 4.11: A comparison of SF6 and CH4 gas variance from the breath samples collected from sheep. ........................................................................................................................... 148 Table 4.12: Chemical composition (g/kg DM), in vitro digestibility (%) and metabolic energy (ME; MJ ME/kg DM) concentration of chicory and pasture offered to sheep during each measurement period. .................................................................................................... 152 Table 5.1: Chemical composition (± SEM g/kg DM), ratio of readily fermentable carbohydrate to structural carbohydrate (RFC:SC) and gross energy (GE, MJ/kg DM), of the ix.
(12) FibrePro diet (ensiled lucerne, Medicago sativa, chaff with added molasses) offered to cattle, sheep and red deer in summer and winter. ............................................................................ 162 Table 5.2: Daily dry matter intake (DMI), gross energy intake (GEI; MJ/day) and feeding level (as a multiple of maintenance energy requirements) of cattle, sheep and red deer fed FibrePro (ensiled lucerne, Medicago sativa, chaff with added molasses) in summer and winter..................................................................................................................................... 163 Table 5.3: Dry matter intake (DMI; kg/day) and apparent digestibility (% DMI) of dietary chemical constituents of the FibrePro diet (ensiled lucerne, Medicago sativa, chaff with added molasses) fed to sheep and deer in summer and winter. ............................................. 164 Table 5.4: Planned versus the actual number of animals and maximum planned versus actual number of data points used in the final analysis of methane (CH4) emissions in summer and winter..................................................................................................................................... 165 Table 5.5: The calculated methane (CH4) production, CH4 yield, CH4 per of feeding level, CH4 per kg of digestible dry matter intake (DDMI) or digestible organic matter intake (DOMI) and CH4 as a percentage of gross energy intake (CH4 as a % GEI) from cattle, sheep and red deer fed FibrePro (ensiled lucerne, Medicago sativa, chaff with added molasses) in summer and winter. ............................................................................................................... 168 Table 5.6: Calculated dietary energy intake and dietary energy losses as a percentage of gross energy intake (GEI) from sheep and red deer fed FibrePro (ensiled lucerne, Medicago sativa, chaff with added molasses) chaff in summer and winter. .......................................... 169 Table 5.7: Rumen fluid concentrations of ammonia and total volatile fatty acids (VFA) (m mol/L), the molar percentage of individual VFAs of cattle, sheep and red deer fed FibrePro (ensiled lucerne, Medicago sativa, chaff with added molasses) in summer and winter........ 172 Table 5.8: Rumen fluid pH (mean ± SEM), taken 2, 4, 6 and 8 hours after the morning feeding event, in cattle, sheep and deer during summer and winter when fed FibrePro (ensiled lucerne, Medicago sativa, chaff with added molasses). ........................................................ 173 Table 6.1: Effect of monensin on methane (CH4) production (g/day) and yield (g/kg dry matter intake; DMI). Adapted from Beauchemin et al. (2008). ............................................ 186 Table 6.2: Scenario analysis of the predicted total cost ($) of enteric methane (CH4) for cattle, sheep and deer and the estimated savings ($) made by mitigation total CH4 emissions per animal per year. ............................................................................................................... 190 Table 6.3: Power analysis for determining the sample size required to detect a significant difference between two means with 95% confidence and a power of 80% and type 1 error (α) of 0.05 using the standard deviation (SD) from previous experiments. ................................ 195 Table 6.4: Retrospective power analysis to determine the actual power obtained and the percentage difference required between two means to detect a significant difference of 20% with a power of 80% when based on calculated methane (CH4) yield (g/kg dry matter intake). Also shown is the number of animals required to detect a statistical difference of 20% between two means for CH4 yield (80% probability, and type 1 error (α) of 0.05). ............. 196 Table 6.4 (continued): Retrospective power analysis to determine the actual power obtained and the percentage difference required between two means to detect a significant difference of 20% with a power of 80% when based on calculated methane (CH4) yield (g/kg dry matter intake). Also shown is the number of animals required to detect a statistical difference of 20% between two means for CH4 yield (80% probability, and type 1 error (α) of 0.05). ..... 197 Table A.1: Description of the range of concentrations of sulphur hexafluoride gas (SF6) and methane gas (CH4) collected from the breath samples of sheep and cattle data in experiments from 2002 to 2007 using the SF6 technique. ......................................................................... 206. x.
(13) LIST OF FIGURES Figure 1.1: Schematic diagram of the model used to calculate New Zealand’s ruminant enteric methane (CH4) emissions. (DMI, dry matter intake; GEI, gross energy intake) (Anon, 2007). ........................................................................................................................................ 5 Figure 1.2: Microbial fermentation in the rumen. Microbes digest feed to simple monomers, which in turn are utilised by both primary and secondary fermenters. Methanogens prevent the accumulation of hydrogen (H2) by reducing carbon dioxide (CO2) to methane (CH4). (NH3, ammonia) (McAllister et al., 1996). ............................................................................... 7 Figure 1.3: Hexose fermentation by Ruminococcus albus in the absence and presence of methanogens. In mono-culture, R. albus degrades glucose to acetate, ethanol, hydrogen (H2), and carbon dioxide (CO2). Hydrogen inhibits NAD+ (nicotinamide adenine dinucleotide) formation from NADH. In co-culture with methanogens, NADH is used to reduce protons to H2 and the final products are acetate and methane (CH4) (Fd = ferredoxin) (Miller, 1995). . 10 Figure 1.4: Estimated methane (CH4) production, expressed as kcal/100 kcal feed, of sheep when fed diets of differing apparent digestibilites of energy and at three different levels of energy maintenance requirements (Blaxter & Clapperton, 1965). ......................................... 18 Figure 1.5: Possible sites of microbial-intervention for lowering ruminant methane (Joblin, 1999). ...................................................................................................................................... 27 Figure 1.6: Summary of literature results for 33 treatment means showing the effect of fat from various sources on the percentage reductions in methane (CH4) (g/kg dry matter intake, DMI) relative to the control diet. The solid line represents the regression accounting for the effect of study; y = 5.562 (s.e. = 0.590) x percentage added fat; (r2 = 0.67; P = 0.004) (Beauchemin et al., 2008)....................................................................................................... 34 Figure 3.1: Live weight (kg, covariate adjusted means) of ewes pre- and post-lambing either receiving monensin (21 mg/day, monensin; n =10) or a placebo (control; n = 10). Monensin and placebo drenching commenced two days after lambing. abcd Differing letters denote a difference between each time point in the overall mean live weights (P < 0.05). .................. 87 Figure 3.2: Live weight (kg, covariate adjusted means) of twin lambs from birth until 36 days of age, with birth weight used as a covariate (P = 0.001). Lambs were from ewes treated with monensin at 21 mg/day (monensin, n =20) or from ewes receiving a placebo (control, n = 12). Monensin and placebo drenching of ewes commenced two days after lambing. * Denotes a significant difference between means at the same point in time (P < 0.05). ....................................................................................................................................... 88 Figure 3.3: Pre- and post-lambing concentrations (m mol/L) of blood glucose in twinbearing ewes with (monensin, n = 10) and without (control, n = 10) monensin supplementation, which commenced two days post-lambing. Lambing is denoted as day 0. Error bars represent the standard error of the mean. Differing letters denote a significant difference (P < 0.05) between days in the average blood glucose concentrations across both treatment groups. .................................................................................................................... 99 Figure 3.4: Pre- and post-lambing concentrations (m mol/L) of blood β-hydroxybutyrate (BOH) in twin-bearing ewes, with (monensin, n = 10) and without (control, n = 10) monensin supplementation, which commenced two days post-lambing. Lambing is denoted as day 0. Error bars represent the standard error of the mean. Differing letters denote a significant difference (P < 0.05) between days in the average blood BOH concentrations across both treatment groups. .................................................................................................................. 100 Figure 3.5: Pre- and post-lambing concentrations (m mol/L) of blood non-esterified fatty acids (NEFA) in twin-bearing ewes, (monensin, n = 10) and without (control, n = 10) monensin supplementation, which commenced two days post-lambing. Lambing is denoted as day 0. Error bars represent the standard error of the mean. Differing letters denote a significant difference (P < 0.05) between days in the average blood NEFA concentrations across both treatment groups. ............................................................................................... 101. xi.
(14) Figure 3.6: Pre- and post-lambing concentrations (m mol/L) of blood urea in twin-bearing ewes, with (monensin, n = 10) and without (control, n = 10) monensin supplementation, which commenced two days post-lambing. Lambing is denoted as day 0. Error bars represent the standard error of the mean. .............................................................................................. 102 Figure 4.1a.b: Ratio of concentration of sulphur hexafluoride (SF6) and methane (CH4) gases in the breath samples of individual sheep within each measurement period, after correction for ambient concentrations of SF6 and CH4. Each graph shows a sub-group (n = 10) of animals that is not related to treatments or diets fed................................................... 149 Figure 4.1c.d: Ratio of concentration of sulphur hexafluoride (SF6) and methane (CH4) gases in the breath samples of individual sheep within each measurement period, after correction for ambient concentrations of SF6 and CH4. Each graph shows a sub-group (n = 10) of animals that is not related to treatments or diets fed. ............................................................ 150 Figure A.1: Decision tree for the inclusion or exclusion of data based on the concentrations of the gases sulphur hexafluoride gas (SF6) and methane gas (CH4) from the collection canisters of sheep and cattle. ................................................................................................. 205 Figure A.2: Percentile (%) plot of sulphur hexafluoride gas (SF6) (parts per trillion (ppt)) concentrations as measured directly from sheep (n (experiments) = 15, n (data points) = 3542) and cattle (n (experiments) = 17, n (data points) = 5170) when data is ranked from lowest to highest. ................................................................................................................... 207 Figure A.3: Percentile (%) plot of methane gas (CH4) (parts per million (ppm)) concentrations as measured directly from sheep (n (experiments) = 15, n (data points) = 3542) and cattle (n (experiments) = 17, n (data points) = 5170) when data is ranked from lowest to highest. ................................................................................................................... 208 Figure A.4: Percentile (%) plot of the ratio of sulphur hexafluoride gas (SF6) (parts per trillion (ppt)): methane gas (CH4) (parts per million (ppm)) concentrations as measured directly from sheep (n (experiments) = 15, n (data points) = 3542) and cattle (n (experiments) = 17, n (data points) = 5170) when data is ranked from lowest to highest. .......................... 209 Figure A.5: Percentile (%) plot of the ratio of sulphur hexafluoride gas (SF6) release from the permeation tube (PR) (mg/day): SF6 (parts per trillion (ppt)) as measured directly from sheep (n (experiments) = 15, n (data points) = 3542) and cattle (n (experiments) = 17, n (data points) = 5170) when data is ranked from lowest to highest................................................. 210 Figure A.6: Linear regression of release rate of sulphur hexafluoride gas (SF6) from the permeation tube and the ratio of the gases SF6: methane (CH4) for cattle (n (experiments) = 17, n (data points) = 5170). ................................................................................................... 211 Figure A.7: Linear regression of release rate of sulphur hexafluoride gas (SF6) from the permeation tube and the ratio of the gases for sheep n (experiments) = 15, n (data points) = 3542). .................................................................................................................................... 212. xii.
(15) LIST OF PLATES Plate 2.1 (a) & (b): Methane (CH4) collection equipment, halter and yoke, used to collect breath samples from red deer during CH4 measurements, when deer are standing (a) and grazing (b). 51 Plate 4.1: A sheep wearing the breath collection apparatus, while in a metabolism cage.........122. xiii.
(16)
(17) CHAPTER 1 Literature review. 1.
(18) Chapter 1: Literature review. 1.1 INTRODUCTION The earth’s climate is becoming warmer, with global surface temperatures estimated to have increased by 0.74°C for the 100 year period from 1906 – 2005 (Solomon et al., 2007). The accelerated warming of the earth’s climate is attributed to the accumulation of greenhouse gases (GHG) from anthropogenic sources. As a result, it is anticipated that there will be an increase in the number and intensity of extreme weather events (Solomon et al., 2007). The United Nations Framework Convention on Climate Change (UNFCCC) has defined climate change as “a change in climate which is attributed directly or indirectly to human activity that alters the composition of the global atmosphere and which is in addition to natural climate variability” (UNFCCC, 2008). Greenhouse gases are important in creating the earth’s climate as they, along with clouds, act as an insulation barrier and radiate solar energy reflected by land and ocean back towards the earth’s surface. This subsequently traps energy and warms the earth’s surface and is termed the greenhouse effect (Le Treut et al., 2007). The main GHGs produced from human activity that have intensified the greenhouse effect, enhancing global warming and climate change are carbon dioxide (CO2), methane (CH4), nitrous oxide (N2O) hydrofluorocarbons, perfluorocarbons, and sulphur hexafluoride (SF6), (Le Treut et al., 2007). Methane has a global warming potential estimated to be 21 times that of CO2 (weight basis, Solomon et al., 2007). However, CH4 has a shorter atmospheric residence time, of approximately 12 years, compared with CO2, which is around 100 years (Solomon et al., 2007). Consequently, reducing CH4 emissions will have positive effects on the climate within a shorter time period than reductions in CO2 emissions. Agriculture is considered to be responsible for 10 to 12% (5.1 to 6.1 GT CO2 equivalents; CO2-e.) of total anthropogenic GHG emissions, with the principal sources being CH4 (3.3 GT CO2-eq) and N2O (2.8 GT CO2-eq; Smith et al, 2007). Enteric CH4 produced from ruminant livestock is responsible for 15 to 33% of total anthropogenic CH4 emissions (Smith et al., 2007; Solomon et al., 2007).. 2.
(19) Chapter 1: Literature review. By 2030, CH4 from agriculture is predicted to increase by 60%; in direct proportion to livestock numbers, unless international efforts are made to reduce emissions (Smith et al., 2007). New Zealand is unique amongst developed nations as approximately 48% of GHG come from agriculture, with an increase of 12.7% in total agriculture GHG emissions between 1990 and 2007 (Anon, 2009). Methane emissions arising from ruminant enteric fermentation are accountable for 31% of New Zealand’s total GHG and 64% of all agriculture GHG emissions, which have increased by 6.9% between 1990 and 2007 (Anon, 2009). This large contribution of enteric CH4 emissions to New Zealand’s total GHG emissions means that the implementation of mitigation strategies to reduce emissions from livestock is a priority (Anon, 2009). The aim of this literature review is to briefly describe the process of methanogenesis in the ruminant animal and discuss the current knowledge of factors that influence the production of CH4 and its mitigation, with an emphasis on grazing ruminants. The review will describe the New Zealand Greenhouse Gas Inventory for enteric CH4 emissions (Section 1.2), followed by the process of CH4 formation (methanogenesis) in the gastro-intestinal tract of ruminants and its measurement with reference to the two dominant methods (indirect calorimetry and the SF6 technique; Section 1.3). Factors affecting CH4 emissions from ruminants (Section 1.4) will be considered, and lastly, current and potential CH4 mitigation technologies will be discussed, with particular emphasis on studies relevant to grazing ruminants fed fresh forages (Section 1.5). 1.2 NEW ZEALAND’S ENTERIC METHANE INVENTORY Under the requirements of the Kyoto Protocol, New Zealand is required to develop and produce accurate inventories of all GHG emissions. Enteric CH4 emissions reported by the New Zealand Greenhouse Gas Inventory (1990 to 2007 (Anon, 2009)) are calculated using the “Tier 2” method. However, this is expected to be moving towards a “Tier 3” method in the future (Clark Pers. Comm., 2009).. 3.
(20) Chapter 1: Literature review. As discussed by Clark (2002), the International Panel on Climate Change (IPCC) has developed guidelines for three types of inventory methodologies, “Tier 1”, “Tier 2” and “Tier 3”. In essence, Tier 1 inventories are simplistic and are used for emissions from minor sources, whilst Tier 2 and Tier 3 inventories are more complex. These latter inventories are recommended for major sources of GHG and are appropriate for calculating New Zealand’s enteric CH4 emissions. Other countries using the Tier 2 method to calculate enteric CH4 emissions include Australia, Ireland and Holland (Clark Pers. Comm., 2009). Under the Tier 2 method (Figure 1.1), ruminants are divided into livestock type, i.e. sheep, deer, beef and dairy cattle, and then further subdivided into respective livestock classes, such as breeding hinds, weaners, and stags. Within each class of livestock, population changes within a year are accounted for by monthly time-step intervals, i.e. seasonal births and slaughter, animals changing from one class to the next (i.e. young animals entering the breeding herd), and deaths from natural causes. Total animal numbers are based upon data collected by Statistics New Zealand and supplemented with data from the Ministry of Agriculture and Forestry (MAF) (Anon, 2009). Total CH4 emissions for each livestock class are based on the population of each livestock class and its estimated feed intake based on average live weight and liveweight change, calving/lambing percentage, milk production and dietary chemical composition/quality. The total feed consumed for each species is then multiplied by the CH4 energy loss as percentage of gross energy intake (CH4 as a % GEI) for each species to determine the total CH4 emissions. At present, the CH4 estimates used for cattle and sheep are based on the SF6 marker dilution technique. The 2007 New Zealand Greenhouse Gas Inventory (Anon, 2009) recognises that CH4 emissions from immature sheep (< 1 year of age) are lower than mature sheep (> 1 year of age), whilst immature cattle and deer are not recognised to have lower CH4 as a % GEI compared with mature animals. Research measuring CH4 (as a % GEI) does not include all livestock species and classes. For example, the CH4 emission factor for deer is an average of mature sheep and dairy cattle, that from dairy cattle is applied to non-dairy. 4.
(21) Chapter 1: Literature review. cattle, and there are no data available for goats and some classes of sheep (Anon, 2009). The accuracy of the livestock population’s dynamics may also present another area for concern. Statistics for estimating livestock populations are sourced from Statistics New Zealand and are not consistent with industry statistics or sufficiently detailed to provide accurate estimates of the dynamics of each livestock class presented in the GHG inventory calculations (Anon, 2009).. Figure 1.1: Schematic diagram of the model used to calculate New Zealand’s ruminant enteric methane (CH4) emissions. (DMI, dry matter intake; GEI, gross energy intake) (Anon, 2007).. 1.3 RUMINANT ENTERIC METHANE PRODUCTION 1.3.1 Sites of methanogenesis and excretion Ruminants, like all mammals, do not secrete the digestive enzymes essential for digesting plant structural carbohydrates (cellulose and hemicellulose). Forage digestion, especially of structural carbohydrates, arises from a symbiotic association between the host ruminant and the rumen microflora (bacteria, archaea, protozoa and fungi) (Akin, 1993). The majority of digestion takes place 5.
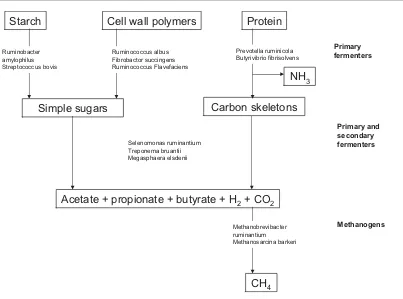
(22) Chapter 1: Literature review. in the rumen-reticulum (rumen) where up to 65%, 82% and 91% of organic matter, cellulose and hemicelluloses, respectively, in fresh forage diets are digested by sheep (Ulyatt & Egan, 1979; Waghorn et al., 2007). Microbial digestion also occurs in the hindgut (large intestine and caecum), but its contribution to digestion is smaller (5 to 15%; Waghorn et al., 2007). The rumen functions as a large anaerobic fermentation vat which provides optimal conditions for microflora responsible for the fermentation of feed (Morgavi et al., 2010).. Ingested feed is retained in the rumen where it is. extensively digested by microbial enzymes to produce end products such as volatile fatty acids (VFAs), as summarised in Figure 1.2, and these are utilised by the host animal as an energy source. The major VFAs are acetate, butyrate and propionate. The former two can be used in lipogenesis, whilst propionate is the main precursor of glucose and glycogen (Waghorn et al., 2007). Other end products of microbial fermentation that are not used by the animal as a source of energy are CO2 and hydrogen (H2), which methanogenic archaea utilise to form CH4 (termed methanogenesis; Section 1.3.2). This removal of H 2 maintains a low partial pressure of H2 in the rumen and allows for optimal microbial fermentation of feed (Janssen, 2010). The dominant site of methanogenesis occurs in the rumen with an estimated 87 to 92% (Murray et al., 1976; Torrent & Johnson, 1994) of total CH4 produced. The remaining 8 to 13% (Murray et al., 1976; Torrent & Johnson, 1994) of CH4 is produced in the hindgut (caecum and large intestine). Murray et al. (1976) reported that the major route of CH4 excretion is eructation via the mouth (98% of total CH4), with the remaining 2% excreted in the flatus. This is due to 89% of the CH4 produced in the lower intestine being absorbed into the blood and expired through the lungs (Murray et al., 1976). Nevertheless, the partitioning of CH4 between eructation, breath and flatus has not been well studied.. 6.
(23) Chapter 1: Literature review. Starch. Cell wall polymers. Ruminobacter amylophilus Streptococcus bovis. Protein Prevotella ruminicola Butyrivibrio fibrisolvens. Ruminococcus albus Fibrobactor succingens Ruminococcus Flavefaciens. Primary fermenters. NH3 Carbon skeletons. Simple sugars. Primary and secondary fermenters. Selenomonas ruminantium Treponema bruantii Megasphaera elsdenii. Acetate + propionate + butyrate + H2 + CO2 Methanobrevibacter ruminantium Methanosarcina barkeri. Methanogens. CH4. Figure 1.2: Microbial fermentation in the rumen. Microbes digest feed to simple monomers, which in turn are utilised by both primary and secondary fermenters. Methanogens prevent the accumulation of hydrogen (H2) by reducing carbon dioxide (CO2) to methane (CH4). (NH3, ammonia) (McAllister et al., 1996). 1.3.2 Methanogens Methane is produced by methanogenic archaea (McAllister et al., 1996; Janssen & Kris, 2008), whose only means of acquiring energy is by the formation of CH4 (Mathison et al., 1998). Members of the archaea domain are found in a wide range of environments; however, those isolated from the rumen are strictly anaerobic (Janssen & Kris, 2008). The identification and quantification of methanogens residing within the gastrointestinal tract of ruminants is difficult and imprecise when using traditional culture methods (Jarvis et al., 2000; Janssen & Kris, 2008). Although 113 methanogenic species from a wide a range of environments have been identified and classified, only seven species have been isolated and cultured from the rumen (Janssen & Kris 2008). Advances in molecular techniques have improved the precision of methanogenic detection from the rumen, and as a consequence, identification of methanogens has increased (Nicholson et al., 2007; Janssen & Kris, 2008). Janssen and Kris (2008) reported that 92.3% of 7.
(24) Chapter 1: Literature review. the. rumen. archaea. are. placed. within. 3. genus. levels. which. are. Methanobrevibacter (61.6%), Methanomicrobium (14.9%), and a yet uncultured group known as ‘Cluster C’ (15.8%). Between 9 to 25% of methanogens in the rumen are reported to be associated with protozoa (Newbold et al., 1996; Takahashi, 2001) and this relationship has been shown to be responsible for up to 37% of the CH4 produced in the rumen (Hegarty, 1999; Kumar et al., 2009). McAllister & Newbold (2008) proposed that protozoa are responsible for up to 50% of the fibrolytic activity in the rumen, and are an important source of H2 (Takahashi, 2001). The partial H2 pressure in the rumen appears to affect the colonisation of protozoa by methanogens, as after a feeding event, the number of methanogens associated with protozoa is decreased, but increased under low concentrations of H2 (Takahashi, 2001). In the absence of protozoa, rumen CH4 emissions were reduced by 13% in in vivo and in vitro experiments (Hegarty, 1999), but this decreased to 10.5% when only in vivo experiments were considered (Morgavi et al., 2010). The reduction of CH4 production due to the elimination of protozoa is diet dependent, with the effect being greatest when animals are fed concentrate diets compared with forage diets (Hegarty 1999; Morgavi et al., 2010). 1.3.3 Methanogenesis Enteric CH4 from ruminants is produced when feed is degraded by microorganisms within the digestive tract and results in the production of VFAs, ammonia (NH3), CO2 and H2. Although CO2 and H2 are the main substrates used for methanogenesis, formate, acetate, methanol and mono-, di- and trimethylamine can also be utilised as CH4 sources (Wolin et al., 1997). The products from digestion result in different amounts of H2 formation and so the stoichiometry of CH4 formation varies (Janssen, 2010). The formation of CH4 uses CO2 as the source of carbon and H2 as the electron acceptor and is the dominant pathway of methanogenesis in the rumen (Morgavi et al., 2010). The utilisation of CO2 denotes methanogens as the terminal user of carbon within the fermentation process, while providing an important sink for H2.. 8.
(25) Chapter 1: Literature review. The breakdown of plant materials to provide energy for microbial metabolism is through a series of catabolic reactions, named the Embden-Meyerhof-Parnas pathway. (McAllister. &. Newbold,. 2008).. Energy. associated. with. the. phosphorylation of ADP to ATP can be used to drive biochemical reactions. The conversion of ADP to ATP requires the reduction of a cofactor such as NAD+ (nicotinamide adenine dinucleotide) to NADH. To enable the continuation of the fermentation process, NADH must be re-oxidised to NAD+. In the anaerobic rumen environment, the transfer of electrons and protons, i.e. H2, must be to acceptors other than oxygen (Demeyer & Van Nevel, 1974; Russell & Wallace, 1997). In the presence of methanogens, this is normally CO2, which is reduced to CH4 (McAllister & Newbold, 2008; Figure 1.3). This process is termed ‘interspecies H2 transfer’ (Attwood & McSweeney, 2008; McAllister & Newbold, 2008) and the removal of H2 is considered to lead to nutritionally more favourable patterns of microbial fermentation compared with when H 2 is not removed (Janssen & Kris, 2008). The build-up of H2 within the rumen activates inhibitory feedback pathways, which slow the rate of microbial fermentation (Figure 1.3; McAllister et al., 1996). Therefore, although methanogens do not directly contribute to the digestion of fibre, the rate of plant fibre digestion is enhanced. The presence of methanogens effectively decreases the build-up of H2 and reduced cofactors (e.g. NADH) via interspecies H2 transfer (McAllister et al., 1996; Russell & Wallace, 1997). This is based on the belief that the only major sink for excess H2 in the rumen is CH4, with the assumption that H2 is not emitted from the rumen as a gas (Czerkawski, 1986; Van Soest, 1994). The evidence derived for this relationship, and the pathways of interspecies H2 transfer has largely been based on in vitro studies and is not well established in vivo.. 9.
(26) Chapter 1: Literature review. Figure 1.3: Hexose fermentation by Ruminococcus albus in the absence and presence of methanogens. In mono-culture, R. albus degrades glucose to acetate, ethanol, hydrogen (H2), and carbon dioxide (CO2). Hydrogen inhibits NAD+ (nicotinamide adenine dinucleotide) formation from NADH. In co-culture with methanogens, NADH is used to reduce protons to H2 and the final products are acetate and methane (CH4) (Fd = ferredoxin) (Miller, 1995).. 1.3.4 Methods to measure methane emissions Methods to measure CH4 emissions from ruminant livestock have been reviewed extensively in the literature, e.g. O’Hara et al. (2003), Vlaming (2008) and Pinares-Patiño and Clark (2008), and therefore, a focus on the advantages and disadvantages of two dominant methods used to measure CH4 emissions from ruminants will be examined. 1.3.4.1 Indirect calorimetry. Measurements of ruminant CH4 emissions have been undertaken using indirect calorimetry or respiration chambers techniques that calculated energy expenditure by the consumption of oxygen and expiration of CO 2. In contrast, direct calorimetry determines the energy expenditure of an animal by directly measuring heat production (Pinares-Patiño & Clark, 2008). Respiration chamber measurements have recently become the preferred technique to. 10.
(27) Chapter 1: Literature review. measure CH4 emissions from ruminants in New Zealand, and are considered to be the ‘gold standard’ against which other methods are compared (PinaresPatiño & Clark, 2008; Vlaming, 2008). This technique can either be closed or open circuit, with the open circuit systems being the most common (PinaresPatiño & Clark, 2008). Open circuit-systems involve the continuous flow of air through a chamber in which an animal is housed. The difference between CH4 in air entering and exiting the chamber, once adjusted for flow rate, allows the determination of CH4 emissions. In contrast, closed circuit chambers do not continuously pump air through the chamber. The air is circulated within the chamber and around and, air quality (humidity and temperature) and CO2 concentration is maintained by air conditioning and CO2 absorbents. Thus, the closed circuit chamber must not have any air leakage to ensure the accurate measurement of gas emissions. A distinct disadvantage of the closed circuit respiration technique is that despite the conditioning of the air gaseous emissions can only be measured for very short periods, as animals are at risk of running out of oxygen. A sample of air for gas analysis is taken at the start and end of the measurement period and therefore does not give a continuous measurement of gases whilst the animal is in the chamber. Because the total production of CH4 or other gases are measured and air quality is maintained indirect calorimetry is accurate and can be maintained for long periods (days). However, the disadvantage of this method is that it is labour intensive and expensive relative to the other indirect CH4 measurement techniques. However, due to the precision of measurements from respiration chambers, fewer animals per treatment group are required to ensure adequate statistical power. There is also concern that CH4 emissions are not representative of those from grazing animals and animal behaviour differences when animals are confined and fed conserved or freshly-cut forages. Partial enclosures, such as the use of masks or hoods, can also measure CH 4 emissions and the sample principles as those used with open circuit respiration chambers apply. The main disadvantage is that gas measurements are only made from the breath of the animal (Suzuki et al., 2007). Furthermore, measurements using masks is limited as animals unable to eat or drink.. 11.
(28) Chapter 1: Literature review. 1.3.4.2 Sulphur hexafluoride tracer technique. The SF6 technique was first developed by Johnson et al. (1994) and involves the placement of a permeation tube charged with SF6 liquid into the rumen of the animal. Sulphur hexafluoride is released from the permeation tube as a gas via the Teflon® membrane. The rate of SF6 gas release is determined by gravimetric weighing for at least two months prior to placement into the rumen, whilst permeation tubes are kept at 39°C (Lassey et al., 1997; 2001). Breath samples from the animal contain both SF6 and CH4 gases, and are collected continuously over a 24 hour period via equipment mounted on the animal’s head.. Samples are then stored in an evacuated plastic yoke worn by the. animal (as illustrated later in Chapters 2.3.3 and 4.3.5) and later analysed via gas chromatography (Lassey et al., 1997; 2001). Total CH4 production (QCH4; g/day) for each animal in a 24 hour period is calculated from the mixing ratio (μmol/mol) of SF6 to CH4 gas concentrations in the breath sample and the background concentrations of CH4 and SF6 (CbCH4 and CbSF6). These concentrations are expressed in relation to SF6 gas (μmol/day (QSF6)) release from the permeation tubes per day where MW is the molecular weight of the gases (Equation 1; Lassey et al., 1997; Grainger et al., 2008).. QCH4 = ((CCH4-CbCH4)/(CSF6 – CbSF6)) x QSF6 x (MW CH4 / MW SF6). Equation 1. Relative to indirect calorimetry, the SF6 method is less expensive as chambers are not required and measurements can be made from large numbers of grazing animals, which is important for the New Zealand pastoral system. However, this latter advantage is offset by the difficulty in determining the feed intake of grazing animals. The lack of accuracy in estimating DMI from grazing animals could mean that any small decrease in intake, due to the intensive handling of animals or to the wearing of breath collection equipment, will not detected, thereby diminishing the precision of calculated CH4 yield (CH4 expressed per unit of DMI). The accuracy of the SF6 technique to estimate CH4 emissions is reliant on several assumptions, which are: that the SF6 gas simulates the emissions of 12.
(29) Chapter 1: Literature review. CH4 and is uniformly mixed; dilution rates of SF6 and CH4 gases are identical; SF6 is inert; the release rate of gas from the permeation tube follows a constant linear pattern; and there are no interactions between rumen contents and SF 6 gas (Johnson et al., 1994; Ulyatt et al., 1999; Boadi et al., 2002; Vlaming et al., 2007; Pinares-Patiño & Clark, 2008). In addition, it is critical that the release rate of SF6 from the permeation tubes in the rumen is accurately determined.. 1.4 FACTORS EFFECTING ENTERIC METHANE PRODUCTION AND YIELD In the context of this thesis, CH4 emissions from ruminant enteric fermentation, are described in three ways; either as CH4 production (total CH4 produced per day; g/day); CH4 yield (total production per unit of dry matter intake; g/kg DMI; or CH4 as a % of GEI (CH4 energy as a percentage of gross energy intake). 1.4.1 Feed Intake Sheep and cattle fed conserved forage or grain-based diets increase CH4 production as intake increases, but decrease CH4 yield, in response to increasing DMI (Blaxter & Clapperton, 1965; Johnson et al., 1994; Lassey et al., 1997; Mbanzamihigo et al., 2002; Yan et al., 2009). The effect of decreasing CH4 yield is possibly driven by changes in rumen physiology i.e. rumen kinetics and rumen fill, that occur in response any increase in DMI (Weston, 1996). The relationship between CH4 production or yield and intake has been established primarily with conserved forages and appears to be highly variable. Attempts to consistently describe this relationship across a range of diets have been largely unsuccessful (Johnson & Johnson, 1995). Because differences in diet structure and proportions (i.e. forage vs. grain) can impact on the relationship between CH4 production or yield and intake (Johnson et al., 1993). Sheep and cattle fed fresh forages appear to have a similar relationship between CH4 yield and DMI, as discussed above with concentrate-based diets. Methane yields from lambs fed fresh perennial ryegrass-based pasture at four differing levels of intake (0.8, 1.2, 1.6 and 2.0 times maintenance energy 13.
(30) Chapter 1: Literature review. requirements) were found to decrease linearly (R2 = 0.66) when measured in respiration chambers, and DMI was shown to account for 69% of the variation (Knight et al., 2008a). Muetzel et al. (2009) fed ewes fed fresh pasture at various intake levels and reported CH4 yield to decrease by 5.3 g/kg DMI for every increase of DMI as a multiple of ME requirements for maintenance. In agreement with this, a review of New Zealand data on CH4 emissions from sheep and cattle fed indoors on fresh ryegrass-based pasture found that DMI explained 51% and 81% of CH4 production, when measured using either the SF6 technique or respiration chambers, respectively (Hammond et al., 2009). Increasing DMI reduced CH4 yield by 3.9 g CH4/kg DMI (SF6 technique) and 3.2 g CH4/kg DMI (respiration chambers) for each multiple of maintenance in sheep (Hammond et al., 2009). However, as reported with conserved and concentrate diets (Blaxter & Clapperton, 1965), the relationship between the DMI of fresh forages on CH4 yield varies markedly. Molano and Clark (2008) compared five differing levels of intake from sheep fed fresh pasture and found that CH4 production, when measured using the SF6 technique, increased with intake, but CH4 yield was not affected. This suggests that the relationship between CH4 yield and DMI is variable and not consistent between experiments. A better understanding of the relationships between DMI, CH4 yield, diet and digestive physiology are needed before CH4 emissions can be accurately described using DMI. 1.4.2 Chemical composition of the diet 1.4.2.1 Quantification and prediction of relationship between dietary chemical composition and CH4 yield. Attempts to mathematically describe the relationship between dietary chemical composition and CH4 yield have been undertaken in a number of studies with animals fed conserved forage and grain diets (e.g. Blaxter and Clapperton (1965), Holter and Young (1992) and Ellis et al. (2009)). However, these equations have not explained variations in CH4 yield due to diet alone, and cannot predicted CH4 yield from ruminants fed fresh forages (Waghorn & Woodward, 2006).. 14.
Figure


+7


Outline
Related documents
First, since debt up-side payoffs are bounded, debt is less sensitive to disagreement about asset value than equity and hence has a smaller resale option and lower price volatility
The model assumes that the interest-free banks will base their business - both with the capital demanding entrepreneurs and the capital providing depositors - mainly on
Combining PARPi with 5 MBq 177 Lu-DAB4 or chemotherapy increased tumour growth delay (Figure 6B) and significantly improved survival of mice (MST of 15 and 18 days for mice treated
Nitri fi cation and sedimentary denitri fi cation occurred near the river mouth, nitri fi cation prevailed further offshore under the plume, and fi nally, phytoplankton
Surface-immobilized and Atto565-labeled actin fila- ments (red; Upper ) and Atto488-labeled microtubules (red; Lower ) were incubated with phosphorylated ( A ) and dephosphorylated (
The proposed DIS supports services such as monitoring live gauges data, trip information, DTC scanning system, maintenance reminder, clock system and data logging system. The system
The theoretical developments in the derivation of the nuclear spin relaxation rates due to translational diffusion for a variety o f diffusion models with applicability to
