[Post-Print Version. This article was published in Information Economics and Policy, Vol. 18, Issue 1, March 2006, pp. 24-42. See the journal website at:
http://www.elsevier.com/wps/find/journaldescription.cws_home/505549/description#des cription ]
ICT Intensity and New Zealand’s Productivity Malaise:
Is the Glass Half Empty or Half Full?
Hans-Jürgen Engelbrecht* and Vilaphonh Xayavong
Department of Applied and International Economics Massey University
Palmerston North New Zealand
ABSTRACT
This paper contributes to the conflicting international evidence on the impact of information and communication technology (ICT) on labour productivity (LP) growth. We examine the link between ICT intensity and New Zealand’s LP growth in 29 industries over the period 1988-2003, and over relevant sub-periods. After deriving an ICT intensity index to classify industries into ‘more ICT intensive’ and ‘less ICT intensive’, we compare LP growth rates for these two industry categories. We also employ dummy variable regression models to more formally test the relationships between ICT intensity and LP growth. The results prove sensitive to the time period specified. When breaks in the data series are taken into account, there is support for the view that LP growth of more ICT intensive industries has improved over time relative to that of other industries, even though overall LP growth was weak. Lack of LP growth per se, therefore, is not necessarily evidence against the beneficial productivity impacts of ICT.
Key Words: Information and Communication Technology, Labour Productivity Growth, ICT Intensive Industries, New Zealand.
JEL classification: O47, O50 ____________
1. Introduction
The OECD has emphasized that information and communication technology (ICT) has been, and remains to be, an important driver of growth and productivity in its member countries (OECD, 2003a). Recent improvements in growth and productivity performance in the US and many other OECD countries have been linked to the expansion of the production of ICT goods and to the use of ICT to enhance efficiency and innovation (ibid.). A series of reports by the Australian National Office for the Information Economy (NOIE) also indicates that many industries in Australia seem to have gained substantial productivity benefits from the use of ICT.1 New Zealand (NZ) is in the leading group of countries as measured by ICT uptake indicators (OECD, 2003a, p. 10).2 Moreover, its reforms and policy changes implemented in order to stimulate the development of a knowledge-based economy seem to be heading in the right direction (Frederick and McIlroy, 1999). Indeed, NZ’s recent rate of economic growth has remained strong despite a worldwide downturn starting in early 2001 (Shapiro, 2003).3
However, there are concerns about NZ’s productivity performance. Scarpetta et al. (2000, p. 15) and OECD (2003b, p. 138) report that NZ’s productivity growth has been among the lowest in the OECD during the past two decades. Bar-Shira et al. (2003), comparing the productivity performance of the 25 richest economies, rank NZ at the bottom of that group in 1990. Despite a number of NZ studies indicating that productivity growth improved from 1993 onwards (Razzak, 2003; Black et al., 2003), Shapiro (2003) argues that it has not accelerated after 1995. Färe et al. (2003) and OECD (2004) also conclude that so far the productivity improvements have not been sufficient to generate the
1 See NOIE (2004). Other relevant Australian studies, using different methodologies, include
Parham et al. (2001) and Simon and Wardrop (2002).
2 ICT investment, however, has nevertheless been reported as being relatively low in NZ, mainly
due to modest expenditure on software (OECD, 2004, p. 34/5).
3 It should be noted that recent economic growth in NZ was mainly driven by rapid population
conditions for stronger trend growth in GDP per capita that would lift NZ back into the top half of the OECD, the stated goal of government policy.
Has something gone wrong? Have the economic reforms launched in 1984 failed? There are a large number of studies that have attempted to provide answers to these questions, but most of them have little to say about the contribution of ICT.4 This paper begins to fill this gap by examining the impact of ICT on NZ’s productivity performance for the period 1988-2003. Following Stiroh (2002a), our analysis focuses on labour productivity (LP) growth of industries that are classified as either more ICT intensive or less ICT intensive (compared to the average ICT intensity across all industries).5 We find that LP growth of more ICT intensive industries has improved over time relative to that of less ICT intensive industries, but that overall, LP growth has been weak. To put it differently, the restrained NZ LP performance seems to have been due to the decline in LP growth of less ICT intensive industries.6 This emphasizes the point we wish to make, i.e. that in many cases it is not productivity growth per se, but the relative productivity performance of more versus less ICT intensive industries that indicates the beneficial productivity impacts of ICT. In the extreme case, one could imagine a situation where for reasons unrelated to ICT, productivity growth for all industries in an economy is negative, but where the better relative performance of more ICT intensive industries still indicates the beneficial impacts of ICT.
The paper is structured as follows. Section 2 introduces the regression models used to assess the impact of ICT on LP growth. The selection of variables and data used to estimate LP is also discussed. Section 3 reports the methodology employed to determine
4 See Galt’s (2000) review of the NZ growth and productivity literature and the NZ Treasury’s
(2004) recent stocktaking of its work on the country’s growth performance and associated policy issues. The latter mentions ICT in one short paragraph (ibid, p. 62).
5 A number of studies of the impact of ICT have similarly focused on LP as a way of
circumventing the need for estimating ICT capital stocks at the industry level (Ark, 2002, p. 6).
6 This is similar to Ark et al.’s (2002) findings for the EU in their comparison of US and EU
the ICT intensity of the 29 industries included in the analysis. Section 4 presents our empirical findings. This is followed by a concluding section.
2.
The Impact of ICT on Labour Productivity Growth: Dummy
Variable Regression Models and Data
According to Schreyer (2000, pp. 6-8), ICT can contribute to productivity growth through three channels. First, technological progress in the production of ICT goods directly raises total factor productivity (TFP) of ICT-producing industries. Secondly, falling prices of ICT capital relative to other types of capital or labour encourage firms to substitute the former for the latter. In this way, an increase in investment in ICT capital contributes to LP growth in ICT-using industries through capital deepening effects, i.e. more capital per worker leads to an increase in LP. Thirdly, ICT may generate beneficial externalities, for example by improving business-to-business transactions through the Internet. Moreover, many other authors suggest that ICT generates externalities in the form of spillovers through efficiency gains in the production process, and through the accumulation of intangible organisational capital accompanying investment in ICT capital (Stiroh, 2002b; Basu et al., 2003). Such positive externalities, or spillover effects, can accelerate TFP growth in ICT-using industries.
Various studies have employed the standard neoclassical model to estimate the contribution of ICT to productivity growth.7 They include ICT capital as an explanatory variable in either the growth accounting or regression framework. However, Stiroh (2002b, pp. 42-46) has highlighted that if, as is likely, the neoclassical assumptions do not hold and there are, for example, production spillovers, these models provide poor estimates of the true relationship between ICT and productivity growth. Moreover, there may be problems due to omitted variables, the presence of embodied technological change, measurement error or reverse causality, all of which may introduce a positive link between ICT intensity and TFP growth which should be absent in a neoclassical world.
To avoid such problems, Stiroh (2002a,b) and Ark et al. (2002) calculate industry productivity growth rates and employ dummy variable regression models, including difference-in-difference models. ICT capital is not included as an explicit variable. Instead, they seek to explain variations in either LP growth or TFP growth across more ICT producing, (more intensively) ICT using and other industries (i.e. less intensively ICT using industries, or ‘non-ICT’ industries).
In this paper, we employ a similar methodology to that used by Stiroh (2002a). However, due to the relatively high level of aggregation of our industry data it is not possible to have separate ICT producing and ICT using industries. Therefore, the term ‘more ICT intensive industries’ covers both more intensively ICT using industries as well as ICT producing industries, though the former make up the majority of more ICT intensive industries.8 The remaining industries are classified as ‘less ICT intensive’. Stiroh (2002a) starts with the same approach as that adopted here, but is then able to drop ICT producing industries as part of his sensitivity analysis. In the case of NZ, the ICT producing sectors are less important compared to the US. However, as part of our sensitivity analysis we drop industries that contain ICT producing components. This is less precise compared to what Stiroh and Ark et al. did, but nevertheless enables us to obtain results that are clearly not mainly due to the influence of ICT producing sub-sectors.
Having calculated an industry-level ‘ICT intensity index’ (see section 3), we divide industries into more ICT intensive and less ICT intensive. We first calculate LP growth rates for each industry and also for the two aggregate industry categories. We then estimate three regression models based on dummy variable tests: Model (1) is used to analyse the growth rate of LP pre-1993 and post-19929; Model (2) is used to distinguish
8 Ark et al. (2002) find for their sample of 16 OECD countries that the key productivity
differences between Europe and the US are in intensive ICT (using and producing) services, not ICT goods producing industries. NZ is not included in their sample of countries.
9 Razzak (2003) also emphasizes the importance of accounting for structural breaks in the data
the growth rate of LP between more ICT intensive and less ICT intensive industries; and Model (3) is used to test the effect of ICT on LP growth for the two types of industries pre-1993 and post-1992. The models are as follows:
(1)
t i t
i D
LP
dln , =α0+α1 +ε, t i t
i ICT
LP
dln , =β0 +β1 +ε, (2)
dlnLPi,t =δ0+δ1D+δ2ICT +δ3D⋅ICT +εi,t (3)
Where i= 1, …, 29 indexes the 29 industries, and t= 1, …, 15, indexes the annual observations over the period 1988-2003. The variables and parameters are:
d ln LPi,t Annual growth rate of labour productivity (LP) of industry i. D Dummy variable equals 1 if t ≥ 1993 and D=0 otherwise.
ICT Dummy variable equals 1 if the industry is more ICT intensive and 0 otherwise.
α0 Mean growth rate of LP, pre-1993.
α0+α1 Mean growth rate of LP, post-1992.
α1 Change in mean growth rate of LP post-1992.
β0 Mean growth rate of LP for less ICT intensive industries, 1988-2003.
β0 +β1 Mean growth rate of LP for more ICT intensive industries, 1988-2003.
β1 Change in mean growth rate of LP for more ICT intensive industries,
1988-2003.
δ0 Mean growth rate of LP for less ICT intensive industries, pre-1993.
δ0+δ1 Mean growth rate of LP for less ICT intensive industries, post-1992.
δ1 Acceleration of the LP growth rate for less ICT intensive industries,
post-1992.
δ0+δ2 Mean growth rate of LP for more ICT intensive industries, pre-1993.
δ1+δ3 Acceleration of the LP growth rate for more ICT intensive industries,
post-1992.
δ0+δ2+δ1+δ3 Mean growth rate of LP for more ICT intensive industries, post-1992.
δ3 Differential acceleration (i.e. difference-in-difference) of the LP
growth rate for more ICT intensive industries relative to others. t
i,
ε Random error term.
Like Stiroh (2002a) we define LP as real output per full time equivalent (FTE) employee.10 Hours worked, instead of FTE employees, is usually the preferred measure of labour input, especially in cross-country comparisons, as it is a better proxy for workers’ effort in the production process (Ahmad et al., 2003). However, two-digit industry level hours worked data were not available. In principle, LP measurement can be based on either gross output or value added data. We mostly use LP measured with gross output data following the arguments raised by Stiroh (2002a, p. 1562) that use of value added data leads to biased estimates and incorrect inferences about production parameters.
To form LP growth series for the 29 two-digit industries covering the period 1988 to 2003, data are needed on real industry gross outputs and FTE employment. Most of the data used in this study are sourced from Statistics New Zealand.11 Data on nominal gross outputs are primarily drawn from a recently upgraded set of production accounts based on System of National Accounts 1993 (SNA 93) accounting standards, which introduces new methods, such as the chain-linking of constant price GDP series. It also incorporates new source data and methods, and uses industry categories in accordance with the Australian New Zealand Standard Industrial Classification (ANZSIC). Although a large number of changes have been made to the production accounts, the total effect on both
10 In NZ, FTE is defined as number of full-time (i.e. 30 hours work or more per week) employees
and working proprietors plus half the number of part-time employees and working proprietors.
11 Steve White of Statistics New Zealand kindly provided Excel files containing the national
the levels and patterns of annual changes of key measures such as GDP has, arguably, not been overly significant (Statistics New Zealand, 2000).
Production data are available for the period 1988 to 1999. Those for the period 2000 to 2003 had to be constructed. Industry real gross outputs are constructed using industry implicit price deflators, nominal intermediate consumption and value added. Data on FTE employment for 1997 to 2003 based on ANZSIC industry categories are drawn from Business Demography (BUD) Statistics. Industry FTE employment data from 1988 to 1996 according to the old NZIC industries have been adjusted to the ANZSIC categories. Appendix A of Engelbrecht and Xayavong (2004) provides detailed information on data construction and sources. It also contains the actual real industry gross output data (in 1995/96 prices), the FTE employment data, and the labour productivity index data used in our analysis.
3.
The ‘ICT Intensity Index’
The accuracy of the results reported in this study depends, among other things, on appropriately distinguishing more ICT intensive from less ICT intensive industries. Stiroh (2002a) uses ICT’s share of capital services in 1995 as the criterion, with industries above the mean value of this variable classified as ‘IT-intensive industries’. Faced with a lack of appropriate European industry-level data on ICT capital stocks, Ark et al. (2002), while introducing some modifications, adopt a similar industry classification to that developed by Stiroh (2002a). In this paper, we develop a NZ specific framework using our proxy measure of industries’ ICT intensity.
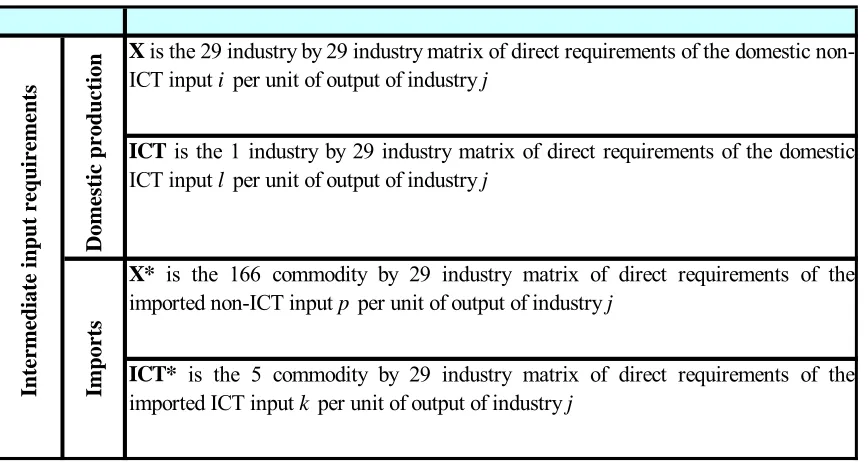
It is assumed that each industry can purchase ICT goods and services inputs from domestic producers and/or import them. Table 1 indicates the structure of intermediate input flows of our 29 industries. The matrices denoted ICT and X represent, respectively, the direct intermediate input requirements in terms of ICT and non-ICT commodities from domestic production. The matrices denoted ICT* and X* represent the direct intermediate input requirements of ICT and non-ICT commodities from imports.
Based on the structure of intermediate input flows, the sum of all direct intermediate inputs used by industry j ( Tj) can be expressed as follows:
∑
∑
∑
∑
= = = = + + + = K k kj P p pj L l lj J i ijj x ict x ict
T 1 * 1 * 1 1 (4)
Where x, ict, x*, and ict* represent the elements of the matrices defined in Table 1, and i,j=1, …,29 indexes the 29 industries, l=1,…,6 indexes the (domestic) ICT-producing industries (see Appendix Table 1), k=1,…5 indexes the five imported ICT commodities and p=1,…166 indexes the 166 imported non-ICT commodities (see Engelbrecht and Xayavong, 2004, Appendix Table B.3, for the lists of imported ICT and non-ICT commodities).
[TABLE 1]
Industry j’s ICT intensity index (Ij) is defined as direct ICT inputs to total inputs. It can
be expressed as follows:
⎟ ⎟ ⎟ ⎟ ⎠ ⎞ ⎜ ⎜ ⎜ ⎜ ⎝ ⎛ + ⎟ ⎟ ⎟ ⎟ ⎠ ⎞ ⎜ ⎜ ⎜ ⎜ ⎝ ⎛ =
∑
=∑
= j L l lj j K k kj j T ict T ictI 1 1
*
The first term on the right-hand side of equation (5) is the share of imported intermediate ICT inputs in total intermediate inputs of industry j; the second term is the share of domestically produced intermediate ICT inputs in total intermediate inputs of industry j.
The ICT intensity indices are calculated in two steps, using the aggregation and disaggregation techniques for input-output tables described in United Nations (1999, pp. 218-225). The first step is to derive the elements of matrices X and ICT. We aggregate the 1996 inter-industry transaction table of 126 industries (at the four-digit level) into 29 industries (at the two-digit level). Since six of the newly aggregated industries contain the 17 sub-groups of ICT-related industries classified at the four-digit level, we net them out to form the ICT-producing industry group. The employment shares of the 17 four-digit level ICT-related industries are used for this, as the preferred measure of gross output at basic prices is not available (Appendix Table 1 lists the ICT-related industries and their employment shares at the two digit-level). The second step is to derive the elements of matrices X* and ICT*. We aggregate the 1996 171 commodity by 126 industry import matrix into a 171 commodity by 29 industry matrix. We then divide the 171 commodities into two groups: ICT and non-ICT commodities.
It should be noted that adoption of the particular ICT intensity index described in this section is largely driven by data availability, i.e. we expect the index to be improved upon in future should ICT capital stock data become available. Never-the-less, our classification of industries into more ICT intensive and less ICT intensive is similar to those currently used by other authors, although with some NZ specific features (see below).
4.
Empirical Results4.1. Classifying Industries by ICT Intensity
into the two categories. If an industry’s percentage of intermediate ICT inputs is greater than the median for all industries, i.e. 4 %, it is classified as more ICT intensive (and vice versa for less ICT intensive industries). This classification is referred to below as ‘industry classification A’.
The last three columns in Table 2 indicate that our classification is broadly in line with those of Stiroh (2002a) and Ark et al. (2002). The latter differ from Stiroh’s and our approach to the extent that they classify a number of more ICT intensive services sectors as belonging to the less ICT intensive group because “they use relatively little capital anyway as value added largely consists of labor income” (ibid., p. 8). Ark et al. (2002) argue that this does not affect their main results.
All industries in the primary sector (industries 1-4) are initially classified as less ICT intensive,whereas most of those in the services sector (industries 16-29) are classified as more ICT intensive (except for the “Accommodation, Cafés and Restaurants” and “Property Services” industries). It is not surprising that “Communication Services” stands out as having the highest ICT intensity of any industry, ranking first both in the proportion of intermediate ICT inputs from domestic production and from imports.12 Amongst manufacturing industries, “Printing, Publishing and Recorded Media” and “Machinery and Equipment Manufacturing” are clearly more ICT intensive.
[TABLE 2]
It should be noted that the shares of ICT inputs for “Agriculture”, “Textiles and Apparel Manufacturing” and “Furniture and Other Manufacturing” are slightly below the median. Stiroh (2002a) and Ark et al. (2002) classify parts of the last two industries as ICT intensive. Moreover, agriculture is known to be more R&D and technology intensive in NZ compared to other OECD countries (Ministry of Economic Development, 2003). To
12 Its expenses on imported inputs are related to payments for international communication
see how these three industries might impact on our results, we include them in the more ICT intensive group as part of our robustness analysis. When they are included, the industry classification is referred to below as ‘industry classification B’.
4.2. Labour Productivity Growth Rates of More ICT Intensive Versus Less ICT
Intensive Industries
Table 3 provides a summary description of the LP performance of each industry over the period 1988 to 2003 as well as over the sub-periods 1988-92 and 1993-03. The wide disparities in LP growth rates between industries are striking, but they do not seem unusual compared to those in the US, Australia and other OECD countries (see Stiroh, 2002a, NOIE, 2004). More than two-thirds of industries have positive LP growth over the whole period (1988-03) and the 1993-03 sub-period (see LP columns 1-3, Table 3). There is, however, no acceleration of LP growth from the first to the second sub-period. Rather, average LP has either declined or stagnated, depending on whether the unweighted or weighted (i.e. the ‘Chained Fisher Indexed’) mean is calculated.13 The latter takes the influence of industry size into account.
[TABLE 3]
Comparing the means of LP growth rates for more ICT intensive and for less ICT intensive industries between our two sub-periods, it can be seen that for the former, LP growth has been fairly similar during both periods, whereas for the latter, there seems to have been a drastic decline in LP growth, thereby reversing the relative LP growth performances of the two categories of industries. It could be argued that the period 1988-92 is too short to provide a valid comparison with the period 1993-03. In that case, we would argue the reader should view the LP growth rate estimates for the period 1993-03 as more representative than those for the whole period 1988-03, given the structural break in the data. To sum up, the LP estimates reported in Table 3 suggest that there is some
13 The Fisher index is the geometric average of the Laspeyres and Paasche indexes. Chaining the
evidence that more ICT intensive industries are beginning to outperform less ICT intensive industries. This seems to hold irrespective of whether industry classification A or B is used.
It should also be noted that some of the industry patterns of our LP growth estimates for NZ seem closer to those observed for the EU in contrast to those observed for the US. Ark et al. (2002) highlight some key differences between EU and US LP growth experiences of more ICT intensive industries: During the second half of the 1990s, the US has shown much stronger productivity growth in, for example, retail and wholesale trade, but weaker LP growth in the telecommunications sector.14 Like for EU countries, NZ LP growth rates are relatively low for retail and wholesale trade, but very high for ‘Communications Services’.
We conducted further analyses to explore the fragility of the LP growth means reported in Table 3.15 Gordon (2000) argues that in the US, the impact of ICT on productivity growth is confined mainly to the ICT producing manufacturing sectors, i.e. the production of computer hardware, peripherals, and telecommunications equipment. Pilat et al. (2002) and Daveri (2003) report similar findings for other G7 economies, and Ark et al. (2002) for the EU.16 Although subsequent studies (e.g. Baily and Lawrence, 2001; Stiroh, 2002a) contradict Gordon’s (2000) findings and emphasize the positive role of ICT use for productivity growth in the US, there is a need to explore this issue in the NZ context. We, therefore, deleted industries that contain ICT producing sub-sectors and re-calculate the means. They differ little from the originally re-calculated ones. In short, the mean of the more ICT intensive industries seems mostly influenced by ICT use, not ICT production. These findings for NZ about the importance of ICT use are similar to those
14 Ark et al. (2002) find that strong productivity improvements in the US in retail/wholesale trade
and securities account for much of the overall US-EU productivity growth gap since 1995.
15 The detailed results are reported in Engelbrecht and Xayavong (2004).
16 Moreover, Edquist (forthcoming) finds that in the case of Sweden, not only was the “ICT
for the US (Stiroh, 2002a) and Australia (Parham et al., 2001). The major difference is, of course, that in contrast to NZ the latter two economies experienced a LP rival.17
We also calculated both unweighted and weighted value added based LP means. The results were very similar to those reported in Table 3. Finally, for comparative purposes we calculated LP means for the time periods used in Black et al. (2003). The interested reader is referred to Engelbrecht and Xayavong (2004).
4.3. Main Results: Dummy Variable Tests and Difference-In-Difference
Regressions
Using regression analysis we can test more formally whether the changes in LP growth rates documented in the previous section can be linked to ICT intensity. Estimation of models (1) to (3) tests statistically whether LP growth has declined from the earlier to the later period and whether the differences in the mean growth rates for more ICT intensive and less ICT intensive industries are statistically significant. Table 4 reports the regression results. The parameter estimates are obtained using a generalized least squares estimator for pooled data that corrects for within cross-section autocorrelation and heteroskedasticity.18 We also employ different specifications of the estimator and data sample.
Most of the parameter estimates reported in Table 4 are statistically significant and support our earlier results. The estimates for model 1 suggest that there is indeed a break in the data, i.e. LP growth rates decline post-1992. This is confirmed by the unweighted regression estimate for α1 shown in column I and by the weighted regression estimate in
17 Pilat et al. (2002) also report that Ireland and Mexico experienced a strong pick-up in LP
growth in ICT-using industries in the 1990s. In contrast, Jalava and Pohjola (2002) report results for Finland that have some intriguing similarities to the NZ case. They show that the contribution of ICT use to output growth has increased from the early to the late 1990s, but that, like in the NZ case, there has been no acceleration in the trend rate of LP growth.
column V. The latter is obtained after deleting outliers, thereby improving on the estimate reported in column III.
[TABLE 4]
When testing for the difference between the mean growth rate of LP for more ICT intensive industries versus that for less ICT intensive industries (model 2) over the entire sample period 1988-03, a mixed picture emerges, depending on which industry classification and estimator is used. In case of industry classification A (see the regressions in columns I, III, V), both the unweighted and weighted regression estimates show that the mean growth rate of LP for more ICT intensive industries is lower than that for less ICT intensive industries (compare the estimates for β0+β1 with those for β0).
Moreover, it seems to decline over time (the estimates for β1 are negative). In contrast,
when the ‘borderline’ more ICT intensive industries ‘Agriculture’, ‘Textiles and Apparel Manufacturing’ and ‘Furniture and Other Manufacturing’ are included as more ICT intensive in the weighted regressions (columns IV and VI, industry classification B), the mean growth rate of LP for more ICT intensive industries appears to be higher than that for other industries, plus it seems to have increased over time.
Estimates for the entire sample period may be misleading because of the break in the data in 1992/93. Therefore, model 2 is extended in such a way that estimates for the two types of industries are split into pre-1993 and post-1992 (model 3). The results for model 3 must be interpreted carefully since they are for two dummy variables and an interaction term. The results suggest that the LP growth rate for less ICT intensive industries declines greatly from the earlier to the latter period (see the first three rows of estimates for model 3). The drop in the LP growth rate is statistically significant in all regressions (see the estimates for δ1). For more ICT intensive industries, the estimates suggest, on
balance, the opposite. The post-1992 LP growth rate estimates are larger than the pre-1993 estimates, and the increase in the LP growth rate, i.e. the estimate for δ1+δ3, is
estimates. It exhibits the strongest LP growth of any industry and is by far the most ICT intensive (see Table 2).
The (difference-in-difference) estimates for δ3 on the whole confirm that, after 1992, the
LP growth rate for more ICT intensive industries accelerates relative to that for less ICT intensive industries. This result is clearest when industry classification A is used. Again, the effect of deleting industries 14 and 20 is not surprising. When industry classification B is used, the results are more mixed: δ3 is positive and statistically significant in the
unweighted regression, but in the weighted regression only when the two outliers are deleted.
However, further sensitivity analysis of the results reported in Table 4 seems to confirm our main conclusions. Firstly, we explore more formally than is done in Section 3 whether our results are mainly due to ICT producing manufacturing and services sub-sectors, in contrast to heavily ICT using industries. We start by deleting industry 12 (which contains ICT manufacturing sub-sectors) from weighted regressions for both industry classifications. The results are very similar to those reported in columns III and IV, Table 4. Next, we delete all industries that include ICT goods and services components. The qualitative results are little changed. The detailed regression results and an extended discussion are provided in Engelbrecht and Xayavong (2004). Secondly, as suggested by a referee, we explore the influence on our estimates of the three primary sector industries that show great changes in productivity growth between our two periods, i.e. fishing, forestry & logging, and mining & quarrying (see Table 3). The results only strengthen our main conclusions about the differential LP performance of more ICT versus less ICT intensive industries (for example, in five out of six additional regressions the estimate for δ3 is positive and statistically significant). The detailed results are available from the authors.
5.
Summary and Concluding Comments
derived using NZ specific data. That enables us to divide industries into more ICT intensive and less ICT intensive. Some special features of the NZ economy, such as the relative high ICT intensity of the agricultural industry, are also considered. While many factors are likely to have influenced LP growth, or lack thereof, in NZ, our analysis suggests that LP growth of more ICT intensive industries has improved relative to that of other industries.
Like in much of the research on the role of ICT in productivity growth, the meaning of our results lies in the eyes of the beholder. If, as argued by David (1990), it takes as long to realize the potential productivity increases from ICT as it did to realize the ones from electricity (i.e. four decades or more), one may argue that in the case of NZ, the productivity turn-up from large ICT investments is just around the corner, with the differential LP performance of more ICT intensive versus less ICT intensive industries during the period 1993-2003 being an early sign of this.
However, it is one thing to show some correlation between LP growth and relative ICT intensity, another to determine how much productivity growth can be attributed to technological, organizational and managerial innovations associated with ICT. Moreover, like in the case of the findings for EU economies reported by Ark et al. (2002), further research is required to assertion whether our results are mainly due to measurement issues, such as the (mis)-measurement of some services industries outputs, as compared to economic factors.19 It is one of the great paradoxes of the knowledge-based and new
economy that it has become much more of an unknown economy compared to the industrial economy preceding it (Engelbrecht, 2003).
In short, our results cannot be taken as conclusive evidence that ICT is having a positive impact on LP in NZ. Rather, they are suggestive of this and have to be strengthened by further research. This may include the following: (i) Further research on the ICT intensity index: Data for more than one year could be used to derive the index, and to determine how it may have changed over time. Moreover, alternative indices should be explored,
19 See also Ahmad et al. (2003), who discuss how measurement problems may affect international
including use of a ‘total’ ICT intensity index that takes the amount of ICT embodied in non-ICT inputs into account instead of just measuring the direct use of ICT inputs. This would shed further light on the question whether our division of industries into more ICT intensive and less ICT intensive is appropriate. (2) There is a need for more firm-level studies that can complement those at the economy-wide and industry level. In particular, such studies have highlighted the importance of complementary organizational investments, e.g. restructuring of business processes and work practices, as a pre-requisite for unlocking the potential of ICT for productivity improvements (Brynjolfsson and Hitt, 2000). Firm-level studies seem to find stronger ICT impacts on output and productivity growth (Ark, 2002). While some survey-based NZ-specific studies exist (Knuckey et al., 2002, chapter 10), a lack of appropriate ICT investment, intangible investment and capital stock data has hampered research. (3) The relationship between LP and TFP for more ICT intensive versus less ICT intensive industries should be explored. However, NZ data problems are likely to hamper such efforts. For example, Razzak (2003) argues that TFP, in contrast to LP, is an unreliable measure of productivity in the NZ case. (4) Related to (3), there is a need to explicitly estimate ICT-related inter-industry spillovers. However, this would require the availability of inter-industry-level ICT capital stocks.
One may speculate to what extent our LP growth estimates are affected by NZ’s low capital-labour ratio.20 Has low physical capital accumulation suppressed LP growth
across the economy? Would more ICT intensive industries have shown an acceleration in LP growth in absolute terms had only the capital-labour ratio increased instead of being stagnant? The NZ Treasury view that the best bet for increasing the country’s growth performance in the medium term is through capital deepening that raises LP (Treasury, 2004, p. 48) seems to fit this hypothesis, although a thorough investigation of this question would have to address differences in the type of physical capital accumulation
20 For evidence of NZ’s low capital-labour ratio during the 1990s compared to Australia’s, see
(i.e. ICT capital versus non-ICT capital), human capital accumulation, the role of embodied and disembodied knowledge spillovers, and the possible interactions of these and other growth determinants. It might raise some awkward questions about the productivity impact of the Employment Contracts Act that liberalized the labour market and that was in force during most of the 1990s (see Maloney, 1998), but other explanations of the stagnant capital-labour ratio are also possible.
Raising productivity growth is seen as the main economic challenge facing NZ (OECD, 2004). There is already some indication that LP growth accelerated from the first to the second half of the 1990s.21 We would like to interpret our findings as a piece of supporting evidence for the optimistic view that measurable LP improvements are in the pipeline, i.e. that the fruits of past economic reforms, present growth promoting policy settings and intangible organizational capital accumulation related to the use of ICT take time to materialize, but that they will eventually materialize, thereby lifting NZ’s economic performance. Only time will tell whether this view is correct.
21 See OECD (2003b, p. 134), who report aggregate growth rates of GDP per hour worked for the
Table 1: Intermediate Input Requirements Matrices
Xis the 29 industry by 29 industry matrix of direct requirements of the domestic
non-ICT input i per unit of output of industry j
ICT is the 1 industry by 29 industry matrix of direct requirements of the domestic
ICT input l per unit of output of industry j
X* is the 166 commodity by 29 industry matrix of direct requirements of the
imported non-ICT input p per unit of output of industry j
ICT* is the 5 commodity by 29 industry matrix of direct requirements of the
imported ICT input k per unit of output of industry j
Domestic production
Imports
Table 2: ICT Intensity of Industries
Ij This study Stiroh
(2002a)
Ark et al.
(2002)
1 Agriculture 0.0% 3.9% 3.9% No No No
2 Fishing 0.0% 3.1% 3.1% No No No
3 Forestry and Logging 0.0% 3.6% 3.6% No No No
4 Mining and Quarrying 0.1% 2.9% 3.0% No No No
5 Food, Beverage and Tobacco 0.3% 1.8% 2.0% No No/Yes No
6 Textiles and Apparel Manufacturing 0.5% 3.5% 4.0% No No/Yes No/Yes
7 Wood and Paper Products Manufacturing 0.1% 2.3% 2.4% No No No
8 Printing, Publishing and Recorded Media 0.5% 4.1% 4.6% Yes Yes Yes
9 Petroleum, Chemical, Plastics and Rubber Products Manufacturing
0.3% 3.0% 3.3% No No No
10 Non-Metallic Mineral Products Manufacturing
0.1% 3.0% 3.1% No No No
11 Metal Product Manufacturing 0.1% 3.3% 3.4% No No No
12 Machinery and Equipment Manufacturing 0.8% 4.5% 5.3% Yes Yes Yes
13 Furniture and Other Manufacturing 0.4% 3.4% 3.9% No No/Yes No/Yes
14 Electricity, Gas and Water Supply 0.0% 2.2% 2.2% No No No
15 Construction 0.1% 2.9% 3.0% No No No
16 Wholesale Trade 0.8% 5.8% 6.6% Yes Yes Yes
17 Retail Trade (including motor vehicle repairs)
0.0% 5.0% 5.1% Yes Yes Yes
18 Accommodation, Cafes and Restaurants 0.0% 3.0% 3.0% No No No
19 Transport and Storage 0.1% 6.2% 6.4% Yes No/Yes No
20 Communication Services 14.5% 14.0% 28.6% Yes Yes Yes
21 Finance, Insurance 0.2% 6.0% 6.2% Yes Yes Yes
22 Property Services 0.0% 1.7% 1.7% No No No
23 Ownership of Owner Occupied Dwellings 0.2% 4.0% 4.2% Yes Yes Yes
24 Business Services 2.0% 7.9% 9.9% Yes Yes No/Yes
25 Government 0.8% 7.1% 7.9% Yes n.a. No
26 Education 0.3% 6.1% 6.4% Yes Yes No
27 Health and Community Services 0.0% 5.1% 5.1% Yes Yes No
28 Cultural and Recreational Services 3.3% 8.0% 11.3% Yes n.a. No
29 Personal and Other Community Services 0.0% 6.1% 6.1% Yes n.a. No
Median 0.1% 3.9% 4.0%
Is the industry more or less ICT
intensive?*
Industry ICT Intensity Index
j 5 1 k * kj T ict ∑ = j 17 1 l lj T ict ∑ =
Table 3: Gross Output Based Labour Productivity Growth Rates
Annual Growth Rate (%) Acceleration 1988-92 1993-03 1988-03 1993-03 less
1988-92
1 Agriculture 2.98 1.85 2.15 -1.13 No
2 Fishing 9.52 -1.89 1.16 -11.41 No
3 Forestry and Logging 8.40 -1.31 1.28 -9.71 No 4 Mining and Quarrying -1.75 3.44 2.05 5.19 No 5 Food, Beverage and Tobacco Manufacturing 3.57 1.80 2.27 -1.77 No 6 Textiles and Apparel Manufacturing 1.43 2.16 1.96 0.73 No 7 Wood and Paper Products Manufacturing 3.06 1.47 1.89 -1.60 No 8 Printing, Publishing and Recorded Media -2.59 -1.02 -1.44 1.56 Yes 9 Petroleum, Chemical, Plastics and Rubber Products
Manufacturing
7.28 3.53 4.53 -3.75 No
10 Non-Metallic Mineral Products Manufacturing 2.73 0.77 1.29 -1.96 No 11 Metal Product Manufacturing 2.20 0.77 1.15 -1.43 No 12 Machinery and Equipment Manufacturing -0.48 1.43 0.92 1.91 Yes 13 Furniture and Other Manufacturing -2.14 -0.61 -1.02 1.52 No 14 Electricity, Gas and Water Supply 9.63 8.97 9.15 -0.66 No 15 Construction -2.68 -0.98 -1.43 1.70 No 16 Wholesale Trade -0.01 0.60 0.44 0.61 Yes 17 Retail Trade (including motor vehicle repairs) 0.24 0.93 0.74 0.69 Yes 18 Accommodation, Cafes and Restaurants -6.89 -2.97 -4.01 3.93 No 19 Transport and Storage 4.99 3.47 3.88 -1.52 Yes 20 Communication Services 17.13 10.87 12.54 -6.27 Yes 21 Finance, Insurance 3.69 4.52 4.30 0.82 Yes 22 Property Services -3.08 0.39 -0.54 3.47 No 23 Ownership of Owner Occupied Dwellings -1.98 -3.27 -2.93 -1.29 Yes 24 Business Services -2.86 -1.62 -1.95 1.25 Yes
25 Government 0.95 1.61 1.43 0.65 Yes
26 Education 1.42 0.42 0.68 -1.00 Yes
27 Health and Community Services 4.00 2.51 2.91 -1.48 Yes 28 Cultural and Recreational Services -0.92 -1.17 -1.10 -0.25 Yes 29 Personal and Other Community Services -2.29 1.08 0.18 3.37 Yes
1988-92 1993-03 1988-03 Acceler.
Mean of LP growth, all industries 1.92 1.30 1.47 -0.61
Mean for less ICT intensive industries 2.28 1.16 1.46 -1.12 Industry Mean for more ICT intensive industries 1.52 1.45 1.47 -0.07 Classification A Mean for less ICT intensive industries 2.67 1.17 1.57 -1.50 Industry Mean for more ICT intensive industries 1.39 1.40 1.39 0.01 Classification B
1988-92 1993-03 1988-03 Acceler.
Mean of LP growth, all industries 1.25 1.25 1.25 0.00
Mean for less ICT intensive industries 2.35 1.18 1.49 -1.18 Industry Mean for more ICT intensive industries 1.18 1.47 1.39 0.29 Classification A Mean for less ICT intensive industries 2.14 1.02 1.32 -1.12 Industry Mean for more ICT intensive industries 1.26 1.38 1.35 0.12 Classification B
Is the industry more
ICT intensive?
Gross output based productivity (unweighted means)
Gross output based productivity (Chained Fisher Indexed means)
Table 4: Regression Estimates of the Relationship Between ICT Intensity and Labour Productivity Growth: Models 1 to 3, 1988-2003.
I II III IV V VI
Industry Classification A B A B A B
Estimation Method Unweighted regression Unweighted regression Weighted regression Weighted regression Weighted regression Weighted regression Model 1
α0 1.636*** 1.136*** 1.144***
(0.138) (0.102) (0.127)
α0+α1 1.133*** 1.035*** 0.872***
(0.079) (0.060) (0.148)
α1 -0.503*** -0.101 -0.272*
(0.161) (0.120) (0.147)
R-squared 0.59 0.64 0.49
Number of Observations 435 435 405
Model 2
β0 1.539*** 1.593*** 1.290*** 0.423* 1.162*** 0.379*** (0.069) (0.240) (0.060) (0.237) (0.058) (0.114)
β0+β1 0.832*** 1.001*** 0.852*** 1.308*** 0.547 1.140***
(0.137) (0.186) (0.106) (0.204) (0.377) (0.146)
β1 -0.707*** -0.592 -0.437*** 0.885** -0.615* 0.743*** (0.163) (0.406) (0.140) (0.435) (0.356) (0.219)
R-squared 0.72 0.63 0.77 0.72 0.67 0.36
Number of Observations 435 435 435 435 405 405
Model 3
δ0 2.496*** 3.491*** 1.738*** 1.082** 1.629*** 0.858*** (0.144) (0.294) (0.124) (0.442) (0.821) (0.231)
δ0+δ1 1.184*** 1.000*** 1.142*** 0.246 1.000*** 0.267**
(0.085) (0.173) (0.071) (0.260) (0.056) (0.123)
δ1 -1.312*** -2.491*** -0.596*** -0.836* -0.629*** -0.591** (0.168) (0.344) (0.144) (0.507) (0.097) (0.264)
δ0+δ2 0.196 0.158 0.499** 0.880** 0.348 0.869***
(0.292) (0.323) (0.231) (0.406) (0.595) (0.284)
δ0+δ2+δ1+δ3 1.033*** 1.274*** 0.963*** 1.450*** -0.104 1.222***
(0.376) (0.460) (0.224) (0.663) (0.555) (0.368)
δ1+δ3 0.837** 1.116*** 0.464* 0.570 -0.452 0.353
(0.328) (0.378) (0.269) (0.462) (0.671) (0.332)
δ3 2.149*** 3.607*** 1.060*** 1.406 0.829 0.944*
(0.320) (0.641) (0.321) (0.947) (0.644) (0.521)
R-squared 0.70 0.64 0.71 0.65 0.80 0.38
Number of Observations 435 435 435 435 405 405
Notes: The dependent variable is the annual growth rate of labour productivity. Estimates reported in column I were obtained using pooled regression and industry classification A; those in column II using pooled regression and industry classification B. Estimates in column III were obtained using the square roots of employment as weights in I; those in column IV using the square roots of employment as weights in II. Regressions reported in column V drop industries 14 and 20 from III. Regressions in column VI drop industries 14 and 20 from IV.
Appendix Table 1:
The 17 Four-Digit Level ICT Producing Industries making up the ICT Sector and their Employment Shares at the Two-Digit Level
ANZSIC 12 Machinery and Equipment Manufacturing
List of ICT-producing industries used for disaggregation
Professional and Scientific Equipment Manufacturing nec C283900
Computer and Business Machine Manufacturing C284100
Telecommunication, Broadcasting and Transceiving Equipment Manufacturing C284200
Electronic Equipment Manufacturing nec C284900
Electric Cable and Wire Manufacturing C285200
Share of Employment of ICT-producing industries used for disaggregation 10.5%
ANZSIC 16 Wholesale Trade
List of ICT-producing industries used for disaggregation
Professional Equipment Wholesaling F461200
Computer Wholesaling F461300
Business Machine Wholesaling nec F461400
Electrical and Electronic Equipment Wholesaling nec F461500
Share of Employment of ICT-producing industries used for disaggregation 17.0%
20 Communication Services
List of ICT-producing industries used for disaggregation
Telecommunication Services J712000
Share of Employment of ICT-producing industries used for disaggregation 38.9%
23 Machinery and Equipment Hiring and Leasing
List of ICT-producing industries used for disaggregation
Renting of Office Machinery and Equipment (including Computer) L774300
Share of Employment of ICT-producing industries used for disaggregation 57.3%
24 Business Services
List of ICT-producing industries used for disaggregation
Data Processing Services L783100
Information Storage and Retrieval Services L783200
Computer Maintenance Services L783300
Computer Consultancy Services L783400
Share of Employment of ICT-producing industries used for disaggregation 9.3%
28 Cultural and Recreational Services
List of ICT-producing industries used for disaggregation
Radio Services P912100
Television Services P912200
Share of Employment of ICT-producing industries used for disaggregation 15.8%
ICT-producing manufacturing industries
ICT-producing service industries
References:
Ahmad, N., Lequiller, F., Marianna, P., Pilat, D., Schreyer, P. and Wölfl, A., 2003, Comparing labour productivity growth in the OECD area: the role of measurement, STI Working Paper 2003-14, Directorate for Science, Technology and Industry, OECD, Paris.
Ark, B. van, 2002, Measuring the New Economy: an international comparative perspective, Review of Income and Wealth 48 (1), 1-14.
Ark, B. van, Inklaar, R. and McGuckin, R., 2002, “Changing gear” - productivity, ICT and services industries: Europe and the United States, Research Memorandum GD-60, Groningen Growth and Development Centre, University of Groningen, Groningen. www.eco.rug.nl/ggdc/pub/ online/gd60(online).pdf
Australian Bureau of Statistics, 1996, Australian and New Zealand standard commodity classification (ANZSCC), Canberra.
http://www.abs.gov.au/AUSSTATS/abs%40.nsf/66f306f503e529a5ca2569 7e0017661f/c38a4791eaf4d269ca25697e00184c58!OpenDocument
Baily, M. N. and Lawrence, R., 2001, Do we have a New E-conomy?, The American Economic Review – Papers and Proceedings 91(2), 308-312.
Bar-Shira, Z., Finkelshtain, I. and Simhon, A., 2003, Cross-country productivity comparisons: the “revealed superiority” approach, Journal of Economic Growth 8(3), 301-323.
Basu, S., Fernald, J., Oulton, N. and Srinivasan, S., 2003, The case of the missing productivity growth: or, does information technology explain why productivity accelerated in the United States but not the United Kingdom?, NBER Working Paper 10010, Cambridge, MA.
Brynjolfsson, E. and Hitt, L., 2000, Beyond computation: information technology, organizational transformation and business performance, Journal of Economic Perspectives 14 (4), 23-48.
David, P., 1990, The dynamo and the computer: an historical perspective on the modern productivity paradox, American Economic Review - Papers and Proceedings 80(2), 355-361.
Daveri, F., 2003, Information technology and productivity growth across countries and sectors, in: D. Jones, ed., New Economy Handbook (Elsevier/Academic Press, San Diego and London) 101-120.
Diewert, E. and Lawrence, D., 1999, Measuring New Zealand’s productivity, Working Paper 99/5, The Treasury, Wellington.
http://www.treasury.govt.nz/workingpapers/1999/95-5.asp
Edquist, H. (forthcoming), The Swedish ICT miracle – myth or reality?, Information Economics and Policy.
Engelbrecht, H.-J., 2003, Data issues in the New Economy, in: D. Jones, ed., New Economy Handbook (Elsevier/Academic Press, San Diego and London) 57-76.
Engelbrecht, H.-J. and Xayavong, V., 2004, Information and communication technology and New Zealand’s productivity malaise: an industry-level study, Department of Applied and International Economics Discussion Paper No. 04.05, College of Business, Massey University, Palmerston North. http://econ.massey.ac.nz/publications/discuss/dp04-05.pdf
Färe, R., Grosskopf, S. and Margaritis, D., 2003, Productivity growth in New Zealand: 1978-1998, New Zealand Economic Papers 37(1), 93-118.
Frederick, H. and McIlroy, D., 1999, The knowledge economy, Submission to the New Zealand Government by the Minister for Information Technology's IT Advisory Group.
Galt, D., 2000, New Zealand’s economic growth, Working Paper 00/09, The Treasury, Wellington.
http://www.treasury.govt.nz/workingpapers/2000/00-09.asp
Gordon, R., 2000, Does the “New Economy” measure up to the great inventions of the past?, Journal of Economic Perspectives 14(4), 49-74.
IMF, 2003, New Zealand selected issues, IMF country report 03/122, International Monetary Fund, Washington, DC.
Knuckey, S., Johnston, H., Campbell-Hunt, C., Carlaw, K., Corbett, L. and Massey, C., 2002, Firm foundations 2002: a study of New Zealand business practices & performance (Ministry of Economic Development, Wellington).
http://www.med.govt.nz/irdev/ind_dev/firm-foundations/ index.html Jalava, J. and Pohjola, M., 2002, Economic growth in the New Economy: evidence from
advanced countries, Information Economics and Policy 14(2), 189-210. Maloney, T., 1998, Five years after: the New Zealand labour market and the Employment
Contracts Act (Institute of Policy Studies, Victoria University of Wellington, Wellington).
Ministry of Economic Development, 2003, Growth and innovation framework: Benchmark indicators report 2003, Wellington.
http://www.med.govt.nz/irdev/econ_dev/growth-innovation/progress-2003/benchmark/
NOIE, 2004, Productivity growth in Australian manufacturing, NOIE Occasional Economic Paper, The National Office for the Information Economy, Canberra. http://www.noie.gov.au
OECD, 2002, Measuring the information economy 2002, Paris.
OECD, 2003a, Seizing the benefits of ICT in a digital economy (Meeting of the OECD Council at Ministerial Level 2003, Paris). http://www.oecd.org/dataoecd/43/42/2507572.pdf
OECD, 2004, OECD economic surveys: New Zealand, volume 2003, supplement 3, Paris.
Parham, D., Roberts, P. and Sun, H., 2001, Information technology and Australia’s productivity surge, Staff Research Paper, Productivity Commission, Canberra. http://www.pc.gov.au/research/staffres/itaaps/
Pilat, D., Lee, F. and van Ark, B., 2002, Production and use of ICT: a sectoral perspective on productivity growth in the OECD area, OECD Economic Studies 35, 47-78.
Razzak, W., 2003, Towards building a new consensus about New Zealand’s productivity, Department of Labour, Wellington. http://www.dol.govt.nz/publication-view.asp?ID=139
Scarpetta, S., Bassanini, A., Pilat, D. and Schreyer, P., 2000, Economic growth in the OECD area: Recent trends at the aggregate and sectoral level, Economics Department Working Papers No. 248, OECD, Paris.
Schreyer, P., 2000, The contribution of information and communication technology to output growth: a study of the G7 countries, STI Working Paper 2000/2, OECD, Paris.
Shapiro, M., 2003, Has the rate of economic growth changed? Evidence and lessons for public policy, Discussion Paper DP2003/07, Reserve Bank of New Zealand, Wellington. http://www.rbnz.govt.nz/research/discusspapers/
dp03_07.pdf
Simon, J. and Wardrop, S., 2002, Australian use of information technology and its contribution to growth, Research Discussion Paper 2002-02, Economic Research Department, Reserve Bank of Australia, Canberra.
Statistics New Zealand, 2000, Hot off the press, upgraded national accounts 2000, commentary notes, Wellington.
Stiroh, K., 2002a, Information technology and the U.S. productivity revival: what do the industry data say?, American Economic Review 92(5), 1559-1576.
Stiroh, K., 2002b, Are ICT spillovers driving the New Economy?, Review of Income and Wealth 48(1), 33-57.
Treasury, The, 2004, New Zealand economic growth: an analysis of performance and policy, Wellington. http://www.treasury.govt.nz/release/economicgrowth/ United Nations, 1999, Handbook of national accounting: input-output table compilation
and analysis, Series F, No. 74 (E99.XVII.9) (United Nations Statistics Division, New York).
MASSEY UNIVERSITY
MASSEY RESEARCH ONLINE http://mro.massey.ac.nz/
Massey Documents by Type Journal Articles
ICT Intensity and New Zealand's
Productivity Malaise: Is the Glass Half
Empty or Half Full?
Engelbrecht, Hans-Juergen
2006-03-01http://hdl.handle.net/10179/9615