
Statistics on science and technology in Europe Data 1985 1999 2000 ed
180
0
0
Full text
(2) Our mission is to provide the European Union with a high-quality statistical information service Eurostat's collections are adapted to the needs of all users. You will find them in each of the nine themes proposed by Eurostat.. 55. 1 General statistics. W. ffiO. 2 Economy and finance. ¿ 3 L ~ 7 Transport. Qjßjß. 3 Population and social conditions. 8 Environment and energy. 4 Industry, trade and services. 9 Science and technology. 6 External trade. 5 Agriculture and fisheries. Content Press releases: Eurostat publishes around 100 press releases every year in connection with the release of new data. The press releases include the key figures on the EU, the Member States and their partners. They are provided free of charge. They are also available on the Internet as soon as they are published: www.europa.eu.int/comm/eurostat/. IB. Format Paper Html PDF. Statistics in focus: This collection is published regularly by Eurostat and provides up-to-date summaries of the main results of statistical surveys, studies and analyses. It covers all themes and consists of about four to eight pages per issue. Eurostat issues around 150 Statistics in Focus per year. Available as single copies or on subscription.. HH. Paper PDF. Key i n d i c a t o r s : This collection provides the main indicators on a theme or sub-theme in an easy-to-carry booklet of up to 100 pages. Available as single copies or on subscription.. HB. Paper Html. Panorama of t h e European Union: This collection highlights the features and trends of a multi-sectoral theme or a sectoral sub-theme. The publications consist of around 200 pages and Include analysis as well as tables and graphs. Available as single copies or on subscription.. m ·:·: ;:. Methods and nomenclatures are intended for specialists who want to consult the methodologies and nomenclatures used for a theme, a sub-theme or a sector. Available as single copies. Detailed tables are intended for specialists. They present part, or all, of the statistical data compiled on a theme, sub-theme or sector. Available as single copies or on subscription.. Paper CD-ROM. Paper CD-ROM. HB. Paper CD-ROM. Studies and research summarise the results of European statistical studies and research and are intended for specialists. Available as single copies or on subscription.. Paper CD-ROM. Catalogues provide rapid access to concise information on Eurostat's products and services. They are free of charge and include the Mini guide, a selection of Eurostat products and services, and Statistical references, the quarterly newsletter on Eurostat's latest products and services.. Paper.
(3) Û LU O. o o fsi. Statistics on Science and Technology ¡n Europe Data 19851999. * *. *. ■. EUROPEAN. COMMISSION. WÚ. $3£Ά. eurOStat Κ ι. ■. and technology.
(4) Immediate access to harmonized statistical data Eurostat. Data. Shops:. A personalised data retrieval service In order to provide the greatest possible number of people with access to high-quality statistical information, Eurostat has developed an extensive network of Data Shops ('). Data Shops provide a wide range of tailor-made services: *. immediate information searches undertaken by a team of experts in European statistics;. *. rapid and personalised response that takes account of the specified search requirements and intended use;. *. a choice of data carrier depending on the type of information required.. Information can be requested by phone, mail, fax or e-mail. (1) See list of Eurostat Data Shops at the end of the publication.. Internet Essentials on Community statistical news *. Euro indicators: more than 100 indicators on the euro-zone; harmonized, comparable, and free of charge;. *. About Eurostat: what it does and how it works;. *. Products and databases: a detailed description of what Eurostat has to offer;. *. Indicators on the European Union: convergence criteria; euro yield curve and further main indicators on the European Union at your disposal;. *. Press releases: direct access to all Eurostat press releases.. For further information, visit us on the Internet at: W W W . e u r o p a . e U . i n t / C O m m / e u r O S t a t /. A great deal of additional information on the European Union is available on the Internet. It can be accessed through the Europa server (http://europa.eu.int). Cataloguing data can be found at the end of this publication. Luxembourg: Office for Official Publications of the European Communities, 2001 ISBN 92-894-0176-1 © European Communities, 2001 Printed in France PRINTED ON WHITE CHLORINE-FREE PAPER.
(5) τ. his publication was prepared under the direction of Photis Nanopoulos, Directorate A: Statistical information system, research and data analysis, technical cooperation with Phare and TAC IS countries, Harald Sonnberger, Head of Unit A4, research and development, methods and data analysis, as well as Ibrahim Laafia and Alice Zoppe, Unit A4.. The texts and the analyses were realised by:. Frank Foyn, Birgit Gehrke, Tommaso Di Giovanni, Amina Kafai, Ibrahim Laafia, Jalal el Ouardighi, Alex Stimpson and C hristophe Zerr. James P. Gavigan, Eamonn C ahill and Jaime Rojo from IPTS were responsible for the chapter 'S&T indicators in the new economy: the sofl technology gap', whilst Ian Perry from the Research DG wrote the chapter on 'C ommunity funded research and technological development'. The data processing, the conception of the publication and the desktop publishing were realised by:. Marta Alfageme, MarieAgnès Bragard, Gérard C arrier, Morgane Dolenc and Véronique de Känel. The opinions expressed are those of the individual authors alone and do not necessarily reflect the position of the European Commission. Maps. GISCO, Eurostat C MEGRIN GIE 1999, for the administrative boundaries, on behalf of the national organisations responsible for official mapping of the displayed countries. Translation. Translation Service of the European C ommission, Luxembourg. Eurostat gratefully acknowledges the contributions of the following institutes which supplied the statistics for the respective countries:. Belgium Denmark Germany Greece Spain France Ireland Italy Luxembourg Netherlands Austria Portugal Finland Sweden United Kingdom Iceland Norway. Federal Office for Scientific, Technical and C ultural Affairs The Danish Institute for Studies in Research and Research Policy Bundesministerium für Bildung, Wissenschaft, Forschung und Technologie (BMBF) General Secretariat for Research and Technology Instituto Nacional de Estadística (INE) Ministère de l'éducation nationale, de la recherche et de la technologie (MENRT) Forfas Istituto Nazionale di Statistica (ISTAT) Service C entral de la Statistique et des Études Économiques (STATEC ) Statistics Netherlands [C BS] Austrian C entral Statistical Office (AC SO) Observatorio das C iências e das Tecnologia [OC T] Statistics Finland Statistics Sweden Office for National Statistics (ONS) The Statistical Bureau of Iceland Statistics Norway. Organisation for Economic Cooperation and Development (OECD) Enquiries regarding the purchase of data should be addressed to:. Eurostat Datashop 4, rue Alphonse Weicker L2014 Luxembourg. tel: (+352) 4335 2251 fax: (+352) 4335 22221. A great deal of additional information on the European Union is available on the Internet. It can be accessed trough the Europa server at: http://europa.eu.int. • * • ^. ~k. EUR. * O = 5P= *. *. • i. •. *. Office for Official Publications of the European Communities L — 2985 Luxembourg.
(6)
(7) t the Lisbon Summit of March 2000, the European Council set a clear strategic objective for Europe in the next decade: to become the most competitive and dynamic knowledge-based economy capable of sustainable economic growth with more and better jobs and greater social cohesion. In order to achieve this goal there are several requirements: among them, creating an environment that encourages research and innovation, and facilitating the transition to the knowledge-based economy. Recommendations for the realisation of several of these objectives are laid down in a recent Commission communication entitled Towards a European research areal1). Nevertheless, such systematic policy support needs both high quality information on Science and Technology and relevant accompanying analysis. For this reason and in recognition of the increasing diversity of S&T statistics, the present publication considers many more aspects than Eurostat's R&D Annual Publication. As well as the usual statistics on R&D expenditure, R&D personnel, Government R&D appropriations and patents, it contains, for the first time, data on innovation, employment in high technology sectors and human resources in science and technology. The role of Community RTD policy is also considered and, in a separate chapter, the possible future directions for the development of a new generation of S&T statistics and their evolution thus far. Limitations of space have prevented the inclusion of complete time series in all cases. However, these data can be found in the CD-ROM version of this publication and are, of course, available in Eurostat's reference database, New Cronos. All the information in this publication is based on data supplied to Eurostat by the Member States, by the Research DG of the European Commission, by the European Patent Office (EPO) and by the OECD. We express our thanks to our colleagues in the Member States (and in Iceland and Norway), the Commission Services, EPO, the OECD and the Institute for Prospective Technological Studies (IPTS) for their excellent co-operation and their willingness to help in meeting the ever-growing demand for information on S&T.. Yves Franchet Director-General — Eurostat. (*). Communication from the Commission to the Council, the European Parliament, the Economic and Social Committee and the Committee of the Regions, Towards a European research Brussels, 18 January 2000.. area,.
(8)
(9) %£?:■! C A S - r ^ ' í ' a J.
(10) Table. of. contents. Τ Acknowledgments. 3. Foreword. 5. Lists of tables, figures and maps. 11. Introduction. 19. Part 1 Research and development. . . .25. Chapter 1 — Govern men t budget appropriations on R Å D 1.1. GBAORD allocation of the Triad. 28. 1.2. GBAORD allocation in the European Union. 31. 1.3. European community funding in RáD. 34. 1.4. Specific developments in the EU Member States. 34. Chapter 2 — Community funded research and technological development 2.1. Framework programmes f o r RTD. 39 40. 2.2. Implementation of community RTD policy. 41. 2.3. Evolution of the framework programmes f o r RTD. 43. Chapter 3 — RAD expenditure and personnel. 51. 3.1. RáD at the international level: Europe, Japan and the United States. 52. 3.2. RAD in the European Economic Area. 55. 3.3. Regional RAD. 65. Chapter 4 — European patent applications. é'. 27. 77. 4.1. Patent indicators. 78. 4.2. Characterisation of technological activities in the European Union. 78. 4.3. Characterisation of technological activities in European regions 4.4. Methodology. 83 88. Statistics on Science and Technology in Europe. 'm.
(11) Table. of. contents. Τ. Part 2 Knowledge, growth and innovation Chapter 5 — Innovation in Europe. 93. 5.1. Methodology. 94. 5.2. Innovating enterprises. 96. 5.3. Innovation cooperation. 101. 5.4. Innovation expenditure and turnover of new products. 103. 5.5. Objectives f o r innovation, patenting activity and government assistance. 107. Chapter 6 — Employment in high technology sectors. Ill. 6.1. Methodology. 112. 6.2. The national level: RAD and knowledgeintensive sectors. 114. 6.3. The regional level: Identifying leading RáD and knowledgeintensive regions in Europe. 117. Chapter 7 — Human resources in science and technology. 125. 7.1. Methodology. 126. 7.2. Stocks: Labour market evolutions. 129. 7.3. Flows: Education and mobility. 134. Part 3 Looking to the future. 143. Chapter 8 — SÄT indicators in the new economy: the 'soft technology' gap. 145. 8.1. The indicators concept technology and innovation in a changing economic system. 146. 8.2. What is technology?. 147. 8.3. How are science and technology activities carried out?. 151. 8.4. Towards new indicators or new measures. 152. Notes on the methodological manuals. 161. Abbreviations and symbols. 169. <. m. 91. 9 Statistics on Science anû Technology in Intone.
(12)
(13)
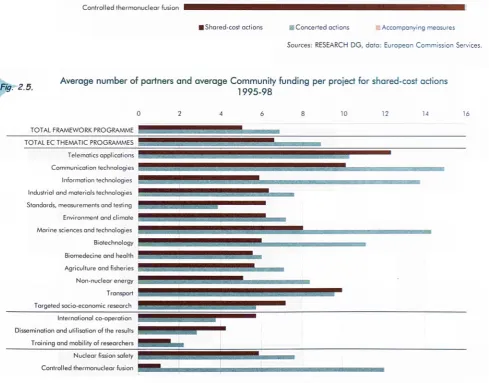
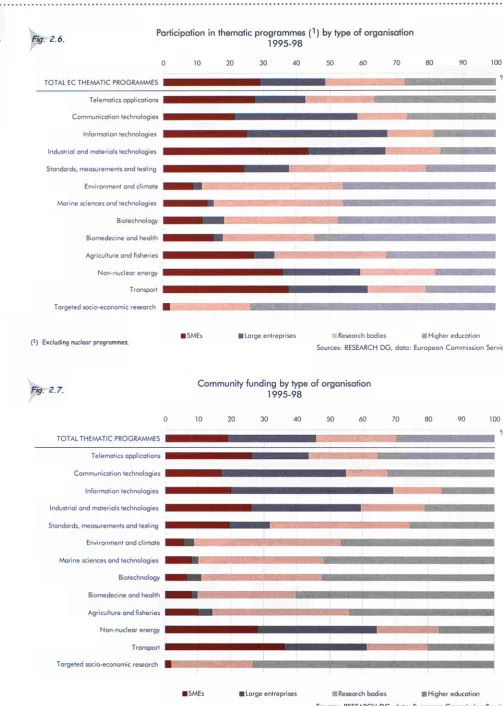
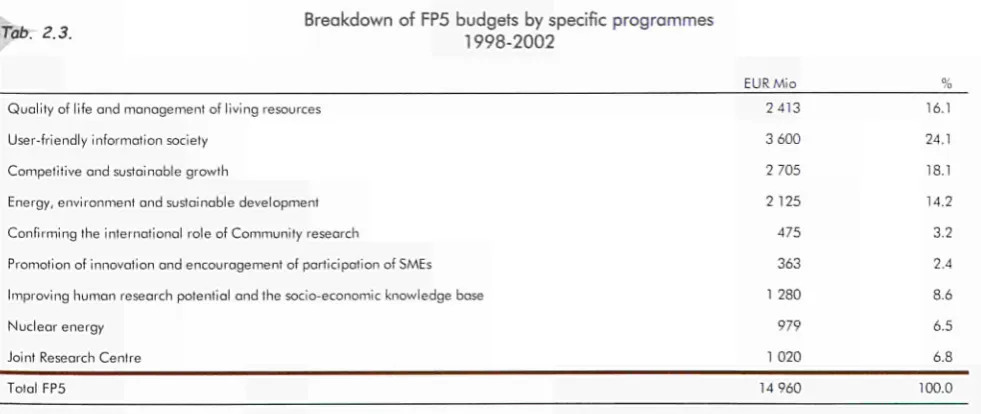
(14) List. of. tables. L Part 1 Research and development Chapter 1 — Government budget appropriations on RAD •Table 1.1. GBAORD by NABS as a % of total GBAORD according to country - 1999. 36. Chapter 2 — Community funded research and technological development •Table 2.1. Joint Research Centre financing for the periods of 2nd, 3rd, 4th and 5th Framework Programmes for RTD. 42. •Table 2.2. Budgets accorded to the framework programmes for RTD. 42. •Table 2.3. Breakdown of FP5 budgets by specific programmes — 1998-2002. 47. Chapter 3 — R<&D expenditure and personnel •Table 3.1. RAD expenditure in PPS at 1990 prices A in ECU at current prices 1985 and 1998. 57. •Table 3.2. RAD personnel in HC and FTE - 1985 and 1998. 61. •Table 3.3. Regions with high RAD expenditure by institutional sector 1997 - All sectors. 64. •Table 3.4. Regions with high RAD expenditure by institutional sector 1997 — Business enterprise. 64. •Table 3.5. Regions with high R<SD expenditure by institutional sector 1997 — Government. 64. •Table 3.6. Regions with high RAD expenditure by institutional sector 1997 — Higher education. 64. •Table 3.7. Disparities in RaD expenditure by region for all sectors — 1997. 65. •Table 3.8. Regions with high RaD personnel by institutional sector 1997 - All sectors. 68. •Table 3.9. Regions with high RaD personnel by institutional sector 1997 — Business enterprise. 68. •Table 3.10. Regions with high RAD personnel by institutional sector 1997 — Government. 68. •Table 3.11. Regions with high RAD personnel by institutional sector 1997 — Higher education. 68. Chapter 4 — European patent applications •Table 4.1. Applications for European patents by IPC section — European Union, Japan and United States — Averages for 1990-98. 79. •Table 4.2. Indicators of technological activity by country — Averages for 1989-98. 81. •Table 4.3. Specialisation indices and degree of specialisation of technological activities by country — Averages for 1989-98. 81. •Table 4.4. European regions with high technological activity — Averages for 1989-98. 82. •Table 4.5. Strengths and weaknesses of the European regions with high technological activities — Averages for 1989-98. 86. •Table 4.6. Strengths and weaknesses of technological activities for the top five regions per country — Averages for 1989-98. 87. 12 Statistics on Science and Technology in Europe. W. 30.
(15) List. of. tables. Part 2. L. Knowledge, growth and innovation Chapter 5 — Innovation in Europe • Table 5.1. Innovating enterprises as a % of total enterprises in manufacturing and service sectors by country, size class and NACE — 1996. 97. • Table 5.2. Innovating enterprises as a % of total enterprises by innovation type in the EU - 1996. 98. • Table 5.3. Novel innovators as a % of total enterprises in the manufacturing sector by NACE in the EU - 1996. 98. • Table 5.4. Novel innovators as a % of total enterprises in the manufacturing sector by country, size class and NACE — 1996. 99. • Table 5.5. Innovating enterprises according to their export intensity in manufacturing and service sectors by country in % — 1996. 100. • Table 5.6. Innovation expenditure as a % of total turnover in manufacturing and service sectors by country, size class and NACE — 1996. 104. • Table 5.7. Total turnover due to new and improved products in manufacturing by country, size class and NACE in % — 1996. 105. • Table 5.8. Innovating enterprises in manufacturing and service sectors by objectives considered as very important for innovation in the EU — 1996. 106. Chapter 6 — Employment in high technology sectors • Table 6.1. Employment in selected sectors by country — 1999. 115. • Table 6.2. Annual average growth rates of employment in selected sectors by country — 1995-99. 115. • Table 6.3. Leading knowledge-intensive service regions in the European Union — 1999. 118. • Table 6.4. Leading information-communication service regions in the European Union — 1999. 118. • Table 6.5. Leading industrial high-tech regions in the European Union and specialisation index of their employment shares and HRSTO — 1999. 121. Chapter 7 — Human resources in science and technology • Table 7.1. Categories of HRST. 128. • Table 7.2. HRST stocks by country - 1999. 128. • Table 7.3. Distribution of people employed as scientists and engineers by gender and age in 1999 and annual average growth rate for 1994-99. 133. • Table 7.4. Graduation from tertiary education as a % of people aged 25-29 by gender and country - 1993/94-1996/97. 136. •Table 7.5. People graduating in science and engineering by gender and country 1993/94-1996/97. 138. • Table 7.6. Graduates by country, gender and field of study — 1996/97. 138. • Table 7.7. HRST mobility rates by gender and country — 1994-99. 140. Part 3 Looking to the future Chapter 8 — SAT indicators in the new economy: the 'soft technology' gap •Table 8.1. Categories of firm-level intellectual capital. 148. • Table 8.2. Correspondences at individual and system level to categories of firm-level intellectual capital. 150. • Table 8.3. Categories of knowledge for three different reference levels. 150. • Table 8.4. Soft evaluation framework: the firm and its networks. 156. ·<. Wh. 13 Statistics ou Science ana Technology in Europe. sã/.
(16) List. of. figures. Part 1 Research and development Chapter 1 — Government budget appropriations on R&D • Figure 1.1. Evolution of GBAORD in PPS 1990 — European Union, Japan and the United States - 1985-2000. 29. •Figure 1.2. GBAORD as a % of GDP — European Union, Japan and the United States - 1985-99. 29. • Figure 1.3. GBAORD by NABS — European Union, Japan and the United States — 1999. 29. • Figure 1.4. Evolution of GBAORD by selected NABS as a % of total GBAORD European Union - 1985-99. 30. •Figure 1.5. Evolution of GBAORD by selected NABS as a % of total GBAORD Japan - 1988-99. 30. •Figure 1.6. Evolution of GBAORD by selected NABS as a % of total GBAORD United States - 1980-99 •Figure 1.7. GBAORD as a % of GDP - European Union - 1985-99. 30 32. • Figure 1.8. Comparison of GBAORD between current and constant prices European Union - 1985-99 •Figure 1.9. GBAORD by NABS - European Union - 1999. 32 32. •Figure 1.10. Distribution of GBAORD by NABS - European Union - 1985-99. 33. •Figure 1.11. European Community appropriations on RAD at current prices — 1985-99. 33. •Figure 1.12. European Community appropriations on RAD by NABS as a % of total European Community funding to RAD in 1999 and annual average growth rate 1995-99. 33. •Figure 1.13. GBAORD as a % of GDP by country - 1999. 35. •Figure 1.14. Annual average growth rates of GBAORD and GDP by country — 1995-99. 35. Chapter 2 — Community funded research and technological development •Figure 2.1. Changes in priorities of RTD activities from one framework programme to the next. . . .42. •Figure 2.2. Breakdown of the FP4 indirect actions budget - 1994-98. 44. •Figure 2.3. Breakdown of the Joint Research Centre FP4 direct actions — 1994-98. 44. •Figure 2.4. Breakdown of contracts and contractual Community contributions by types of actions — 1995-98. 45. •Figure 2.5. Average number of partners and average Community funding per project for shared-cost actions — 1995-98. 45. •Figure 2.6. Participation in thematic programmes by type of organisation — 1995-98. 46. •Figure 2.7. Community funding by type of organisation — 1995-98. 46. Chapter 3 — R<&D expenditure and personnel •Figure 3.1. RAD expenditure in ECU at current prices — 1985-98. 53. •Figure 3.2. RAD expenditure as a % of GDP - 1985-98. 53. •Figure 3.3. RAD expenditure in ECU at current prices by institutional sector 1998 - EU-15. 53. •Figure 3.4. RAD expenditure in ECU at current prices by institutional sector 1998 - Japan. 53. •Figure 3.5. RAD expenditure in ECU at current prices by institutional sector 1998 - United States. 53. 14. f. Statistics on Science and Technology in Europe eurostat.
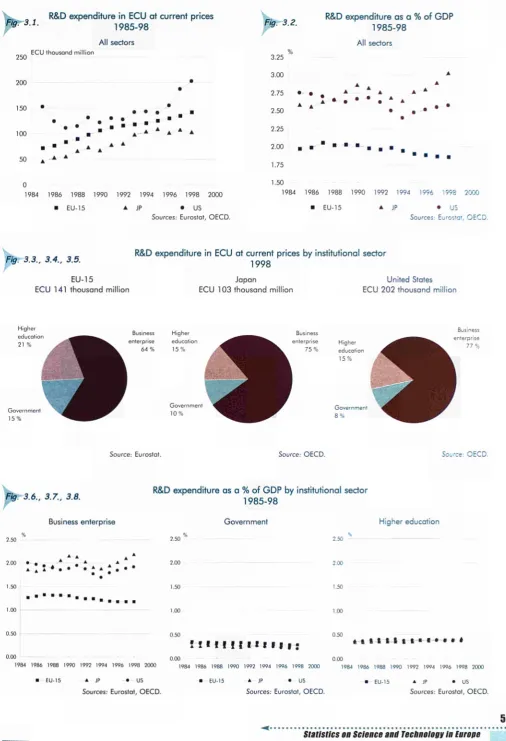
(17) List. of. figures. L Chapter 3 — RÅD expenditure and personnel (cont) • Figure 3.6. RAD expenditure as a % of GDP by institutional sector 1985-98 — Business enterprise. 53. •Figure 3.7. RAD expenditure as a % of GDP by institutional sector 1985-98 - Government. 53. •Figure 3.8. RAD expenditure as a % of GDP by institutional sector 1985-98 - Higher education. 53. • Figure 3.9. RAD personnel in FTE and HC - 1985-98. 54. •Figure 3.10. RAD personnel in FTE as a % of the labour force — 1985-98. 54. •Figure 3.11. RAD personnel in FTE by institutional sector 1998 - EU-15. 54. •Figure 3.12. RAD personnel in FTE by institutional sector 1998 — Japan. 54. • Figure 3.13. RAD expenditure and personnel in FTE — 1985 and 1998. 54. •Figure 3.14. RAD expenditure in ECU at current prices, in PPS at 1990 prices and as a % of GDP — European Economic Area — 1985-98. 56. •Figure 3.15. RAD expenditure in ECU at current prices by country — 1991. 56. • Figure 3.16. RAD expenditure in ECU at current prices by country — 1998. 56. •Figure 3.17. RAD expenditure as a % of GDP - 1985 and 1998. 57. •Figure 3.18. RAD expenditure in PPS at 1990 prices by institutional sector — 1998. 59. • Figure 3.19. RAD expenditure as a % of GDP by institutional sector 1985 and 1998 - Business enterprise. 59. •Figure 3.20. RAD expenditure as a % of GDP by institutional sector 1985 and 1998 - Government. 59. •Figure 3.21. RAD expenditure as a % of GDP by institutional sector 1985 and 1998 - Higher education. 59. •Figure 3.22. RAD personnel in FTE and HC - 1985-98. 60. •Figure 3.23. RAD personnel in HC by country — 1991. 60. • Figure 3.24. RAD personnel in HC by country — 1998. 60. •Figure 3.25. RAD personnel as a % of the labour force — 1985 and 1998. 61. •Figure 3.26. Women as a % of total RAD personnel in HC — 1997. 63. •Figure 3.27. RAD personnel in HC as a % of the labour force by institutional sector 1985 and 1998 — Business enterprise. 63. • Figure 3.28. RAD personnel in HC as a % of the labour force by institutional sector 1985 and 1998 — Government. 63. •Figure 3.29. RAD personnel in HC as a % of the labour force by institutional sector 1985 and 1998 — Higher education. 63. • Figure 3.30. Commitments to RAD for all sectors — 1985. 72. •Figure 3.31. Commitments to RAD for all sectors - 1998. 72. •Figure 3.32. Regions with a high commitment to RAD by country for all sectors — 1997. 72. •Figure 3.33. RAD intensity and GDP growth by selected regions - 1993-97. 74. Chapter 4 — European patent applications •Figure 4.1. Index of growth in applications for European patents and their density in relation to population and employment in the European Union — 1989-98. 79. •Figure 4.2. Evolution in applications for European patents European Union, Japan and United States — 1990-98. 79. 15. ΈΒΔ. Statistics on Science and Technology in Europe. W.
(18) List. L. of. figures. Part 2 Knowledge, growth and innovation Chapter 5 — Innovation in Europe • Figure 5.1. Innovating enterprises as a % of total enterprises in manufacturing and service sectors by size dass in the European Union — 1996. 96. • Figure 5.2. Type of innovation by innovating enterprises in the EU — 1996. 98. • Figure 5.3. Innovating enterprises and novel innovators as a % of total enterprises in the manufacturing sector by country — 1996. 98. • Figure 5.4. Innovators with co-operation as a % of total innovators in the manufacturing and service sectors by country — 1996. 101. • Figure 5.5. Innovating enterprises with co-operation by type of partner in the manufacturing and service sectors in the EU in % — 1996. 102. • Figure 5.6. Innovating enterprises with co-operation by location of partner in the manufacturing and service sectors in the EU in % — 1996. 102. • Figure 5.7. Novel innovators with/without co-operation in manufacturing by size class in the EU in % - 1996. 102. • Figure 5.8. Relative distribution of innovation expenditure in manufacturing and service sectors by type and size class in the EU — 1996. 104. • Figure 5.9. Relative distribution of new or improved products in manufacturing by size class in the EU — 1996. 105. • Figure 5.10. Innovators having applied for a patent in manufacturing and service sectors by size class in the EU - 1994-96. 106. • Figure 5.11. Innovators having applied for a patent in manufacturing and service sectors by country - 1994-96. 106. • Figure 5.12. Innovators with government support in manufacturing and service sectors by size-class in the EU - 1996. 108. • Figure 5.13. Innovating enterprises receiving government assistance in manufacturing and service sectors by country — 1996. 108. Chapter 7 — Human resources in science and technology • Figure 7.1. Stock of HRST in the European Union - 1999. 129. • Figure 7.2. Annual average growth rate in HRST by country — 1994-99. 130. • Figure 7.3. HRSTE as a % of the respective population by age and country — 1999. 130. • Figure 7.4. HRSTC as a % of the labour force by country - 1994 and 1999. 130. •Figure 7.5. HRST unemployment and total unemployment by country — 1994 and 1999. 133. •Figure 7.6. The main flows into and out of the national stock of HRST. 135. • Figure 7.7. Annual average growth rate in the number of students in tertiary education by country - 1982/83-1996/97. 135. • Figure 7.8. Students in tertiary education as a % of people aged 20-29 by gender and country — 1993/94 and 1996/97. 136. • Figure 7.9. Annual average growth rate in the number of science and engineering graduates by gender and country - 1993/94-1996/97. 140. Part 3 Looking to the future Chapter 8 — S&T indicators in the new economy: the 'soft technology' gap • Figure 8.1. Technology characteristics and the need for recontextualisation. 148. 16 Statistics on Science and Technology in Europe. ^h.
(19) List of maps. L. Part 1 Research and development Chapter 3 — RáD expenditure and personnel • Map 3.1. Regional RAD expenditure All sectors, as a % of GDP - 1997 - NUTS 2. 66. • Map 3.2. Regional RAD expenditure in the business enterprise sector as a % of GDP — 1997 — NUTS 2. 67. • Map 3.3. Regional RAD personnel (head count) All sectors, as a % of labour force - 1997 — NUTS 2. 70. • Map 3.4. Regional RAD personnel (head count) in the business enterprise sector, as a % of labour force — 1997 — NUTS 2. 71. Chapter 4 — European patent applications • Map 4.1. Regional European patent applications per 1 000 000 labour force - 1998 - NUTS 2. 84. 17. m. eurostat. Statistics on Science and Technology in Europe. IÍN-'.
(20)
(21)
(22) I. Introduction ince 1993, Eurostat's Annual Publication on Research and Development statistics, containing up-to-date statistics and indicators on both Research and Development and European patent applications, has reported key trends and developments in both the European Union and the European Economic Area. Statistics on S&T in Europe marks a deviation from the customary format to present recent developments not just in the four areas considered annually (R&D expenditure, R&D personnel, Government R&D appropriations and Patents), but also in more recent areas of interest to science and technology policy-makers and analysts. Research and Development (R&D) is regarded as an important contribution to our well-being; it is a driving factor behind economic growth and job creation, a source of increasing quality of products and a prime mover of improvements in health care and environmental protection. For the development of the European Union, its Member States and regions, R&D is therefore a key issue. This is why political decision-makers at all levels are calling for stronger measures in support of R&D. Yet, despite the frequent clarion calls for greater European investment into the research effort, as well as policy formulated to encourage such a situation, the reality is that more needs to be done. This is the message that is borne out in the European Commission's communication Towards a European research area, in January 2000 f1). The indicators published by Eurostat in Statistics on S&T in Europe allow the continued reporting and analysis that permit a close monitoring of recent performances and, therefore, the identification of current and potential future areas of concern. This is made possible by data which are as comprehensive, comparable and as up-to-date as possible, providing analysts with a common. system of reference and therefore facilitating the process of identifying best practice. In recognition of the increasing diversity of science and technology (S&T) statistics, the present publication goes beyond the traditional fields of Research and development: annual statistics and looks at more recent areas of Eurostat research: innovation, employment in high technology sectors and human resources in science and technology. This is because, today, it is necessary to complement the more conventional elements of R&D statistics by additional fields that include indicators on less tangible factors: facets of the knowledge-based economy. Nevertheless, this Panorama version is by no means intended to provide a detailed taxonomie approach to all of the science and technology indicators used at the national and international level, but rather an examination of pertinent domains of S&T today. Primary focus is on the 15 European Union Member States and to a lesser extent the European Economic Area. To provide further high level international comparison, where possible, Japan and the the United States are also considered. And, at the other end of the scale, a regional analysis across the EU countries is provided. Although no consideration is made of the R&D or innovation situation in the candidate countries or the Russian Federation in this publication, interested readers can refer to another recent Eurostat publication (2). Given the numerous sources of data involved, the time series differ according to indicator. For example, the first considered year for indicators concerning R&D expenditure, R&D personnel and GBAORD is 1985, whereas for Patents the starting point is 1989.. C1). Communication from the Commission to the Council, the European Parliament, the Economic and Social Committee and the Committee of the Regions, Towards a European research area, Brussels, 18 January 2000.. (2). RdD and innovation statistics in candidate countries and the Russian Federation, Office European Communities, Luxembourg, 2000.. for Official Publications of the. 20 Statistics on Science and Technology In Europe. m.
(23) Introduction The chapters on GBOARD and R&D expenditure and personnel also take into account changes brought about by the adoption of the new system of national accounts — the European System of Accounts (ESA) — with ESA '95 replacing ESA '79. For the other more recently developed indicators, the time series are of course shorter. Indicators on human resources in science and technology begin in 1994, whereas the starting point for data on employment in high technology sectors is 1995. Nevertheless, the goal of this publication remains the same throughout: to provide the most detailed, coherent and comprehensive time series analysis possible. Due to constraints of space, the statistical tables used for the analysis are not always available in the paper version of the present publication. Instead, they are provided in their entirety in the electronic version of Statistics on S&T in Europe. Electronic versions of this publication can be obtained by visiting the Eurostat Web-site at: •. http://europa.eu.int/comm/eurostat/. Furthermore, analyses in the present publication refer to the data on the Eurostat database New Cronos at the time of writing. Because New Cronos is regularly updated as and when new data are received, it may be that data in extractions made or requested subsequently differ somewhat to those available at the time of writing. Consistency with the analyses conducted in previous publications is also maintained, whilst seeking to complement these important aspects with further research that responds to user requirements. The conceptualisation of these new indicators is the result of rigorous and continual procedures within the policymaking and scientific communities. Methodological notes, explanations and bibliographical references are documented on a chapter by chapter basis.. I. This publication, intended for both generalists and specialists, is organised thematically. In Part 1, recent trends of the more traditional indicators (R&D expenditure, R&D personnel, GBAORD and Patents) are analysed along with the Community contribution to the research effort. This is followed in Part 2 by the evaluation of innovation, employment in high technology sectors and human resources in science and technology. The publication concludes with some considerations on the likely future key areas in the development of S&T indicators.. GOVERNMENT BUDGET APPROPRIATIONS ON R&D In Chapter 1, the distribution and main trends of GBAORD in the EU are documented, mapping both the recent developments in the individual Member States and placing Europe in a more international context. In 1999, budget appropriations in the Member States of the European Union totalled more than EUR 59 000 million, with a further EUR 2 400 million earmarked by the European Commission. However, the relative deterioration of GBAORD in the EU as a proportion of GDP is underlined in this chapter. Comparisons with Japan and the US, reveal that Japan has caught up both the EU and the US to a significant degree since 1985 and that, despite a larger relative reduction in government R&D appropriations, the US still retains the highest relative proportion. The largest EU public R&D appropriations relative to GDP are France and Finland. Spain and Portugal, on the other hand, have shown the highest growth rate over the last five years and are approaching the EU average. Changes have also occurred in the socio-economic objectives of these funds. During the last fifteen years 'Research financed from General University Funds' has seen the strongest increase and is now the first priority in the EU. Next are Technological objectives', 'Defence' and 'Non-oriented research'.. 21. ~m. Statistics un Science and Technology in Europe.
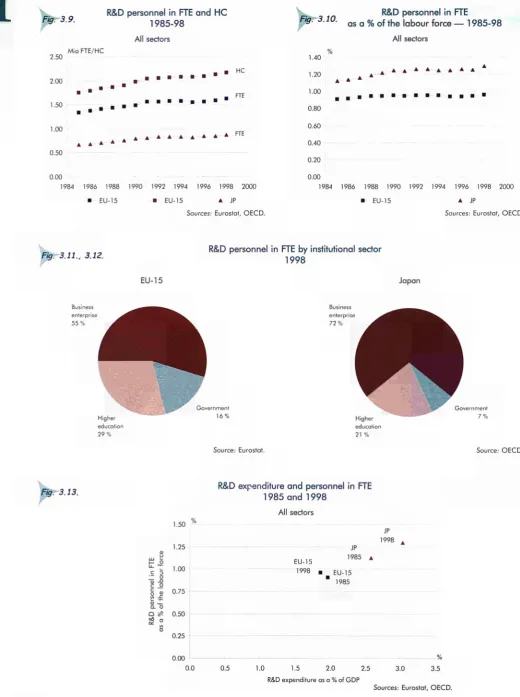
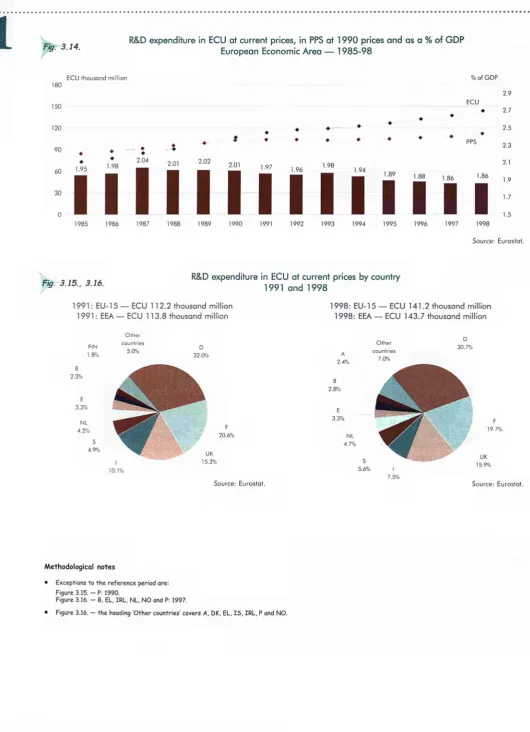
(24) Introduction. I. THE COMMUNITY EFFORT. PATENTS. Community Research and Technological Development (RTD), which is budgeted according to four-year framework programmes, has increased steadily since the inception of the framework programmes in 1984. The current Fifth Framework Programme, running from 1998 to 2002, commits EUR 15 thousand million to RTD. Relative to the overall Community budget, however, this represents a modest diminution on the Fourth Framework Programme level, down from 4 to 3.7 %. The Community Framework Programme accounts for around 5.4 % of the total public research effort.. For a long time, data on patents have been used as a measure of innovative activity, technology development, and particularly for international comparisons of technology growth. Since 1990, patent applications at the European Patent Office (EPO) by EU countries have increased at an average annual rate of 2.7 % and in 1998, just over 40 000 patent applications were filed by the EU-15. By way of comparison, over the same observation period, growth in patent applications at the EPO by the US and Japan stands at 4.8 and 1.3 %, respectively. At the EU level, Germany, France and the UK are the three dominant countries in patenting and in 1998 they accounted for more than 70 % of the EU total. Nevertheless, growth in patents in these countries falls below the EU average.. R&D EXPENDITURE AND R&D PERSONNEL R&D expenditure continued to develop in the EU in absolute terms and in 1998 represented an estimated ECU 141 thousand million. This is roughly 7 0 % of the equivalent research effort in the United States (ECU 202 thousand million), but higher than that of Japan (ECU 102 thousand million). Measured as a proportion of gross domestic product, the EU effort in 1998 (1.86 %) is well below corresponding figures for the United States and Japan (2.58 and 3.03 % respectively). The principal source of this difference is the business enterprise sector, in which the EU R&D effort is far below its US or Japanese counterparts. Apart from adequate funding, successful R&D activities require the deployment of qualified staff. In 1998, in the European Union there were round 2.2 million personnel in R&D activities, which is a modest increase on the 1997 level. In terms of Full Time Equivalent (FTE), this represents 1.6 million R&D personnel, of which just over 50 % worked in the business enterprise sector. This compares with approximately three in four R&D personnel working in the business enterprise sector in Japan.. INNOVATION Using data from the second Community Innovation Survey (CIS2) in 1997-98, which built upon the knowledge and experience obtained in the first survey conducted in 1992, Chapter 5 presents an overview of innovation by sector, co-operation, expenditure and by facilitating or hampering factors. Coverage concerns the EU Member States (except Greece) and also Norway. On average 51 and 41 % of enterprises in the manufacturing and service sectors respectively were innovative during the period 1994-96, with the proportion of innovating enterprises tending to increase with sizeclass in both the manufacturing and service sectors. The most innovative Member States were Ireland (73 %), Germany (69 %) and Austria (67 %).. 22. w. Statistics on Science and Technology in Europe. [=0 eurostat.
(25) Introduction EMPLOYMENT IN HIGH TECHNOLOGY SECTORS Chapter 6 concentrates on the level of employment growth in the high technology sectors. With the growth in the tertiary sector in all European industrialised nations, industrial employment has shown a downward trend, until more recently when, along with the general economic situation, it has stabilised to some degree. Despite this phenomenon, positive growth has been experienced in the high technology manufacturing sectors at the European Union level. The big four EU nations — Germany, France, Italy and the United Kingdom — accounted for over three quarters of total employment in this sector, a third of which is to be found in Germany alone, where research-intensive industries rank highest even within the economy as a whole. Growth in the knowledge-intensive service sectors and also the information and communication-oriented service sectors has been more clear-cut. For knowledge-intensive services, there has been annual average growth of 5 % or more for several regions. But it is in the information and communication-oriented service sectors that the highest growth is manifest. Double-digit growth rates are evident in some of the leading high tech regions of the EU.. I. According to the latest available data from the Community Labour Force Survey for 1999, there were approximately 65 million people classified as HRST in the EU, of which just less than 30 million were female. In the vast majority of Member States, the situation is also improving over time, with annual average growth as high as around 8 % per annum. New results on the domestic mobility of Europe's highly qualified workers indicate that they are becoming more mobile, with some variations between the countries analysed.. S&T INDICATORS IN THE NEW ECONOMY The final chapter looks at problems associated with reconciling the needs of users of S&T indicators and the possible ways for providing them. An underlying theme is that too much emphasis is being placed on the identification and measurement of inputs and outputs, with less effort focused on identifying and classifying the strengths and weaknesses of the underlying stock of S&T knowledge and capability. In short, the search for relevant indicators must move away from the simple model of innovation to a much more complex context for which the definitions and models have yet to be fully established.. HUMAN RESOURCES IN SCIENCE AND TECHNOLOGY Whereas the chapter on employment in high technology sectors concentrated principally on employment growth, with some focus on the level of qualification of individuals, the principal aim of the chapter on Human Resources in Science and Technology (HRST) is to demonstrate to what degree Europe's workforce is qualified and able to prosper in this new economy.. 23. ΉΔ. Statistics on Science and Technology in Europe ^sr.
(26) Introduction. I. References •. Communication from the Commission to the Council, the European Parliament, the Economic and Social Committee and the Committee of the Regions, Towards a European research area, Brussels, 18 January 2000.. •. RaD and innovation statistics in candidate countries and the Russian Federation, Office for Official Publications of the European Communities, Luxembourg, 2000.. 24 ,. Statistics on Science and Technology in Europe. m. eurostat.
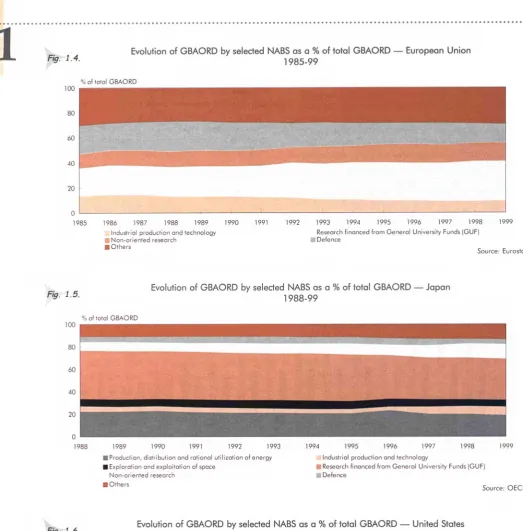
(27) PART ι Statistics on Science and Technology in Europe.
(28)
(29) PART ι Government. ©. budget. appropriations. on R&D. r. overnment Budget Appropriations and Outlays on R&D (GBAORD) are a way of measuring government support to R&D. GBAORD concerns government funding towards R&D activities performed both nationally and abroad. It includes budget provisions by central government but excludes those made by local government. Only when the contribution is significant does it also incorporate provincial or regional government outlays. It not only covers R&D performed in government establishments but also in the other three national sectors (business enterprise, private nonprofit and higher education).. -i. GBAORD data do not consider the amount of money actually spent, but are based on budget provisions, and so should be seen as intentions of spending. This is why final actual spending rarely matches the initially allocated budget. The process of political consensus about public expenditures creates gaps between budgets and final expenditures (gaps in terms of time and amount of resources). However, since there is a greater time lag for data on final R&D expenditure (see C hapter 3), data are usually also collected from budget statistics in order to have up to date indicators.. Su IP. Data are collected at the national level and the procedure can be articulated in a two step process: • within the budget statistics, it is first necessary to identify the budget items that involve R&D; • the R&D contents of these budget items must then be measured or estimated. Data are also collected according to socioeconomic objectives. These data reflect policies at a given moment in time and the concomitant priorities of the policymakers when allocating their budgets. These data are hard to collect because they are not obtained from ad hoc surveys, but in most cases are obtained from national budget statistics. The difficulty is due more specifically to the fact that national budgets already have their own terminology and methodology and therefore do not accord entirely with the Eurostat guidelines and the methodology used by the OEC D P roposed Standard Practice for Surveys of Research and Experimental Development — Frascati Manual. This analysis is performed for the years 1985 to 1999 (1999 provisional data) and is divided into four sections. The first section compares the respective evolutions in the European Union, Japan and the United States — the so called Triad. This allows us to place recent trends in the EU within an international context. The second section analyses the evolution of GBAORD for the EU15 I1) as a whole. The analysis is conducted both in terms of total GBAORD and broken down by NABS (Nomenclature for the Analysis and Comparison of Scientific Programmes and Budgets) (2), the classification widely agreed to compare budget destination of resources to particular socioeconomic objectives. The analysis by NABS reveals priorities placed by individual governments in different categories. The third section deals with the European C ommunity appropriations on R&D, especially under the Framework Programmes. Finally, an analysis is conducted for the individual Member States of the EU, which gives an indication of the relative importance that the Member State governments have granted to R&D over time.. (*) (z). I n this chapter the EU15 does not include Luxembourg. The breakdown by socioeconomic objectives follows the breakdown on the basis of the. 3 V. © © © Τ S ©. NABS (Nomenclature for the Analysis and Comparison of Scientific Programmes and Budgets, Eurostat 1994 revision).. Λ. 27. ¡m eurostat. Statistics on Science and Technology in Europe. ' ^.
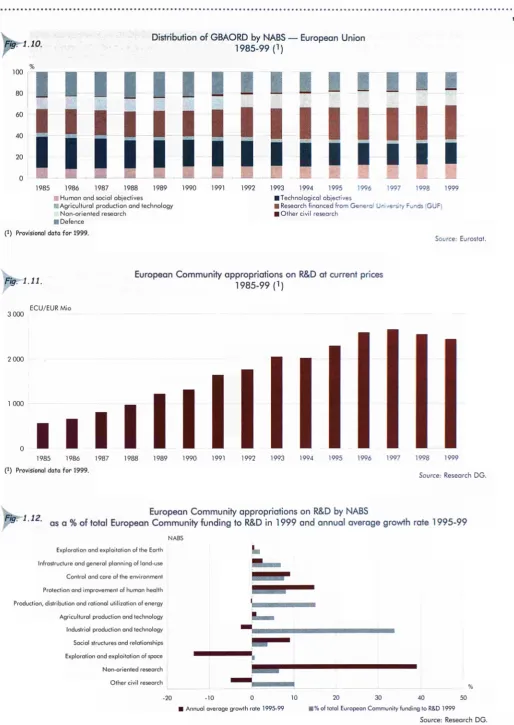
(30) Research. 1 H A Ρ Τ E R. 1.1. GBA ORD A LLOCA TION OF THE TRIA D Before analysing GBAORD in the European Union, Japan and the United States, a few cautionary notes should be made. Firstly, neither data on 'Research financed from General University Funds (GUF)' or 'Other civil research' are available for the US, as data there are based on the Federal or central government only. Secondly, for Japan, GBAORD data are in general underestimated because the R&D portion of military contracts is excluded. Finally, GDP throughout this chapter is calculated according to the most recent European System of Accounts — ESA 95. In absolute values GBAORD data in purchasing power parity (PPS) at 1990 prices show a clear predominance of the US over the last fifteen years. Figure 1.1. shows that the US allocated the largest amount of funds for R&D during 1999: PPS 56.9 thousand million (EUR 70.6 thousand million). The EU follows with PPS 45.9 thousand million (EUR 59.2 thousand million) appropriated to R&D by the Government sector, while Japan is third with PPS 14.3 thousand million (EUR 26.0 thousand million). A cursory inspection of the evolution between 1985 and 1999 reveals that GBAORD in the US grew moderately between 1985 and 1991. In a first period (198592), it grew by 0.87 % per year, reaching the absolute value of 59.4 thousand million PPS (EC U 52.7 thousand million) in 1992 and then declined by 0.82 % per year. Slightly different trends are shown by the EU in two different phases. In the first period (198592) the Member States budgeted an increasing amount of resources to R&D, growing from PPS 42.1 thou sand million (EC U 36.4 thousand million) in 1985 to PPS 48.0 thousand million (EC U 53.9 thousand million) in 1992. Between 1992 and 1999, GBAORD declined to PPS 45.9 thousand million (EUR 58.9). Japan, on the other hand, shows a steadily increasing trend in all the given years, growing from PPS 7.8 thou sand million (EC U 8.5 thousand million) in 1985 to PPS 14.3 thousand million (EUR 26.0 thousand million) in 1999. The annual average growth of Japan's GBAORD between 1985 and 1999 was equivalent to 4.4 %.. and. Development. GBAORD in PPS at 1990 prices shows the absolute value of R&D government funding in real terms but does not give any evidence of the effort a country makes in relation to the dimension of its economy. A second indicator could be used to show the relative effort made by policymakers towards R&D in the Triad: GBAORD as a proportion of GDP. Figure 1.2. shows two existing trends in the Triad: a decreasing one for both the EU and the US and an increasing one for Japan. A convergence is clearly visible. The period between 1985 and 1999 has seen a general decline for the EU and the US budgeted R&D funding in relative terms. GBAORD as a percentage of GDP deteriorated in the US from the 1985 level of 1.18 % to the 1999 level of 0.81 %. In the EU, it fell from 0.99 % to 0.76 % over the same period. After a fairly stable period, from the early 1990s onwards, Japan increased its share of GBAORD relative to GDP from 0.45 % in 1990 to 0.64 % in 1999. Using the NABS categories as a distinguishing factor, further consideration can now be placed on the relative importance of the various socioeconomic objectives in the Triad (Figures 1.3., 1.4., 1.5. and 1.6.) (3). Among the major sectors in Europe 'Research financed from General University Funds (GUF)' has increased from 22.4 % in 1985 to 31.7 % in 1999, as has 'Nonoriented research' (4) from 10.9 to 14.7 % over the same period. A clearly downward trend is shown for 'Defence' (22.9 to 15 %) and 'Industrial production and technology' (13.5 down to 9.5 %). The tendency for the EU seems to be towards a concentration of resources in 'research financed from GUF' and 'nonoriented research', as we can see that the aggregated sector called 'others' (5) has decreased. Figure 1.5. shows that Japan has a converging distribution of GBAORD in the various sectors. All the smallest sectors, with the exception of 'Agricultural production and technology', show an increasing trend from 1988 to 1999, and in particular the socioeconomic objective 'Nonoriented research' which increased from 7.6 to 12.8 % over this period. On the other hand, the major sectors have experienced a decrease in their share of funding. This is particularly true for 'Research financed from General University Funds' (from 43.7 to 36.6 %) and 'Production, distribution and rational utilisation of energy' (from 22.3 to 19.2 %).. (3). No data on 'Research financed from Seneral University Funds (GUF)' nor 'Other civil research' are available for the US, where data are based on the 'Federal or central government only'. As the SUF is financed through State Funds in the United States, it is also excluded from the GBAORD data. The category 'Other civil research' is included under the appropriate objectives. The absence of these two categories could bias the analysis, in particular due to the importance of the SUF in the European Union and Japan.. (4). 'Nonoriented research' covers all those appropriations or outlays which are earmarked for RÅD but which cannot be attributed to an objective.. (5). Residual class considering all other NABS with lower values.. 28 Statistics on Science and Technology in Europe. m.
(31) Government. '■' r'9-11/. budget. appropriations. on R&D. 1. Evolution of GBAORD in PPS 1990 — European Union, Japan and the United States 19852000. H A Ρ Τ E R. PPS Mio 70 000 60 000 50 000 40 000 30 000 20 000 10 000 0 1985. 1986. 1987 ■. 1988. 1989. 1990. 1991. EU-15(1). 1992. 1993. 1994. 1995. 1996. 1997. -A—JP(2). ♦. 1998. 1999. 2000. US (1,2). (!) Provisional data for 1999. ( 2 ) Provisional data for 2000.. Sources: Eurostat, OECD.. GBAORD as a % of GDP — European Union, Japan and the United States 198599. Fig. 1.2. % of GDP. 1985. 1986. 1987. 1988. 1989. 1990. ■ EU15M!. 1991. 1992 BJP. 1993. 1994. 1995. 1996. 1997. (!) Provisional data for 1999.. Fig.î 3.. 1998. 1999. US (1) So urces: EL rostat, OECD. GBAORD by NABS. European Union, Japan and the United States 1999. Exploration a n d exploitation of the Earth Infrastructure a n d general p l a n n i n g of landuse Control and care of the e n v i r o n m e n t Protection a n d improvement of h u m a n health Production, distribution a n d rational utilization of energy Agricultural production a n d technology Industrial production a n d technology Social structures a n d relationships Exploration a n d exploitation of space Research financed f r o m G e n e r a l University Funds (GUF) N o n o r i e n t e d research O t h e r civil research % of total Defence. GBAORD. Eurostat, OECD.. 29 Statistics ou Science and Technology in Europe. [M eurostat. %=f.
(32) Research. 1. Development. Evolution of GBAORD by selected NABS as a % of total GBAORD — European Union 198599. Fig. 1.4.. M A Ρ Τ E R. and. % of total GBAORD 100. 1985. 1986. 1987. 1988. 1989. 999. 1990 Research financed from General University Funds (GUF) Defence. Industrial production and technology Ξ Nonoriented research ■ Others. Source: Eurostat.. Evolution of GBAORD by selected NABS as a % of total GBAORD — Japan 198899. Fig. 1.5. % of total GBAORD. loo. 1989. 1990. 1991. 1992. 1993. 1994. I Production, distribution and rational utilization of energy I Exploration and exploitation of space. 1995. 1996. 1997. 1999. 1998. Industrial production and technology Π Research financed from General University Funds (GUF) Defence. Nonoriented research I Others. Source: OECD.. Evolution of GBAORD by selected NABS as a % of total GBAORD — United States 198099. Fig. 1.6.. % of total GBAORD. 1980. 1981. 1982. 1983. 1984. 1985. 1986. 1987. ¡Protection and improvement of human health ¡Exploration and exploitation of space ¡Others. 1. 1989. 1990. 1991. 1992. 1993. 1994. 1995. 1996. 1997. 1998. 1999. ■ Production, distribution and rational utilization of energy S3 Defence Source. OECD.. 30 Statistics on Science and Technology in Europe eurostat.
(33) Government. budget. appropriations. Finally, consideration of the US reveals that the relative weight of the 'Defence' sector has decreased fairly rapidly in the 1990s, even if it remains by far the one attracting the majority of resources (Figure 1.6.). Before then, it grew from 50.2 % in 1980 to 69.4 % in 1986. From 1987 to 1999, however, it fell from almost 70 % of total GBAORD to 52.8 %. A decreasing trend is also evident for 'Production, distribution and rational utilization of energy', whilst concomitantly, the others sectors are growing. This latest is the case of 'Exploration and exploitation of space' — from a share of 5.5 % of total GBAORD in 1985, it grew steadily to a share of 10.7 % in 1999 — and 'Protection and improvement of human health' increased its share from 11.3 % in 1985 to 19.8 % in 1999.. 1.2. GBAORD ALLOCATION IN THE EUROPEAN UNION. on R&D. GBAORD by socio-economic objectives Analysis of the disaggregated data reveals the priorities placed by individual governments in different categories. Figure 1.9. shows that in the EU the majority of funds (32 %) are allocated to the field 'Research Financed from General University Funds' (6). The second socio-economic objective in order of importance is the technological one (20 %), followed by 'Defence' (15 %), 'Non-oriented research' (15 %), and the aggregate 'Human and social objectives' (13 %). Analysis of the evolution of individual objectives during the period 1985-99 (Figure 1.10.) shows that: •. 'Research Financed from General University Funds' has almost constantly increased its share of GBAORD in the EU, especially since 1991 and is by far the most important for the majority of governments in R&D funding.. •. The other two major fields ('Defence' and Technological objectives') show quite constant declining trends in the 1990s, after periods of growth in the 1980s. The aggregate Technological objectives' declined from 29.2 % in 1985 to 25.3 % in 1990 and finally lost its first place among EU objectives, diminishing to a share of 20.2 % in 1999. A similar evolution is shown by 'Defence', whose share fell from 22.9 % in 1995 to 15.0 % in 1999.. •. Over the same period, other socio-economic objectives that seemed to be of secondary importance ('Human and social objectives' and 'Non-oriented research') raised their shares of fund allocations to 13.5 and 14.7 % respectively in 1999, against 12.1 and 14.6 % in 1995.. Total government R&D appropriations Figures 1.7. and 1.8. show the values of GBAORD for the EU in thousand millions of ECU/EUR at current prices, in PPS at 1990 constant prices and as a proportion of GDP. When analysed in terms of current prices GBAORD shows a quite constantly increasing trend, starting from ECU 36.4 thousand million in 1985 up to EUR 59.2 thousand million in 1999. However, there is low growth in terms of constant prices and a decrease in the effort made by governments towards R&D — GBAORD as a percentage of GDP. Two very different periods are noticeable, with 1991-92 a turning point for the three indicators considered. The different annual average growth rates shown in these two periods clearly give a dimension of the change. The annual average growth rate of GBAORD in constant prices was 2 % in the first period (1985-91) and - 0.62 % in the. (^j. 1. second (1992-99). This same growth rate in current prices was 5.3 % in the first period and 1.3 % in the second.. The category 'Research financed from Seneral University Funds (GUF)' includes the general grants received by Universities from the Ministry of Education or from the corresponding provincial or local authorities in support of their overall research/teaching activities. See Frascati Manual, p. 100, paragraph 381.. 31. ^Δ. Statistics on Science and Technology in Europe. tvW. H A Ρ Τ E R.
(34) Research. and. Development. k. χ. y,.. Η A Ρ Τ E R. GBAORD as α % of GDP — European Union 198599. % of GDP. 1.2. 1985. 1986. 1987. 1988. 1989. 1990. 1991. 1992. 1993. 1994. 1995. 1996. 1997. 1998. 1999 Source: Eurostat.. Comparison of GBAORD between current and constant prices — European Union 198599. , :, 1.8.. 70 000. Mio. 60 000 50 000 40 000 30 000 20 000 10 000 0 1985. 1986 ■. 1987. 1988. 1989. 1990. 1991. 1992. 1993. ECU/EUR at current prices and current exchange rate. 1994. 1995 A. 1996. 1997. 1998. 1999. PPS at 1990 prices Source: Eurostat.. GBAORD by NABS (!) — European Union 1999. * ,. 1.9.. Human and Defence. social. 15%. objectives 13%. Other civil research 1%. ^flj ÆE. ^^^Λ.. ^ W ^ ^. Nonoriented. t 1 ) The categories 'Human and social objectives' and 'Technological objectives' are obtained by grouping other NABS.. ^^. ^ v. ^ ^. .^fl. Technological. ^B. •. 'Human and social objectives' groups NA BS: No 2 — Infrastructure and general planning of landuse. No 3 — Control and care of the environment. No 4 — Protection and improvement of human health and No 8 — Social structures and relationships.. •. Technological objectives' adds NA BS: No 1 — Exploration and exploitation of the Earth, No 5 — Production, distribution and rational utilization of energy. No 7 — Industrial production and technology and No 9 — Exploration and exploitation of space.. objectives. ^Ê. research 15%. ^. ^ ^. ^^F. Research financed from General University Funds (GUF). ^ ^ ^ 1. ^^^^. Agricultural production and technology 4%. 32% Source: Eurostat. 32 ,. ■W. Statistics on Science and Technology in Europe. m. eurostat.
(35) Government. budget. appropriations. on R&D. Distribution of GBAORD by NABS — European Union 198599(1). 1985. 1986. 1987. 1988. 1989. 1990. 1991. 1992. 1993. 1994. 1995. C H A Ρ Τ E R. Ì996. 1997. 1998. 1999. ¡Technological objectives I Research financed from: Genera! Uni rørsity Funds (GUF} I Other civil research. Human and social objectives Agricultural production and technology Nonoriented research fl Defence. (l) Provisional data for 1999.. Source: Eurostat.. European Community appropriations on R&D at current prioss 198599 (l). >. 1 . 1 1 .. ECU/EUR Mio 3 000. 2 000. 1 000. 1985. 1986. 1987. 1988. 1989. 1990. 1991. 1992. 1993. 1994. 1995. 1996. 1997. (') Provisional data for 1999.. 1998. 1999. Source: Research D G .. European Community appropriations on R&D by NABS Fig. 1.12. as a % of total European Community funding to R&D in 1999 and annual average growth rate 199599 NABS Exploration and exploitation of the Earth Infrastructure and general planning of landuse Control and care of the environment Protection and improvement of human health Production, distribution and rational utilization of energy Agricultural production and technology Industrial production and technology Social structures and relationships Exploration and exploitation of space Nonoriented research Other civil research. % 20. 10. 0. ■ Annual average growth rate 199599. 10. 20. 30. 40. 50. ■ % of total European Community funding to R&D 1999 Source: Research D G .. 33 Statistics on Science and Technology in Europe. ΈΔ.
(36) Research. and. Development. g. y. 1.3. EUROPEAN COMMUNI TY I FUND NG I N R&D ( 7 ). L. H A Ρ Τ E R. Figure 1.11. shows the evolution of European C ommunity R&D appropriations in EC U/EUR at current prices from 1985 until 1999 — 1999 figures being provisional. Even if there is not a constantly increasing trend, growth was experienced until 1999. The upward trend is more consistent when we consider that from 1990 administra tive costs are no longer included in the figures. The recent decrease in total R&D appropriations is mainly due to the fact that 1999 is the first year of operations for the Fifth R&D Framework Programme. Payment appropriations for R&D in 1999 represent only a small proportion of the total budget of the Fifth Framework Programme. Figure 1.12. shows how the budget was divided during 1999 among different socioeconomic objectives. 'Industrial production and technology' is by far the most important objective, but its relative weight has decreased in the last five years (as shown by the average annual growth rate). The high growth rate of the objective 'Non oriented research' stands out, at almost 40 %, as well as the negative growth experienced by 'Exploration and exploitation of space'.. Figure 1.13. shows GBAORD as a percentage of GDP. The EU position is taken as a point of reference. This allows us to see for which countries the effort towards GBAORD is higher (or lower) than the average EU effort. Since the indicator GBAORD as a percentage of GDP can be easily affected by changes in GDP, the analysis is complemented by an examination of the respective trends of GBAORD and GDP, considered separately. This is performed in Figure 1.14., where the annual average growth rates of GBAORD and of GDP in PPS 1990 are considered together for the years 199599. From a combined analysis of Figures 1.13. and 1.14., four specific conclusions can be pointed out. •. Spain and Portugal are closing the gap with the other countries. GBAORD relative to GDP is still lower than the EU average, but the growth rate in the last five years is far higher than for the other countries, since GBAORD is growing at a faster rate than GDP.. •. Sweden is earmarking fewer resources to R&D: even if it remains above the EU level of GBAORD as a per centage of GDP, the indicator is deteriorating.. •. Two countries — Greece and Ireland — have values of GBAORD as a percentage of GDP that are far lower than the EU average (Figure 1.13.). As far as growth rated are concerned, in Greece and in Ireland both GBAORD and GDP are growing faster than the EU average.. •. Finally, Finland is by far the country producing the biggest effort towards public funded R&D and the growth rates indicate that Finland is maintaining a concerted effort over time.. 1.4. SPECIFIC DEVELOPMENTS IN THE EU MEMBER STA TES In this section we concentrate on the analysis of GBAORD in the Member States. The biggest performers of public funded R&D in absolute terms are the four biggest economies of the EU (Germany, France, Italy and the United Kingdom). Following these are Spain and the Netherlands, after which levels are much lower.. (7). For α more comprehensive analysis of Community RaD funding, see Chapter 2.. 34. é. ,. Statistics on Science and Technology in Europe. 10.
(37) Government. budget. appropriations. on R&D. 1. GBAORD as a % of GDP by country 1999(1). -1.13.. EL. Τ E R. IRL 1. Β Ρ A UK E IS (2) DK EU-15 NO S NL D F (3) %of GDP. FIN. 0.0. 0.6. 0.4. 0.2. 0.8. 1.0. 1.2. (!) Provisional data for 1999. C2) Exception to the reference period: 1997. ( 3 ) Exception to the reference period: 1998.. y. Source: Eurostat.. Annual average growth rates of GBAORD and GDP by country 1995-99(1). 14.. 12. 10. IRL. •. Q. O "6. 8. OJ. B. NO. 1. • IS. § C. 4. l. #. UK. S. F. •. ·. L,. 2. D 0. ··. /. EU 15. -. tL. ·. •. FIN. .NL. \ η κ. •. Ρ. »E. • R. k. i. — -10. -5. 0. 10. 5. 15. Annual average growth rate of GBAORD i1). Exception to the reference period — F: 1995-98.. Source: Eurostat.. 35 Statistics on Science and Technology in Europe eurostat. H. A Ρ.
(38) Research. 1 H A Ρ Τ E R. Development. The category 'Human and social objectives', even being in all countries one of the most important destinations of budgets, is in no case the first priority. The category Technological objectives' is highly important in all coun tries and the first priority in the cases of Spain and France.. When a consideration of the allocation of funds in the individual Member States is made (Table 1.1.), we can see that 'Research Financed from General University Funds' is in all countries among the three main priorities. Furthermore, in 8 out of 14 cases, it is by far the largest class of funding — Denmark, Germany, Greece, Italy, the Netherlands, Austria, Portugal and Sweden. Furthermore, Denmark, Greece, Austria and Sweden, where it represents more than 50 % of the entire budget, are particularly striking.. ». and. Finally it is in Ireland and Portugal that the largest amount of resources are devoted to 'Agricultural production and technology' while Spain, France and the United Kingdom devoted a large proportion of their GBAORD to the 'Defence' objective (respectively 30, 22 and 35 %).. GBAORD by NABS as a % of total GBAORD according to country 1999 t1). 1.1.. In % of total GBAORD Human. Agricultural. Research finance d from. Non. Other. EUR. GBAORD as. and social. Technological. producti on and. General University. oriented. civil. Mio. a % of GDP. objectives. objectives. tech nology. Funds (GUF). research. research. Defence. Total. 59 177. 0.76. 13.0. 20.1. 3.6. 32.1. 14.6. 1.0. 15.4. 100. Β. 1 387. 0.65. 9.4. 39.2. 3.0. 19.3. 23.2. 5.3. 0.6. 100. DK. 1 183. 0.74. 16.4. 15.6. 9.0. 58.5. ■. 0.6. 100. 16316. 0.83. 11.6. 22.6. 2.6. 38.6. 16.1. 0.2. 8.4. 100. 334. 0.29. 15.9. 15.1. 8.9. 52.0. 6.5. 0.2. 1.4. 100. 3 819. 0.54. 8.7. 26.8. 4.2. 21.8. 7.3. 1.2. 30.0. 100. 0.96. 9.8. 23.3. 4.0. 17.6. 21.1. 1.8. 22.4. 100. 256. 0.30. 13.5. 30.2. 20.0. 23.6. 12.7. 6 347. 0.58. 17.8. 21.4. 1.8. 45.3. 11.2. . 2.5. 100. 2 911. 0.76. 14.0. 20.6. 3.0. 44.2. 11.0. 4.2. 3.1. 100. 1 230. 0.64. 8.9. 8.1. 3.2. 65.9. 13.8. 0.2. 0.0. 100. 4.3. 2.0. 100. EU15. D EL E 2. F( ) RL. NL A. 644. 0.54. 16.7. 21.6. 13.1. 35.0. 7.4. FIN. 1 275. 1.08. 16.7. 38.4. 5.7. 25.4. 12.5. S. 1 725. 0.81. 15.6. 15.2. 1.9. 50.9. UK. 9 047. 0.79. 22.0. 5.8. 4.5. 19.0. 13.2. 65. 0.70. 54.4. 3.8. 23.5. . 18.3. 1 088. 0.76. 19.5. 19.2. 8.7. 39.1. 8.2. Ρ. IS(3) NO. 100. 1.4. 100. 9.1. 7.4. 100. 0.5. 35.0. 100. . 100. 5.3. 100. . (!) Provisional data for 1999. ( z ) Exception to the reference period: 1998. ( 3 ) Exception to the reference period for the indicator 'GBA ORD as a % of GDP: 1997. Source: Eurostat.. 36 Statistics on Science and Technology in Europe. m.
(39) Government. budget. appropriations. on R&D. 1. Notice to the reader. H A Ρ Τ E R. Analyses in this chapter refer to the data in the Eurostat database New Cronos at the time of writing. Because New Cronos is regularly updated as and when new data are received, it may be that data in extractions made or requested subsequently differ somewhat to those available at the time of writing. This chapter takes into account changes brought about by the adoption of the new system of national accounts — the European System of Accounts (ESA) — with ESA '95 replacing ESA '79.. References •. The Frascati Manual and identification of some problems in the measurement of Government R&D appropriations (GBAORD), document submitted to the NESTT meeting, OECD, Paris, 5-7 J une 2000, (Ref DSTI/EAS/STP/NESTT (2000)31).. •. Eurostat, NABS , Nomenclature for the analysis and comparison of scientific programmes and budgets, O f f i c e f o r Official Publications of t h e European Communities, Luxembourg, 1994.. •. Proposed Standard Practice for S urveys of Research and Experimental Development — Frascati Manual, OECD, Paris, 1993.. 37 Statistics on Science and Technology in Europe eurostat. é.
(40)
(41) PART Community. funded. and technological. research development. <s. Su. ¿A IP Τ. y Research DG Until the beginning of the 1980s, European cooperation in R&D was considered to be a relatively marginal phenomenon, compared to the volume of activity conceived, financed and executed at the Member State level. However, the 1950s had seen not only the creation of C ERN (C entre européen de la recherche nucléaire), but also the first steps in C ommunity cooperation following the signature of the Euratom Treaty. During the next two decades, other intergovernmental and international institutions were founded including the European Southern Observatory, the European Molecular Biology Organisation, the European Space Agency, the European Molecular Biology Laboratory.. Τ. SU F. ©. m w. (£ F 3. © SU. 39 Statistics en Setenes sai Tee/Meteen In innen eurostat. '^¿ί.
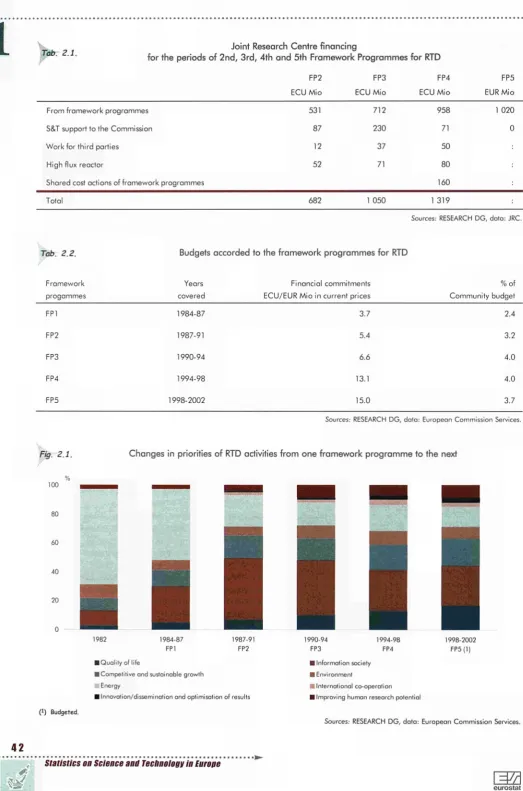
(42) Research. H A Ρ Τ E R. 1. 2.1. FRA MEWORK PROGRA MMES FOR RTD From the mid1980s onwards, European C ommunity funding of R&D has been ever more concentrated in multiannual Framework Programmes (FPs) for Research and Technological Development (RTD). There was an increasingly urgent need to have a mechanism for short to medium term scientific and technological plan ning, to coordinate the various C ommunity research and technological development actions, and to obtain an overview of what was going on. This resulted in the 1984 decision to launch the First Framework Programme, cov ering the years 198487. However, the first clear reference to RTD in the EEC Treaty was made with the adoption of the Single European Act in 1987. The Single European Act transformed and completed in many ways the Treaty of Rome. It introduced Article 130f (now Article 163), which gives the C ommunity clear jurisdiction in RTD by describing its objectives and by establishing the general framework for implementation, as well as Article 130h (now Article 165) on the coordination of European R&D policies at the national and C ommunity levels. It is in the Single European Act that the two basic mechanisms of current C ommunity RTD policy were defined formally for the first time: •. the Framework Programme i.e. the general decision that defines the content, the objectives and the system of C ommunity multiannual RTD policy;. •. specific programmes which implement the research activities described in the Framework Programme.. Development. policy, first and foremost the idea that the framework programme should include all RTD activities covered by the Treaty. In this respect all the RTD actions of the Community have to be included in the framework programme. These activities include basic research, technological development and demonstration activities. Another concept introduced by the Treaty of Maastricht is that rather than being limited to 'consolidating the science and technology bases of industry in the Community', its RTD activities can extend to other Community policies enshrined in the Treaty, such as energy, transport, environment, fisheries and agriculture. The primary objective of the Framework Programmes for RTD (as expressed in Article 163 of the Amsterdam Treaty) is to strengthen the scientific and technological bases of C ommunity industry and to encourage it to become more competitive at international level, while pro moting all the research activities deemed necessary by virtue of the other C hapters of the Treaty.. The Treaty of Maastricht added a number of new elements to C ommunity research policy. It was clearly felt that the measures taken under the new Treaty would have a greater impact on the coordination of the research effort of the Member States of the Union and, moreover, would adapt to the closer economic relationships that the Member States would have in the future. Furthermore, the new decisionmaking mechanisms at the Union level, which gave greater powers to the European Parliament, were also applied to research policy. Thus the codecision procedure (Article 189b, now Article 251), a joint European Parliament and C ouncil decision, was introduced for the adoption of the framework programmes for RTD. The Treaty also introduced several new concepts in the structure and the content of the C ommunity RTD. t1). and. RAD versus RTD I t should be noted that the European Commission uses the terminology Research and Technological Development, abbreviated to RTD, rather than the more classical Research and Development, RAD. This is a conscious decision given that Community RTD not only includes RAD but also demonstration, training, innovation and dissemination activities. From the statistical point of view it is important to understand that Community RTD is at one and the same time both wider and narrower in scope than RAD as defined by the OECD in the F rascati Manual. I t is wider because RTD includes demonstration, training, dissemination, innovation activities, etc. I t is narrower because of the macro and micro targeted nature of Community RAD. For this reason, and because in the past, Framework Programmes for RTD did not include all Community funded RAD, Community funding of RAD, as published for &BAORD (Government Budgetary Appropriations on RAD), does not equal Framework Programme budgets rl).. For further information see http://europa.eu.int/comm/research/faq.html#tocref3_2.. 40 ,. ■$&£. Statistics on Science and Technology in Europe. m±.
Figure
+7
Related documents
Figure 2.2: Cardiac hypertrophy occurs in late pregnancy 48 Figure 2.3: Total RNA is increased in late pregnancy 49 Figure 2.4: Serum metabolite profile in pregnant mice and rats
While most modern DSGE models assume agents have rational expectations and restrict attention to the effect of unanticipated shocks as drivers of the business cycle, my
It rates and ranks international and German language academic journals which are considered relevant for German speaking business researchers based on the quality assessments
Activities shall mean the following: testing, including but not limited to testing of the cardiovascular system, heart rate, muscle strength, endurance, and flexibility; training;
This is in contravention of section III(5) of the Minimum Housing and Health Standards which states that: All walls, windows, ceilings, floors, and floor coverings shall
In view of the possible demand in the future, the committee put forward the following recommended ethical principles to be observed regarding the use of assisted reproduction in
In this paper, we propose a new approach to constructing confidence sets for the timing of structural breaks. This approach involves using Markov-chain Monte Carlo methods to
TDT segment specifies the transport code and is specified with code BIG14 while BIG01 / NCP11 version (previous version) are in parentheses.. Anyway - the individual IG for
