
Simply a numbers game? : smart growth implementation and the determination of open space requirements in New Zealand : a thesis presented in partial fulfilment of the requirements for the degree of Master's of Resource and Environmental Planning at Massey
235
0
0
Full text
(2) Simply A Numbers Game? Smart Growth Implementation and the Determination of Open Space Requirements in New Zealand. A thesis presented in partial fulfilment of the requ irements for the degree of Master's of Resource and Environmental Planning at Massey University, Palmerston North , New Zealand. Rebecca Mary Eng. 2004.
(3) ABSTRACT This research is concerned with the New Zealand implementation of the USAdeveloped growth management tool known as Smart Growth, specifically in relation to the provision of open space at the local authority and community level. It uses Tauranga as a case-study as it is the first New Zealand city to seriously attempt to institute an urban growth strategy based on Smart Growth principles.. This research examines current issues with respect to reserve. provision in New Zealand where Smart Growth is implemented, and considers the possibility of alternative approaches to what is being currently used and proposed in the future that may be closer aligned to the demographic characteristics of intensified communities and the goals of Smart Growth.. Sources from the United States provide a limitless range of material advocating Smart Growth and its desired outcomes. There is little information in terms of the implementation of it, particularly in terms of specific aspects such as open space provision . The discussion draws upon both overseas and New Zealand literature to provide an origin for current approaches to open space provision. It becomes clear that the models used by many territorial authorities in New Zealand are based on demographic and community characteristics that hold little relevance in the twenty-first century.. It is thought that an alternative approach may also go some way towards providing territorial authorities such as Tauranga City Council {TCC) with a policy tool for providing open space that may be founded to a lesser extent on quantitative measures. Further it may provide guidance for other local authorities that are contemplating or are using urban growth management such as Smart Growth or any such approach that involves residential intensification. It is further hoped that this research will draw other useful conclusions regarding the general approach to reserve provision across New Zealand..
(4) ACKNOWLEDGEMENTS I would firstly like to thank Craig Batchelar for providing me with an insight in to the potential issues related to implementing Smart Growth and a number of topic options. From the Resource & Environmental Planning Programme at Massey University I would like to offer a most heartfelt acknowledgement to my supervisor Caroline Miller, and a congratulatory note for so effectively providing additional services as my therapist. Also of Massey University is Mike Roche, who I would like to acknowledge for assisting me in a time of need.. Special mention is due to the Environmental Policy staff at Tauranga City Council, including Cheryl Steiner, Andy Ralph and David Phizacklea . Thank you to Rex Maranda for providing me with maps.. Every student. balancing. work with. academia. must acknowledge. the. personalities in th eir place of employment who inevitably bear the brunt (patiently) of somebody attempting to achieve that balance with success.. I. wou ld like to thank Beca Carter Hollings & Ferner Ltd, specifically the planning team , which made it possible for me to do exactly that. They are Bryce Julyan , Don Lyon , Graeme Roberts, Greg Pollock, Ainsley Mcleod, John Duffy, Christine Ralph , Keith Frentz, Lucy Brake, Ainslie Bennett, and Fiona Low.. I. would also like to thank John Revington and Paula Scher for the donation of photocopying and printing resources.. I wou ld finally like to thank all of those people close to me who supplied their enduring love, patience and encouragement throughout a year that has turned out to be a great one. You know who you are.. ii.
(5) CONTENTS ABSTRACT ................................................................................................................... i ACKNOWLEDGEMENTS ............................................................................................ ii 1.0 Introduction ...................................................................................................... 1 1.1 Tauranga: A Thumbnail Sketch ................ .. ...... .... ........ .. .......................... .. .. .. 1 1.2 SmartGrowth Bay of Plenty ....................................... .. ...... .. .................... .. .. .. 11 1.3 Reserve Provision in Tauranga .... .. .. ............. ................... ...... .... .. .. .... .... ...... . 14 1.4 Aim and Objectives ... .. ........ .................. .... .. ...... .... ........................... .. ... ..... ... 17 1.5 Significance of Study ................. .. .... .................. .. ........ ................. .............. .. 18 Scope of Research ................ .. .... .. ........ .. ...... .................. ............ ........ .. ...... . 18 1.6 2.0 Methodology ................................................................................................... 19 2.1 Literature Review ................................................................................. ...... .. . 19 2 .2 Desktop Study ....................................... .. ................................................. .... 20 2 .3 Fieldwork .. ......................... ......... .... ... .. ... ....... ..... ... ..... ........ ... ............. ... ....... 20 2.4 Development and Application of An Appropriate Method ...... .... .... .. .. .. .......... 21 2.5 Research Process ...... ... .... ... ...... ... ... ................... ...... .... ....... ... .. .. .......... .... ... 21 3.0 Smart Growth: A Review of Literature and Sources .................................... 23 3.1 Smart Growth Theory ........................................................ .. ......................... 23 Sustainable Development.. ......................... ... .. ...... ............. .............. ..... 24 3.1.1 Smart Growth Defined .... .. .................. .. .......................... .......... ............. 26 3.1.2 3.1 .3 Smart Growth in New Zealand ........ ............................ ............ .. ...... ... .... 28 Residential Intensification ...................................... .... ........ .. ..... .. .... .... .. . 30 3.1.4 3.2 Implementation ................ .... ....... ... ... .. ... .. .... ... .... ...... ........ .. .. .... .. .... .. .. ... .. .... . 36 Smart Growth Challenges .... .. ... .... .............................. .. ............ ...... ........ .. .... 41 3.3 3.4 Conclusion ..... ... ... ... ..... ..... ............ ......... ..... .. .. .... ............. ....... ....... ..... ..... .. .. . 43 4.0 A Review of the History of Reserve Provision in New Zealand .................. 45 4.1 The City Beautiful Movement.. ........ .............. ..... .............. .. .................... .. .. ... 45 4.2 Recreation Planning : Historical Overview ...... .. .... .............. .. .......... .. ............. 48 4.2.1 Radius of Efficiency .............. .. ................ ....... ..... .. .............. .. .......... ..... .. 53 4.2.2 Minimum Standards ........ .. ..... .......................... ... ... ... .... .. ...... ... .. ... ... ...... 55 4.2.3 Strategic Recreation Planning .. .... .. ... .. .. .............. .. .. .. ......................... .. . 57 4.3 What is Required in the Future? .. .......... .. .... .......... .. .. .. .. ........ ...... ...... .. .... .... . 58 4.3.1 Reserves & Recreation in the 21 st Century .... ........ .. .. .. ...... .... .... ............ 59 4.3.2 Demographics and Recreation .............. .. ............ .................................. 62 Conclusion ....... .............. .......... .. ..... ... ...... ... ... .......... ... ..... ...... ... .. ...... ... ......... 67 4.4 5.0 The Legislative Framework ........................................................................... 69 5.1 Legislation ............................. .. .... ...... ...... ... .... .... ..... ... .... ............... ... ... ....... .. 69 5.1 .1 Resource Management Act 1991 .......................... .. .... .... .. .. .. .. ........ .. .. .. 69 5.1.2 Local Government Act 2002 ........ ................ .. ........ .... .... ........ .. .... ...... .. .. 70 5.1.3 Reserves Act 1977 .. .... ...... .... ........ .... .... .... .. .. .... .. ... .... .............. .. ... ...... .. 72 Conclusion ..... ........ .................... ....... .... ........ ... ... .. ... .... .. ..... .. .... .......... ....... ... 73 5.2 6.0 Alternative Methods for Assessing Open Space ......................................... 75 6 .1 Theoretical Considerations .. .... .... .. .. .. ........ .. ................................................. 75 Alternative Methods of Assessing Open Space Provision .. .. .... ...... .... .. .. .... .. . 77 6.2 6.2.1 CABE Space: Green Space Strategies ............................................ ...... 78 ODPM: Planning for Open Space ...... .... .. ... ..... .. .... .... .. .. .. ...... ...... ....... .. . 79 6.2.2 URGE: Making Greener Cities .... .... .... ........... .. .... ... ... .. ....... .... ....... .... .. .. 82 6.2.3 Alternatives ...... .. ................... ....... ... ...... .... ..... .. .... ... .................. ...... .... ........ .. 83 6.3 6.4 Assessment and Audit of a Green Space: Bayfair .. ................ .. ........ ...... ..... . 89 Step One: Identifying Local Needs .. .. ................................ .. .... .. ...... .. .... 90 6.4.1 6.4.2 Step Two: Auditing Local Provision .. .... ...... .. ............ ... ............ .. .... .. .... ... 92 Step Three: Setting Provision Standards .................... .. ......................... 94 6.4.3 Step Four: Applying Provision Standards .. ................ .... .. .. ........ .... .... .. .. . 95 6.4.4 Application of An Alternative Assessment Method: Discussion .................... . 95 6.5. iii.
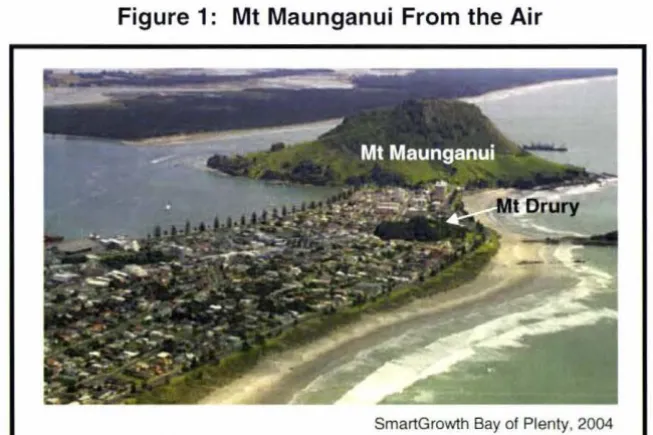
(6) 7.0 Analysis and Discussion ................................................ ............................. 102 7.1 lntroduction .... ............ .... .. ... ..... ... ........................................................ ........ 102 7.2 'Recreation A' Passive Reserves ... ... .................... .................... ..... ... .. ... .... . 102 7.2.1 Berescourt Reserve ....................................... ........ ....................... .. ..... 103 7.2.2 Epsom Reserve ............................. ...... ......... .. ..................................... 105 7.2.3 Eversham Road Reserve ....... ................................. .... ..... .. ..... ............. 106 7 .2.4 Grenada Park 'Recreation A' ............................................................... 106 7.2.5 Pacific Park ............ .......... .... ............................................. ..... .. .. ......... 110 7.2.6 Tahara Crescent Reserve ............................ ....... ................................. 111 7.3 Recreation 'B' Active Reserves ............................ .. ...... ......................... ...... 11 2 7.3.1 Oceandowns Reserve ................................. ........................................ 112 7.3.2 Grenada Park 'Recreation B' ........................... ... ............. .................... 114 7.3.3 Links Avenue Reserve ......................................................................... 116 7.4 WhatNext? .......................................... ....................................................... 117 8.0 Conclusions and Recommendations .......................................................... 119 Conclusions ...................................................................................... .... ... ... 119 8.1 Introduction .................................................................................... .... .. 119 8.1.1 8.1.2 Medium Density Living : Whom Do We Cater For? ............................... 120 8.1.3 On-Site Amenity Standards .......................... ....................... ..... ...... .. ... 122 8.1.4 Quality of Existing Open Spaces .. .. ..................................................... 123 Implementing Smart Growth in Tauranga: Concluding Comments ....... 123 8.1.5 8.2 Recommendations ...................................................................................... 125 Stepping into the Twenty-First Century ...................... ......... ....... ... ....... 125 8.2.1 8.2.2 The Way Forward for Tauranga City Council ...................................... . 126 APPENDICES .......................................................................................................... 129 Appendix One ...... ................................................. .. .............................................. 130 Tauranga District Planning Maps E2, S02 & S0 3 .. ........ ..... .... .......................... 131 Appendix Two .............. ..... .... ................................................................................ 135 Audit Form Example ... ................................ ... .......... .. ... ........... .......................... 136 Tauranga District Planning Maps G5, H6 & H7 ..... .. ..... ...................................... 141 Appendix Three ..... .... .. ............. ................................ .. .. ...... ........................ ........... 145 Completed Audit Forms - Pi lot Assessments .. ..... .. ..... ............ ........ ... .... ....... ... 146 Revised and Completed Audit Forms ......................... ..... ................................... 151 Assessment Results .... ................................................................... ..... .............. 188 Draft Concept Plans: Oceandowns Reserve , Grenada Park Reserve, and Li nks Avenue Reserve ..... ............. ........................ ........... ........................................... 190 Tauranga District Council Neighbourhood Reserves Managem ent Plan Fact Sheets .......... .... ........................................................ ......................................... 194 Tauranga District Council Best Practice Guide for Neighbourhood Reserves .... 201 REFERENCE LIST ................................................................................................... 223. iv.
(7) List of Figures Figure 1: Mt Maunganui From the Air ............................ ............................................... 2 Figure 2: Total Popu lation of the Tauranga District ...................................................... 4 Figure 3 : Tauranga District New Dwellings Created by Zone ...................................... 6 Figure 4: Suburbs of Tauranga City ................................................ ............................. 8 Figure 5: Western Bay of Plenty Sub-Region - SmartGrowth .................................... 11 Figure 6: Sub-Regional Development Pattern Map - Tauranga City .......... ................ 13 Figure 7: Arlington County, Virginia .................................. ....... .......................... ......... 28 Figure 8: Illustrations of Residential Development Types in the Western Bay of Plenty ....................... ..................................................................................................... 34 Figure 9: Breaking the 'Back-to-Back' Rule ................................................................ 39 Figure 10: Street Orientation 1.. ....................................................... .. ...................... ... 40 Figure 11 : Street Orientation 11 ............................................................................ . ...... 40 Figure 12: History of New Zealand Planning System ................................................. 4 7 Figure 13: Scenic Corridor Reserves Post 1908 ........................................................ 50 Figure 14: Activity Levels of Adults .......................................... ...................... ............ 63 Figure 15: Top Sports and Active Leisure Activities for Older Adults .......................... 65 Figure 16: Proposed Bayfair Residential Intensification Node .................................... 93 Figure 17: Memorial Park ..................... ...................................................................... 96 Figure 18: Wharepai Domain .............................................. ......................... .............. 97 Figure 19: Berescourt Reserve ........................................... ..................................... 104 Figure 20: Epsom Reserve ............................................................. .. ....... ................ 105 Figure 21 : Eversham Road Reserve ........................................................................ 106 Figure 22: Location of Aquatic Centre ... .. .... ............... .... ................. ... ........ .. .... ........ 108 Figure 23: Aquatic Centre Layout ............................... ............................................. 108 Figure 24: Aquatic Centre Under Construction ......................................................... 109 Figure 25: Grenada Park 'Recreation A' ..................... ............................................. 109 Figure 26: Pacific Park .... ......................................................................................... 111 Figure 27: Tahara Crescent Reserve ............. ............................................... ........... 112 Figure 28: Oceandowns Reserve ............................................. ................................ 113 Figure 29: Grenada Park 'Recreation B' .................................................................. 11 5 Figure 30: Li nks Avenue Reserve ............................................... ............................. 116 Figure 31 : Policy Decision-Making for Existing Reserves .... ..................................... 127. v.
(8) 1.0 Introduction This research is concerned with the New Zealand implementation of the USAdeveloped growth management tool known as Smart Growth, specifically in relation to the provision of open space at the local authority and community level , using Tauranga as a case-study example . This research will examine current issues with respect to reserve provision in Tauranga where residential intensification will be implemented , and considers the possibility of alternative approaches to what is being currently used and proposed in the future that may be closer aligned to the demographic characteristics of intensified communities and the goals of Smart Growth . An alternative approach may also go some way towards providing territorial authorities such as Tauranga City Council (TCC) with a policy tool for providing open space that may be founded to a lesser extent on quantitative measures . Further it may provide guidance for other local authorities that are contemplating or are using urban growth management such as Smart Growth or any such approach that involves residential intensification.. Chapter One sets the scene in terms of the general growth issues facing Tauranga and the steps being taken to accommodate future growth .. The. provision of reserves is a small piece of a very large strategy which itself is derived from the particular growth issues facing Tauranga.. 1.1 Tauranga: A Thumbnail Sketch "Tauranga City is in the heart of the Bay of Plenty region . Tauranga City extends from the Wairoa River in the west to the Kaimai-Mamaku Ranges in the south and the Pacific Ocean on the north and east. People come to live here for 'the lifestyle ' and they enjoy an ever-increasing number of 'bigger' city facilities and attractions.". (Tauranga City Council, 2004). 1.
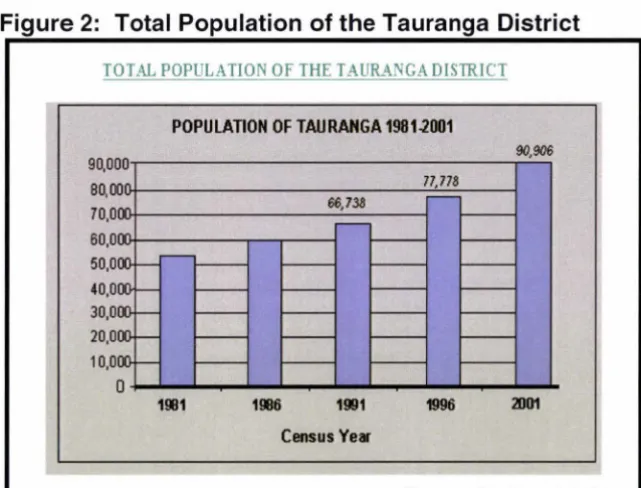
(9) Tauranga is one of the smallest of New Zealand 's territorial authorities in terms of land area, covering an area of 12,742 hectares. In the Wellington Region , the Hutt City Council has a similar population at 95,473 (Hutt City Council, 2004), with a land area of 37,673 hectares (Local Government New Zealand, 2004) .. This is why Tauranga faces particular issues regarding growth and. reserve provision because land is at a premium .. The city is located on the east coast of the North Island of New Zealand, and is 206 kilometres southeast of Auckland , and 107 kilometres east of Hamilton. Two key features dominate the landscape of Tauranga. The harbour, which is thought to have been part of a plain that was flooded following the end of the last ice age. Mt Maunganui , at 232 metres high and Mt Drury are remnants of an ancient volcanic area (Tauranga City Council, 2004). Figure 1 shows the location of Mt Maunganui , and Mt Drury surrounded by housing.. Figure 1: Mt Maunganui From the Air. SmartGrowth Bay of Plenty. 2004. Tauranga is one of the fastest growing areas in New Zealand.. The 2001. census data shows that the population grew by 13,128 or 16.9% between 1996 and 2001 (Tauranga City Council, 2004). This is significantly higher than the nationwide growth rate of 3% over the same period. While population growth has generally slowed in New Zealand's 'sun-belt' regions over the last decade, Tauranga is the only one to have experienced a similar percentage increase in. 2.
(10) population in the 1991-1996 to the 1996-2001 census periods (SmartGrowth Bay of Plenty, 2003). The term 'sun-belt' originates from USA, being the area extending from Virginia to Florida in the southeast and through Nevada in the southwest and also southern California (Mcleay, 2002). Between 1970 and 1990 this 'sun-belt' area experienced population growth well above the national average. From its origins in the USA, the term 'sun-belt' is now applied to cities or regions that are attracting migrants and industry. Much of the attractiveness of these locales stems from their favourable climate. The western Bay of Plenty is one of New Zealand 's 'sun-belt' regions along with the Far North , Thames Coromandel, Whakatane, Opotiki, Nelson City, Tasman and Marlborough . Between 1996 and 2001 47% of Tauranga's population increase was a resu lt of internal migration. 1 Only 52,692 residents out of 90,906 (58%) currently living in Tauranga in 2001 lived in the city in 1996. Gains were found in all age cohorts , except the 20-24 year old class that recorded a net loss for the city. The biggest gain was in the 30-39 year old age cohort (Tauranga City Council , 2004 ).. In the next 15-25 years this age class will account for the large. proportion of Tauranga's population that is retired , affecting the nature of housing and public facilities required .. Figure 2 shows the total population. growth of the Tauranga District between 1981 and 2001 .. 1. 31% of population increase resulted from natural increase and 22% of growth was derived from o verseas m igration. Tauranga City Council, 2004.. 3.
(11) Figure 2: Total Population of the Tauranga District TOT AL POPULATION OF THE TAUR...A.NGA DIS1RICT POPULATION OF TAURANGA 1981.2001 90,906 90,ooo..-----------------,.---.. 1!111. 1!116. 1991. 1996. 2001. Census Ye• Tauranga City Counci l, 2004. In 1989 the local authority reforms instituted by the Local Government (Amendment) Act 1989 amalgamated the former Mount Maunganui Borough Council , Tauranga City Council and Tauranga County Council.. Much of. Tauranga's rural-residential growth that occurred following 1989 was within the former Tauranga County Council areas such as Bethlehem and Papamoa. Tauranga's population reached 100,000 on or around March 2004 , at which time Tauranga District Council became Tauranga City Council.. The Tauranga community consists of three distinct 'generation bulges' (Tauranga District Council , 2000) . The 25-49 year age group accounts for the largest proportion of Tauranga's population , in a pattern that is similar to New Zealand's overall population.. The 20-24 year old age group decreased from. 6% of the Tauranga population in 1996 to 5% in 2001.. The loss of young. people from Tauranga can be attributed to tertiary education providers being located mainly in other cities, to the 'overseas experience' and to larger employment centres of Auckland, Wellington and Hamilton.. As at the 2001. census, 17.2% of Tauranga's population is aged over 65, compared with a national figure of 12.1 %. A University of Waikato Study in 2002 showed that people in the 35-50 year age bracket with children comprised the most significant additions to Tauranga between 1996 and 2001, exceeding the influx. 4.
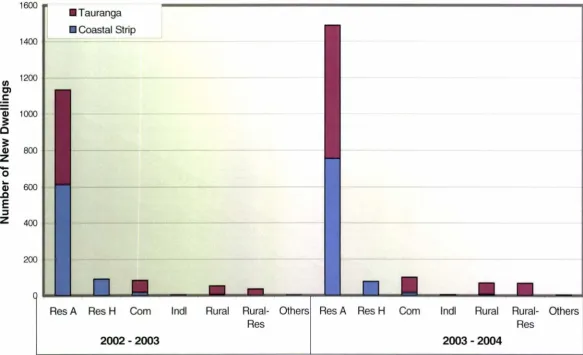
(12) of retired over 65-year olds (Bedford , 2002). The study also found the main reasons attracting people to Tauranga was the lifestyle and climate, while most who left did so to pursue career and job opportun ities elsewhere .. In the five-year census period between 1996 and 2001 , Tauranga has had 19.3% growth , with 6,675 new dwellings being built. This percentage volume is comparab le with more populous areas and large cities such as North Shore City, Auckland City and Christchurch City. In Tauranga 1,400 dwellings were built in 2002/03 , compared with 1,057 in 2001 /02 . Figure 3 on the following page shows some more recent dwelling figures and also disaggregates the figures by zone . 'Res H' represents the higher density zoning (the 'Residential H' zone), where a minimum density of 1 unit per 100m 2 is provided for as a Controlled Activity in Mt Maunganui under the Tauranga District Plan .. The. majority of the residential areas in Tauranga are zoned 'Residential A', hence the high dwelling statistics in this zone.. 5.
(13) Figure 3 : Tauranga District New Dwellings Created by Zone. 1600. • Tauranga J. 1400. UI. • Coastal Strip. t-====-- - - - - -. 1200. C). .5 Q). c== ==. Q). z. 0. "-. Q). .c E :::J. z. Res A. Res H. Com. 2002- 2003. lndl. Rural. Rural- Others! Res A Res. Res H. Com. lndl. Rural. Rural- Others Res. 2003 - 2004. Tauranga City Council, 2004. 6.
(14) Parts of Tauranga are growing faster than others ; with the older more established suburbs showing only small or moderate increases or decreases in population (Tauranga City Council , 2004) . Accessibility to facilities and services such as schools, supermarkets, and reserves , is a major reason why people may chose to live in established areas of the city (Tauranga District Council , 2000). Other parts of the city have shown a moderate increase in population primarily due to infill residential development, including apartment, townhouse and retirement complex developments. The growth in dwellings in the following suburbs is representative of the 'moderate' increase in the census period between 1996 and 2001 :. Bellevue +11 .0% Brookfield +7. 7% Omanu +6 .1% Mt Maunganui North +2 .7%. These figures compare with new developing (greenfields) areas of the city, which are experiencing high growth rates . There was significant greenfields population growth between 1996 and 2001 , with the largest increases in these areas :. Bethlehem East +371.5% Bethlehem +24 .2% Pyes Pa +295.4% Welcome Bay +27 .6% Te Maunga +32.8% Papamoa West +96.8% (Tauranga City Council , 2004). Figure 4 on the following page shows the location of both the developing greenfields areas and the 'moderate growth' suburbs .. 7.
(15) Figure 4: Suburbs of Tauranga City Tauranga District Council Map Server. Pacific Ocean Tauranga Harbour. _) Kilometers. 3. >. ;) Welco~. Bay. Tauranga has a high proportion of joined dwellings, which generally reflects a higher density lifestyle. The average proportion of separate dwellings is 79 .6%, compared with 81 .8% nationally. There is also an above average population density of 618 .7 people per square kilometre compared with 14.5 people per square kilometre nationally (Statistics New Zealand , 2004).. The higher than. average population density may be attributable to some extent to the geographic limitations of the harbour and the relatively small land area of the city's jurisdiction overall. It also reflects Tauranga's 'retirement capital ' status , which probably sees more people than on average living in retirement villages and apartments. The limit to Tauranga's growth in the past was always the existence of the high versatility land that surrounded it.. This land was. committed to productive uses, which in turn created employment. Prior to 1991 , this meant that the land had to be protected as a matter of national importance under the provisions of the Town and Country Planning Act 1977.. This. preservationist approach has very likely carried over into existing regimes , as the past development of the land for productive uses would make it difficult and. 8.
(16) expensive to convert to residential uses. The recovery of the kiwifruit industry has probably also reinforced this trend .. Mt Maunganui North (the high density Mt Maunganui 'Residential H' zone) experienced a significant boom in the apartment market between 1996 and 2001 , though an equally significant population boom did not accompany this ; recording only 2.7% increase, compared with an overall 19% population increase for the city between 1991 and 1996 (Tauranga City Council , 2004). This is attributable to the high number of unoccupied dwellings indicating that much of recent development in Mt Maunganui North provides seasonal or holiday homes for people who ordinarily live outside the city2. The statistics indicate that in recent years greenfields development accounts for a large percentage of residential growth in the area . The Tauranga City Council State of the Environment Report (2000) found that the provision of community services and facilities is not currently meeting the pace of development in expanding greenfields areas such as Bethlehem and Papamoa. In the future Tauranga City Council , it if pursues its present policy approaches, will need to ensure that these areas continue to meet the needs of the recreational and social needs of these communities and are pleasant places to live.. The median income of Tauranga at the time of the 2001 census was $16 ,900 per annum , compared with the national figure of $18 ,500 per annum . Income is measured. regardless. of. employment. Superannuation beneficiaries. Tauranga 's residents .. status ,. which. includes. National. This group forms a high proportion of. The overall pattern reflects the fact that Tauranga. currently has a larger proportion of retirees than the national average . The Statistics New Zealand (2004) Bay of Plenty Household Labour Force Surveys, for the March 2004 quarter, shows that there are 109,500 people employed and 7,800 people unemployed. The figures show that there are 61,000 people not in the labour force at all, within a population of 178,300 of working age. This equates to a labour force participation rate of 65 .8% and an overall unemployment rate of 6. 7% . The low labour force participation rate may be a. 2. The 2001 census indicates that 30.1% of dwellings in the Mt Maunganui North Census Area Unit were unoccupied .. 9.
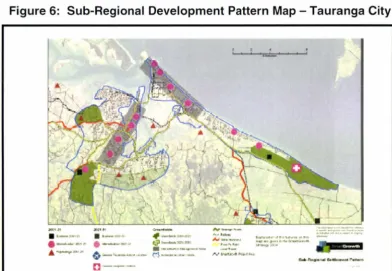
(17) result of the high number of retirees in the area that still fit into the working age population category.. Tauranga is a fast growing city with some demographic peculiarities that have been described above. Though it is not only Tauranga City that is coming to terms with the impact of rapid urban growth . Western Bay of Plenty District Council is dealing with accommodating accelerating growth in historically rural centres such as Omokoroa , Katikati and Te Puke . The two local authorities are facing significant growth challenges within the geograph ic area constrained by the Kaimai Ranges to the south and the Pacific Ocean to the north . TCC and WBOPDC formed a partnersh ip with Bay of Plenty Regional Council to address growth management from a sub-regional perspective. 3 It was intended that the joint partnership would ensure effective and integrated leadership in managing the long-term growth of the sub-region .. SmartGrowth Bay of Plenty was a. project aimed at providing strategic direction for the sub region over the next 50 years in terms of housing, employment, transport, industry, and community facilities .. 3. Bay of Plenty Regional Council, W estern Bay of Plenty District Cou nci l and Tauranga City Council joi ntly fu nded the SmartGrowth project in order to develop a coord inated approach to accommodating growth within the sub-region over the next 50 years .. 10.
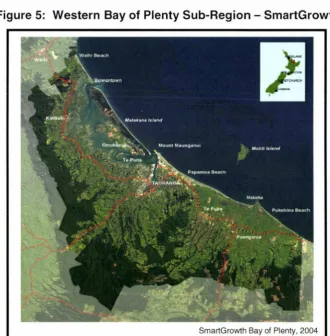
(18) 1.2 SmartGrowth Bay of Plenty The western Bay of Plenty sub-region has been developing ways in which it will direct its future urban growth in light of rapid development since the 1950s. The goal of SmartGrowth was to prepare an agreed action plan for the western Bay of Plenty sub-region that will make provision for sustainable urban and rural development, specifically for the next 20 years, and generally for the next 50 years. Figure 5 shows the extent of the western Bay of Plenty sub region and its location within New Zealand .. Figure 5: Western Bay of Plenty Sub-Region - SmartGrowth. SmartGrowth Bay of Plenty, 2004. It is useful to gain a perspective of the likely population changes in the subregion before considering the specific style of Smart Growth that will be implemented within Tauranga City.. The modified net migration population. forecast for the sub-region is as follows :. 11.
(19) 2001: 130,0004 2026: 198,000 (+ 70%) 2051: 289 ,000 (+120% base 2001). The 2051 figure of 289 ,000 is a predicted 120% increase from the base population in 2001. An additional 160,000 people in the sub-region equates to approximately 70,000 households and 60 ,000 new jobs.. It is expected that. households will change over time. Traditional families are likely to double in number, but single and two person households are likely to treble by 2051 , reflecting the prediction of a higher cohort of retired population. (SmartGrowth Bay of Plenty, 2004 ).. The western Bay of Plenty population is aging : 5,000. people were 80 years and over in 2001 , increasing to 35,000 by 2051 . As a consequence of this growth , by 2051 the following will be required to accommodate population growth :. •. 4 ,000-6 ,000 hectares for additional housing ;. •. 1,000 hectares for additional industry;. •. 1,000 hectares for sub-regional parks based on current policy5. •. 650 hectares for recreation reserves based on current policy,6 and. •. 200 hectares if Tauranga Airport relocation is to occur.. The current residential and business land capacity will meet half of forecast land needs over the next 50 years. SmartGrowth is concerned with meeting these land use needs while also ensuring that by 2050 the western Bay of Plenty will be a unique sub region that has maintained and improved its natural and cultural environment, enhanced the lifestyles of its communities and provided for the social needs of its people (SmartGrowth Bay of Plenty, 2004 ). Other goals for the sub-region by 2050 include the provision of an efficient and affordable infrastructure, and the implementation of an efficient and integrated planning process for growth management. The SmartGrowth Strategy supports a fundamental shift away from focussing largely on accommodating low-density 4. The population of the sub-region includes both Tauranga City Council and Western Bay of Plenty District Council. The Sub-Regional Parks policy sets out the standards for reg ional park provision in the sub-region. 6 Both Tauranga City Council and Western Bay of Plenty District Council currently provide reserves on a population : area ratio . 5. 12.
(20) suburban residential development to supporting a more compact and balanced 'live, work and play' approach . The 'live, work, and play' approach is concerned with facilitating mixed use development, where communities can access home, work and open spaces within compact catchments, thus reducing energy demands from transport. The details of this approach , including the potential contribution that residential and public realm design guidelines can make towards meeting open space needs of the community and maintaining amenity values in areas of higher residential densities, is discussed in more detail in Chapter Three . The Sub-Regional Development Pattern Map for Tauranga City provides an indicative plan for growth in the sub-region to 2051.. Figure 6: Sub-Regional Development Pattern Map - Tauranga City. · ----~. ·--.,. .. ,_ 0 -..-....... o ---·-. "--·..,&j..t'I ·-----..._....,, ,. M ..-. • .---. ,,,..,,.,.,....,,. ..... 13.
(21) 1.3 Reserve Provision in Tauranga As part of its planning for future urban growth , TCC has researched current and future reserve provision across the city.. Population projections have been. matched to the reserve land bank to determine the adequacy of current supply. 7 From this TCC were able to identify areas where surplus and deficiencies are likely, based on TCC's methodology for providing reserves across the city.. TCC currently applies a level of service provision for active and passive reserves (based on population) as follows:. Passive Reserve: 1. 7 hectares/1000 population Active Reserve : 1.7 hectares/1000 population. Passive reserves provide space for casual play, relaxation , family activities and other forms of 'informal' leisure. Active reserves provide space for organised sport and associated facilities , such as playing fields , modified surfaces like tennis courts and club buildings.. An active reserve can also fulfil a passive. reserve function , but its primary purpose is not to provide for passive leisure opportunities .. The historical basis for this formula is expanded upon in following chapters . This formula is used in loose conjunction with TCC 's Best Practice Guide for Neighbourhood (Passive) Reserves , to guide active and passive reserve provision across the city. It is this formula that indirectly provides an amenity contribution within new urban areas without great success - development contributions may not result in targeted spending i.e. the cumulative effects of many higher density developments, and may not consider specific residential amenity outcomes.. The Best Practice Guide for Neighbourhood Reserves. 7. Two scenarios were examined within each RIN ; 1. Population projections based on status quo growth; and 2. Population projections based on residential intensification.. 14.
(22) provides general guidance for the spatial distribution of reserves in the city, stating that there should be a neighbourhood reserve with a 400 metre pedestrian catchment. A travel cost method is used for playgrounds , where the policy states that there should be a local neighbourhood playground within 5001000 metres of 'most' residences (Tauranga City Council , 2002). The theory behind the travel cost method is that neighbourhood reserves are intended to provide for the local open space and recreational needs of the immediate residential community and should therefore be located in easy walking distance for all residents (the Best Practice Guide for Neighbourhood Reserves is contained in Appendix Three).. Eng undertook research in 2002 using geographic information systems , to identify and assess the various constraints to the implementation of residential intensification nodes within what is now defined , by SmartGrowth , as Intensification Management Areas (Mt Maunganui and the Tauranga isthmus). One aspect of the research was an analysis of TCC's population projections against reserve supply and the application of a location allocation analysis to determine the adequacy of travel cost method recommended in the Best Practice Guide for Neighbourhood Reserves . That study concluded that while some of the proposed residential intensification nodes had an adequate long term supply of reserve land based on population projections , some of these nodes did not meet the travel cost method recommended in the Best Practice Guide for Neighbourhood Reserves . At a basic level , this research identified the potential to consider a wider range of criteria in the provision of reserves where residential intensification is implemented .. The following provides a. summary of the future reserve provision in four defined areas of the city that have been identified in SmartGrowth as short-term residential intensification nodes.8. 8. Short term in SmartGrowth includes those areas earmarked for plan changes to allow mixed-use Residential Intensification between 2001 and 2021 . The proposed location of the Residential Intensification Nodes is provi ded on page 14.. 15.
(23) 1. Mt. Maunganui. Residential. 'H'. and. 'A'. Zones:. If. residential. intensification was implemented, this node would have a reserve deficit. There are areas of the node not well serviced by reserves in terms of the travel-cost method (south-east end). This is a part of the city that is well serviced by conservation reserve , such as Mauao itself, which covers 75 hectares.. Mauao (Mt Maunganui) is a significant recreation resource. that cannot be taken in to account in any active/passive reserve analysis. It is not accounted for in the levels of service and location allocation analyses because it is zoned 'Conservation' and partly managed by the Department of Conservation . The coastline and harbour edge can be informally included in terms of its contribution to recreation and amenity values in the node. The extent of the Conservation zoning within the Mt Maunganui 'Residential H' and 'A' zones shown on Planning Maps E2 , 802 and 803 in Appendix One . 2. Central Business District (CBD) Node: It was identified that this node has an adequate provision of reserve land . Population projections for the node assessed against current levels of service show that the node would have a reserve surplus of 4 .5 hectares (Eng , 2002) . Tauranga and Wharepai domains provide 11 hectares of active reserve . The result of applying the location allocation analysis was that the western side of the node is not well serviced by reserves in terms of distance. 3. Eleventh Avenue : This proposed node is adjacent to the CBD Node in Tauranga.. The population projections for this node reveal a passive. reserve surplus of 4.7 hectares, while the node would have a deficit in terms of active reserves in the future . 4. Bayfair: This proposed node is located in Mt Maunganui.. Residential. intensification population projections for this node reveal that in the future there would be a reserve deficit of 2.5 hectares. The location allocation analysis shows that the node is almost entirely serviced by reserves within a 1,000 metre walking distance. Grenada Park provides extensive areas of active reserve . An aquatic centre is currently under construction. 16.
(24) in the north western corner of Grenada Park, opposite Bayfair Shopping Centre.. The historical approach to providing reserves is based on a ratio of population to area , which is an entirely quantitative measure. A reasonable level of service is one that satisfies the needs of the community related to formal and informal recreation (Beca Carter Hollings & Ferner, 1996). This approach is certainly applicable where there is sufficient land to meet the demands of the population , such as in greenfields developments . In light of the above results , TCC is faced with the issue of obtaining further supply of land within some proposed RINs to meet the levels of service requirements as determined by the present policy. This measure does not take in to account the demographic of a community within the RIN , or the goals of Smart Growth . In order to solve the land supply dilemma and provide public reserves that meet the needs of the target community and the goals of SmartGrowth , there is a need to consider an alternative methodology for providing reserves within RINs. It is this issue that is central to this research .. 1.4 Aim and Objectives The aim of this research is to identify a possible alternative methodology for determining the provision of reserves within a Smart Growth lead development strategy with specific reference to Tauranga. This reflects the fact that to date Tauranga is the first New Zealand city to commit to an overall growth management strategy, which is based on a Smart Growth approach.. If a. standardised approach to reserve acquisition can be developed using a Tauranga case study, then its principles should have applicability in other New Zealand cities , which adopt a Smart Growth approach . The way in which this is to be achieved is explained in more detail in Chapter Two .. 17.
(25) 1.5 Significance of Study The provision of open space is one of the issues for any council trying to advocate a higher density of development.. It is hoped that this research will. provide advice to practitioners in terms of implementing Smart Growth or any other policies that involve higher densities of residential development. It is also thought that this research will draw attention to the history underlying traditional mechanisms of providing open space, and critically assess the relevance of such approaches in terms of the characteristics of modern society.. 1.6 Scope of Research There is a range of limitations affecting this research. One is time constraint. The research was undertaken over a period of one year so this reduced the extent of detail that could be examined and provided .. Cost was another. limitation - a significant part of the approach recommended by CABE Space is an analysis using Geographic Information Systems. This research tool was not available due to cost and time constraints . A more in-depth analysis would also ideally include a public consultation aspect and may require a wider range of expertise than is available for a 100-point thesis .. 18.
(26) 2.0 Methodology It is usual at the commencement of a piece of research to locate the problem being addressed within some theoretical framework. The issue this thesis deals with sites clearly within the concerns of planning practice , particularly the implementation stage .. This effectively means that many of the theories of. planning that deal with why planning is required are inappropriate, as they do not provide an adequate explanatory framework. In contrast, theory in planning explores how planning is undertaken . However this can then focus on specific aspects of planning such as collaborative planning , which in simple terms focuses on a process of planning that emphasises public participation and involvement. In contrast this research deals with an aspect of implementation of a determined planning strategy and as such seems to fit with the theory and model of normative planning , as normative theories are concerned with assessing or evaluating the outcomes of a plan or strategy. The normative model defines planning as a series of processes, including issue identification , research , implementation , and monitoring. An issue has been identified that will occur at the implementation stage of Smart Growth , and as such this research is concerned with investigating the means to ensure that one aspect of Smart Growth can be implemented .. As discussed in 1.4 above , the aim of th is research is to identify a possible alternative methodology for determining the provision of reserves within a Smart Growth lead development strategy with specific reference to Tauranga . Addressing this aim requires a number of approaches , which are expanded upon as follows :. 2. 1 Literature Review A literature review will be undertaken to establish the origins and nature of Smart Growth , including the experience in its application in the USA.. The. history and particularly identification of the origins of the techniques for the. 19.
(27) provision of reserves and open space will be explored via the New Zealand literature and any pertinent overseas literature.. The literature review will. contribute most significantly to identifying the background to the issue of reserve provision . It will be supplemented by practice-based literature, which will look at current methods and will generally be accessed via the World Wide Web .. 2. 2 Desktop Study The World Wide Web will be used to search for alternative assessment methods and approaches to reserve acqu isition , particularly those used overseas. Emphasis will be placed on any successful methods that are used as part of Smart Growth . To expand on this, because this is an issue of planning practice, the desktop study will focus on looking for methods that provide examples of good practice . The desktop study will then be used to identify the most appropriate and/or relevant alternative assessment method for the purposes of this research , wh ich leads in to the fieldwork aspect.. 2.3 Fieldwork The fieldwork will act as a test to evaluate existing reserves and possible reserve use in a local context, using the selected alternative assessment method. A particular focus will be on the features of the reserves that are not covered in the traditional quantitative analysis. From this it will be possible to determine the adequacy of current reserve assessment methods in relation to the implementation of Smart Growth in Tauranga , demographic characteristics of the population , and modern leisure activities .. 20.
(28) 2.4 Development and Application of An Appropriate Method The application of one of the methods and assessment of its outcomes will provide the bases for a conclusion and recommendations .. In choosing an. appropriate alternative method , a range of factors will be cons idered . They will include such things as whether specific tools are required to undertake the assessment such as geographic information systems and the appropriateness of this for a 100-point thesis with reference to time and cost constraints , the complexity of the alternative methodology, whether it could be suitably applied at the local level which was preferable , or whether it is more suitably appl ied at the national level.. 2.5 Research Process A detailed outl ine of the process to be followed is as follows :. •. An examination of the history of reserve provision in New Zealand , which forms the basis for current processes for reserve acquisition and decision making processes at territorial authority level , and the extent to which the New Zealand approach is influenced by overseas models ;. •. An explanation of Smart Growth in both the international and New Zealand contexts , including what its goals are and particularly the vision for more intensive styles of development. This section will elaborate on the type of Smart Growth that is to be applied in Tauranga , focusing particularly on the style of RIN development, and the potential contribution of residential design guidelines to open space values within intensively developed areas ;. •. An analysis of the recreational and open space needs of Tauranga in terms of present day demographics, the likely demographic of intensively developed areas , and the implications of national level strategic policy related to sport and recreation;. 21.
(29) •. A description of the legislative structures in place that guide reserve acquisition and payment in New Zealand , for example the Resource Management Act 1991 , the Local Government Act 2002 , and the Reserves Act 1977;. •. An examination and assessment of some of the current overseas approaches to reserve provision , with a particular focus on those that are based on a more diverse range of assessment methods ;. •. From this research it should then be possible to apply an overseas alternative assessment method in New Zealand context as an alternative to the traditional quantitative approach where residential intensification is to be implemented , in order to establish its appropriateness ;. •. Analyse the results of the application of an alternative assessment method in terms its ability to meet the matters raised in the literature review, such as the goals of Smart Growth ;. •. Make recommendations regarding the use of alternative methodologies for providing open spaces in intensified areas , including the ideal type of document that any alternative assessment methods might fit in to , whether statutory/non-statutory strategic document or other;. •. Also to make further recommendations in terms of general alternative methodologies that may be applied in other areas .. For example,. residential intensification has put the spotlight on the problem and this could represent a shift in open space policy on a wider basis.. 22.
(30) 3.0 Smart Growth: A Review of Literature and Sources '. As an outcome of sustainable development and Agenda 21 initiatives during the 1990s, a number of Western countries such as the United States (USA), Britain , Australia and New Zealand began to identify that urban development patterns were inefficient. These inefficiencies arose from land use, transport, and travel times . Smart Growth in USA, Urban Renaissance in Britain and associated residential intensification techniques were initially a response to the effects of urban sprawl.. 3. 1 Smart Growth Theory In the USA, urban expansion in the early 20 1h century occurred alongside the expansion of America 's middle class and its desire to rise above urban , working class conditions (Bressi , 1994 ). The most powerful symbol of the middle class, the single family detached house surrounded by ample open space and division from neighbours , has roots in Victorian-era mythology. The home was seen as an icon of protection for the nuclear family from the industrial city's evils . The middle class' ability to move to suburban single-family homes was facilitated by transportation innovations. Before the 1920s most suburbs grew in conjunction with the extension of streetcars and railroad lines, and suburbs developed with a strong relationship to the distance someone might comfortably walk between home and a streetcar stop .. Following World War I suburban growth was. shaped by automobiles , which opened extensive amounts of land for development. The business of making and sustaining the suburbs boosted the economy. Private vehicle ownership skyrocketed and government responded by building networks of boulevards , parkways and expressways that facilitated dispersing development in an increasingly wide and thin fashion.. The history of land use and development in New Zealand largely represents the origins of British town planning as being a state intervention made essential by the public health concerns of the Victorian city (Miller, 2002). The nature of resettlement in New Zealand through the post war years echoes that of the. 23.
(31) USA, as new and extensive areas of land were made available for development by transport innovations. Another driving force was promotion of the nuclear family and the sanctuary that facilitated this was offered in the rapidly expanding. suburbs.. Government. intervention. through. state. housing. programmes facilitated the nuclear family concept, but also contributed to urban sprawl.. 3.1.1 Sustainable Development Following recommendations in the Brundtland report of the World Commission on. Environment and. Development (WCED). in the. late. 1980s, many. international agencies and governments have adopted the principle of sustainable development (Memon & Perkins , 2000).. This is a strategy. designed to meet the needs of the present without compromising the ability of future generations to meet their own needs (WCED , 1987). The fundamental aims. of. sustainable. development. include. preserving , enhancing ,. and. interrelating economic prosperity, the integrity of natural ecosystems , and social equity (Porter, 2002). Ideally, sustainable development is a dynamic process that enables all people to realise their potential , and to improve their quality of life in ways that simultaneously protect and enhance the earth 's life support systems (Forum for the Future Annual Report, 2000). These broad goals can apply to global and national as well as local development (Porter, 2002). Many sustainable development aims are reflected in Smart Growth principles , and the sustainable development aspects of the movement are often stressed .. As. Talen and Knaap (2003) note when discussing the nature of Smart Growth principles "most of these principles , whether labelled 'growth management', 'smart growth ' or 'sustainable development' are undoubtedly viewed by many planners as simple good planning practice" (Talen & Knaap , 2003, p346). Therefore it is possible to regard Smart Growth and its principles of a popularisation of good practice that are already being used, albeit perhaps not in the same combinations as under Smart Growth.. Porter (2002) states that. Smart Growth is about taking a strategic rather than ad-hoc approach to accommodating and facilitating development. This includes development within existing urban areas, and to a lesser extent within greenfields sites.. In the. 24.
(32) USA, advocates of Smart Growth may promote different aspects of the concept. This can include smart growth as a way of protecting open space and natural resources , or as a mechanism for giving developers the flexibility to mix uses and increase the range of housing choices in their projects . It is important here to distinguish Smart Growth from other approaches to sustainable urban development.. Another approach to the implementation of sustainable. development in cities is a term known as Urban Sustainability. While Smart Growth is essentially about facilitating growth on a more regional or subregional scale , urban sustainability with a greater focus on land use practices to curb growth and amend existing practices to become more sustainable . Smart Growth also recognises that there are strong links between social , economic and environmental aspects , in contrast to urban sustainability that focuses on physical and environmental sustainability. communities. that. are. more. hospitable,. Smart growth calls for building productive ,. and. fiscally. and. environmentally responsible than most of the communities that have developed over the last century.. Smart Growth America defines itself as a nationwide. coal ition promoting a better way to grow; one that protects farmland and open space , revitalises neighbourhoods, keeps housing affordable , and provides more transportation choices .9. Despite the popularity of the Smart Growth movement there is only limited academ ic literature available at this point in time.. The populist and often. political nature of Smart Growth in the USA means that there is a strong concentration on promoting the concept and providing 'toolkits ' to aid its implementation. Examples of this are on the Smart Growth America website and Smart Growth BC which is the Canadian equivalent.. When reviewed. critically, these 'toolkit' documents do little to assist beyond making some process and policy suggestions and directing the reader to more websites . Most of the studies to date are either advocacy of the adoption of Smart Growth (see Baker, 2003) or accounts of its adoption (see Talen & Knaap , 2003 , Daniel , 2001 add Bunce , 2004 ).. The lack of information on how to actually. implement Smart Growth is probably because as Talen et al put forward , Smart. 9. Smart Growth Am erica is a nationwide coal ition responsible for Smart Growth research and guidance .. 25.
(33) Growth exemplifies processes that have been in place for a long time , just in a new combination . Smart Growth is the latest in a range of tools to control urban growth. All of the different urban growth tools such as Smart Growth and Urban Sustainability have been developed in a quite different administrative and political system to the one we have in New Zealand .. 3.1.2 Smart Growth Defined Smart Growth is a term that was developed in the USA during the 1990s and by sustainable development. It arose after concern about loss of quality of life and prosperity, as a result of rapid urban growth and urban sprawl (SmartGrowth Bay of Plenty, 2004 ). In particular there were concerns about:. •. Traffic congestion. •. Loss of open space , farmland , habitat. •. Infrastructure costs. •. Inner city decline.. Porter (2002) describes Smart Growth as :. " .. .development that accommodates growth in smart ways, which is to say in economically viable, environmentally responsible , and collaboratively determined ways.". Smart Growth is a movement focused on promoting urban development that is compact, diverse and walkable as opposed to car-dependent and landconsumptive (Talen , 2003).. It seeks to rebuild existing cities rather than. building more peripheral , single-use housing developments and their associated commercial centres .. Porter (2002) contends that development that is in. accordance with the key principles of Smart Growth should result in welldesigned , multi-use communities that offer people a range of options for living, working, recreation and travel.. These principles can guide development in. greenfields on the edges of urbanised areas as well as infill redevelopment in cities and suburbs (Porter, 2002).. Coincident with this movement, Smart. 26.
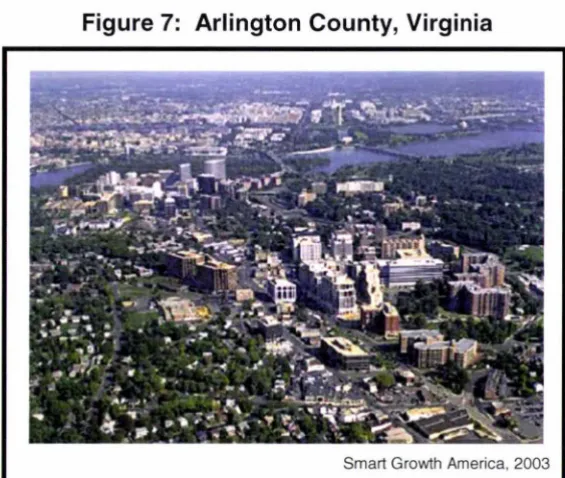
(34) Growth research often seeks to verify the validity of its goals by building predictive models , conducting policy impact achievements and generally trying to explain and/or justify Smart Growth 's achievements and potential or realised effectiveness (Talen, 2003).. Smart Growth has been widely used with varying success in the USA.. The. Environmental Protection Agency awards successful Smart Growth initiatives, with 2002 winners being in Virginia , California , Colorado and Massachusetts. Arlington County's (Virginia) and the Rosslyn-Baisten Metro Corridor won the Overall Excellence in Smart Growth Award.. Arlington 's planning approach. places dense, mixed-use , infill development at five metro stations and tapers it down to residential neighbourhoods. The aerial photograph of Arlington County on page 28 demonstrates the effectiveness of Arlington's approach around the Rosslyn and Court House Stations. It also shows that Smart Growth can result in a wide range of housing types from apartments to townhouses and singlefamily detached homes (Smart Growth , 2003).. 27.
(35) Figure 7: Arlington County, Virginia. Smart Growth America, 2003. In New Zealand , the Smart Growth approach is in its early stages of development and implementation in some cities attempting to deal with sprawling urban growth.. 3.1.3 Smart Growth in New Zealand The New Zealand government recognises that it has a key leadership role of articulating outcomes and directions for New Zealand.. It has developed the. Sustainable Development Programme of Action (2003) , with one of the focus issues being sustainable cities. The sustainable development approach is seen as the most appropriate to help government find solutions that provide the best outcomes for the environment , the economy and New Zealand 's increasingly diverse society.. It is thought that cities are essential places to achieve. sustainable development because most people live there and much economic activity is centred on urban areas. The Local Government Act 2002 provides a new purpose for all local authorities, which is based on sustainability principles. The purpose of local government includes democratically promoting the social, economic, environmental and cultural wellbeing of communities , now and for the future. Central Government is taking the lead in promoting the sustainable development approach in policy and decision-making, and a similar shift has occurred in some regions dealing with high levels of urban growth such as. 28.
(36) central and west Auckland and the western Bay of Plenty sub-region . Central Government and local authorities , which have taken a metropolitan approach to growth management, have been increasingly working together to address issues of concern .. This partnership approach is also part of the new. approaches to sustainable development outlined in Sustainable Development: Programme of Action .. The Auckland Regional Council , in partnership with the region 's territorial authorities , formed the Auckland Regional Growth Forum .. From that the. Auckland City Council developed a Growth Management Strategy and a Liveable Communities Strategy, which aims to allow a higher density of growth with in selected areas of the city. Protecting the city's natural environment is a significant driver of the programme to build a compact city. Growth is to be focused around town centres that can provide services , and densities increased in those centres so that there are sufficient people and activities to support passenger transport (Auckland City Council , 2004 ).. This will result in the. coordination of growth areas with passenger transport and infrastructure putting them close to rail stations and getting bus routes in to town centres to reduce use of the private passenger vehicle . As such it is a strategy that is very close to the Smart Growth approach .. This research is concerned with the implementation of Smart Growth in the western Bay of Plenty sub-region , with a specific focus on implementing residential intensification within Tauranga City Council 's jurisdiction . Many of the principles of Smart Growth can be promoted by attaining efficiencies in development (Porter, 2002). Accommodating growth through infill development and the redevelopment of vacant and under-used properties means less need to expand infrastructure systems and convert rural land to urban land uses.. 29.
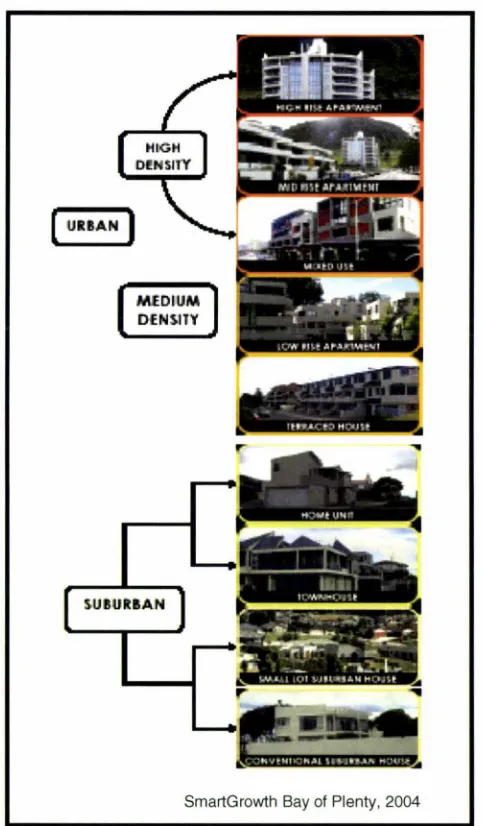
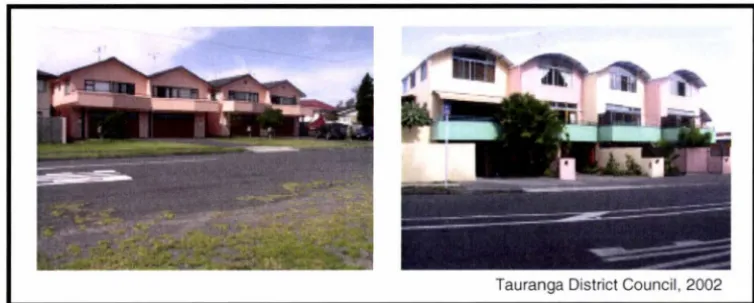
(37) 3.1.4 Residential Intensification Smart growth encourages more growth in urban areas and less growth in nonurban areas because of the advantages of utilising existing infrastructure. This sentiment is central to the implementation of residential intensification . Residential intensification supports the creation of new living accommodation by 'infilling ' within existing neighbourhoods and commun ities (Epp et al, 1996). Intensification nodes are defined areas where a higher density of development is facilitated , normally strategically located near existing urban land uses and connections , most often focusing on housing (Porter, 2002). The technique can be used to revitalise and introduce diversity to 'monofunctional' urban and suburban contexts , and can accommodate a diverse population (Epp et al, 1996).. In line with Smart Growth principles , the intent of residential. intensification is to make suitable use of land and infrastructure, to create a sense of community, to reduce energy demands, to reduce real estate and housing costs , and to reduce development demands on greenfields sites .. In New Zealand , elements of the Smart Growth approach to residential intensification nodes are being researched and implemented , via the Auckland Regional Growth Forum in collaboration with the region 's territorial authorities . Auckland City Council is particularly concerned with absorbing all new residential development within existing urban areas through the Liveable Communities Strategy. Waitakere City Council encourages medium density housing. developments. through. District. Plan. provisions. programmes aimed at upgrading existing urban areas.. and. Council. This form of. development is encouraged on sites near main transport routes , railway stations, public transport routes and existing town centres (Waitakere City Council , 2004 ).. Control over the appearance and. location of these. developments is reserved by the Council via a series of medium-density design guidelines and landscape treatment documents.. Though smaller than the. Auckland Region , the western Bay of Plenty sub-region is faced with similar issues in terms implementing residential intensification in the future , particularly within Tauranga City.. 30.
(38) TCC has a vision for the implementation of SmartGrowth in the city.. It is. envisaged that SmartGrowth will develop an integrated strategy that addresses the range of physical , economic and community factors that face the city. Conceptually the SmartGrowth strategy is to be founded on the principles of sustainable development as referred to earlier, and will develop economic, social and environmental outcomes.. The summarised form SmartGrowth. Action Plan is based on a number of general topic areas , which cover both policy and process.. 1. Implementation Committee : The collaboration of key partners (including the local government authorities involved) will be crucial in terms of the success of implementing SmartGrowth .. This will involve monitoring. milestones and reviewing the strategy as circumstances change over time . 2. Sub-Regional Settlement Pattern: SmartGrowth's planned sub-regional development pattern will be formalised through the Regional Policy Statement.. This. will. provide. a framework. for. the. long-term. implementation of SmartGrowth and it is anticipated that the Regional Policy Statement guidance will provide some level of certainty for the market in terms of land use. 3. lwi and Hapu Management Plans: These will provide a basis for tangata whenua. decisions. regarding. their. protection. and. development. aspirations , which will feed in to the overall strategy by defining cultural constraints to future growth and development. 4. Greenfields Residential : Timing , location and design will have to be carefully planned to ensure that there are no constraints to land supply and local authorities are able to achieve efficiency in service provision . 5. Business Land: The provision of business land will need to be in balance with residential development - according to SmartGrowth , historically the western Bay of Plenty sub-region has not made provision of business land to the extent required. 6. Strategic Roading Network (SRN): There is public commitment to the long-term roading strategy.. SmartGrowth will rely on the continued. implementation of the SRN.. 31.
(39) 7. Public and Active Transportation: SmartGrowth will encourage and facilitate increased use of buses , cycling and walking as viable alternatives to private vehicles within the sub-region.. This will rely to. some extent on the provision of mixed uses within wider residential areas . 8. Wastewater Disposal: A goal of SmartGrowth is to reduce waste , and to encourage a holistic water-cycle approach in greenfields areas. There will. also. be increasing. use of emerging. environmentally sound. technologies. 9. Economic: SmartGrowth and a 'Smart Economy' will maintain an alignment. of. various. linked. actions,. including. business. land. development, Maori development zones and infrastructure. 10. Open Space and Leisure : The 'live, work, and play' concept will be reliant on a high quality provision of open space , arts and leisure opportunities.. SmartGrowth considers this to be a key quality of life. indicator. Open space can also balance urban form. 11. Intensification Management Areas : These areas are proposed for Mt Maunganui. and. the. Tauranga. central. isthmus.. A. vision. and. implementation plan will be developed for urban design , transportation network, open space and recreation . Specific areas for intensification will be defined and the implementation committee will provide draft policies ready for public consultation . Implementation of SmartGrowth intensification management areas within Tauranga City Council's jurisdiction is a key focus of this research, specifically the provision of open spaces within mixed-use 'Residential Intensification Nodes' (RINs).10. The sub-regional development pattern (Figure 6 page 13). shows the intensification management areas in grey, and provides an indicative location for RINs , either 2001-2021 or 2021-2051 . The proposed short term RINs in Mt Maunganui are the Mt Maunganui Residential 'H ' and 'A' zones and Bayfair. 11. Proposed RINs in Tauranga are the Central Business District and. °. 1. For the purposes of this research , 'Open Space' is defined as both active and passive reserve, playgrounds , neighbourhood reserves and streetscape improvements. 11 2 The Mt Maunganui Residential 'H' Zone has a current minimum density of 1 unit per 100m as defined by the Tauranga District Plan. The Residential 'A' Zone covers the residential zoning for the remainder of the suburban residential areas of the city, with a minimum allowable density of 1 unit per 325m 2 . Residential intensification would allow a minimum density of 1 unit per 250m 2 within this part of Mt Maunganui , adjacent to the Mt Maunganui. 32.
(40) Eleventh Avenue . It is assumed that a RIN will involve clustered development around 10 minutes walk from public transport, commercial activities and open space (SmartGrowth, 2004). The density of this type of development is at least one unit per 325m 2 , but typically one unit per 100-250m 2 . Examples are terrace or row housing and low-rise apartments . Figure 8 on page 34 contains visual examples of the different types of housing density, used by the Auckland Regional Growth Forum. Implementation of RINs in different parts of Tauranga will aim to harness the growing demand for a more intensive style of development (Hill Young Cooper, 2002) .. Tauranga has some unique features that set it apart from the intensification occurring in other centres. Tauranga is likely to attract people who wish to live in a smaller unit because of:. •. Retirement: Older adults looking for a smaller unit close to shops and activities. •. It is a holiday centre , providing holiday homes especially for people wishing to holiday near the beach .. The present focus of the intensive housing market is on the retirement and holiday home sector; under SmartGrowth this focus is expected to broaden , though the Strategy does not appear to contain any policies or goals to facilitate this.. Other demographic groups in the community are expected to increase. their interest in RINs as the community increases its acceptance of more intensive styles of development and lifestyles change . A local community's acceptance of a more intensive style of housing is reliant on Council investment in the area to manage the quality of development.. Councils such as TCC have an agreed process for providing reserves and community facilities for public use. The provision of these facilities is relevant where a more intensive style of development exists , particularly because residents who live in these areas may be willing to trade off their private open 'Residential H' Zon e. District Plan changes to the other proposed nodes mentioned would al so allow a minimum density of 1 unit per 250m2 •. 33.
(41) space for other forms of public amenities. Open spaces are also important to offset the built form in areas of relatively intensive development, by providing visual breaks or backdrops and contributing to overall amenity values within RINs.. Figure 8: Illustrations of Residential Development Types in the Western Bay of Plenty. ( UlllAN. I. SmartGrowth Bay of Plenty, 2004. As indicated earlier, community acceptance of more intensive styles of development is dependent to some extent on Council investment in the quality of development.. Under the SmartGrowth proposals high standards of urban. design are to be achieved through detailed local area planning and design policy and guidelines (SmartGrowth , 2004). Design guidelines will be provided as part of District Plan amendments to ensure functional outcomes are. 34.
(42) achieved on the ground.. TCC have yet to develop any residential design. guidelines in association with implementing SmartGrowth . The SmartGrowth Strategy Actions for Intensification Management Areas identify that an emphasis on urban design is important for achieving good quality outcomes , and detailed examination of these issues is required as part of policy development for specific areas (SmartGrowth Bay of Plenty, 2004 ). Identified urban design issues include:. •. Street orientation of buildings. •. Bu ilding design issues. •. Construction issues and sound proofing. •. Land title issues. •. Public domain including street planting. •. Encouraging comprehensive development.. Promotion of urban design , particularly in public spaces , may include the establishment of design guidelines and a guidance panel (SmartGrowth , 2004 ). Additional urban design expertise will be added to TCC partly based on this SmartGrowth. implementation. action. and the Tauranga. District Council. Residential Intensification Draft Policy Paper (2002).. SmartGrowth has recognised the links between urban design of dwellings and the quality of the public realm .. For clarity, one part of the quality of the. environment is what the Council does in the public realm and the other part is the quality of the design of the intensive housing . For example , do they have balconies or any form of private open space, are they constructed of pleasant materials and are there any residents' areas within the site to which the residents alone will have access?. The relationship between quality urban. design and quality design of the public realm are two aspects of a potential trade off for less public open space. TCC has undertaken some investigation in reserve provision in anticipation of implementing RINs and the implication of increased population density within RINs.. 35.
Figure

+7
Related documents
Cest cet aspect que nous allons maintenant analyser a partir de deux mesures de la consommation agregee d'energie, une mesure thermique, soit la fommle (I) et une mesure
But that is Marx’s exact point in discussing the lower phase of communism: “Right can never be higher than the economic structure of society and its cultural development which
19% serve a county. Fourteen per cent of the centers provide service for adjoining states in addition to the states in which they are located; usually these adjoining states have
Хат уу буудай нъ ТгШсит ёигит зүйлд хамаарагддаг нэг настай ихэечлэн зусах хэлбэртэй үет ургамал бөгөөд уураг ихтэй, шилэрхэг үртэй, натур жин их байдгаараа
In addition, results of our exploratory analyses suggest that exposure to specific microbes (e.g., lactobacilli and bifidobacteria) in the maternal vaginal flora may influence
The aim of the study was to assess the presence of pathogenic microbes on treatment tables in one outpatient teaching clinic and determine a simple behavioral model for
It was decided that with the presence of such significant red flag signs that she should undergo advanced imaging, in this case an MRI, that revealed an underlying malignancy, which
This framework incorporates macro (structural & symbolic institutions), meso (group), and micro (individual) levels of analysis, the idea of time and life course analysis, and
