Employment rates in Europe - 2000
in focus
POPULATION AND
SOCIAL CONDITION
THEME 3 - 8/2001
4
Gregor Kyi
—
Hubert Chartier
On its Stockholm summit in March 2001, the European Council set the following
objectives for EU's employment rates :
67 % for women and men together and 57 % for women to be attained by 2005.
50 % by the year 2010 for persons aged 55 to 64 years.
The employment rates derived from the spring 2000 Labour Force Survey are
presented hereafter for the EU Member States (and their regions), as well as for 3
EFTA and 11 candidate countries. The main features are :
•
In average the EU total employment rate was at 63.1 % in 2000 (against 61 % in
1998), while the female employment rate was almost 10 percentage points lower
(at 53.8 % in 2000 against 51.2 % in 1998).
•
Seven EU member states have already attained the 2005 objectives : Denmark,
United Kingdom, Sweden, Finland and the Netherlands (with total rates around
70 % or more and female rates around 65 %), as well as Portugal and Austria (with
total rates at 68 % and female rates at 60 %).
•
Germany has already reached the 2005 objective for female employment but not
for total employment rate (65.3 %).
• In Italy, Greece and Spain the employment rates are as low as around 40 % for
females and 55 % for males and females together.
Contents
Figure 1: Employment rates, by
sex in the EU, spring 2000
1
Table 1: Employment rates, by
age and by sex in the EU, spring
2000
2&3
Table 2: Full time employment
rates by age and sex in the EU,
spring 2000
2&3
Map 1: Employment rates in the
EU, males and females, NUTS2.4
Map 2: Employment rates in the
EU, females, NUTS2
5
Table 3:
Employment rates by
age and sex in the EFTA and
candidate countries, spring 2000
6&7
Figure 2: Employment rates
EU, 15-64 years, spring
2000
m
eurostat
Manuscript completed on: 26/04/2001
ISSN 1024-4352
Catalogue number: KS-NK-01-008-EN-C
© European Communities, 2001
From 1998 to 2000 both the general and female employment rates increased by about
5 percentage points in Spain, Ireland and Finland (and by about 4 points in Belgium).
The employment rate of persons aged 55 to 64 was at 37.5 % in average in the EU in
2000 (increased by one percentage point since 1998); it ranged from less than 30 % in
Belgium, Luxembourg, Italy, France and Austria to more than 50 % in Sweden,
Denmark, Portugal and United Kingdom.
Total employment rates higher than 70 % concentrated in the following EU regions:
Bayern and western Austria, Danmark, south of Sweden and very south of Finland
(Uusimaa), Netherlands (except Groningen), Centro (in Portugal) and most of the
United Kingdom regions.
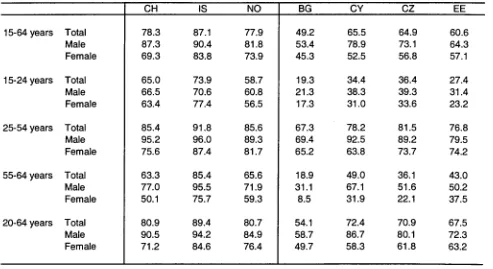
In the candidate countries the total employment rates ranged from 49 % in Bulgaria to
around 65 % in Cyprus, the Czech Republik and Romania; the employment rates were
generally 8 to 12 percentage points lower for females than for males (against 19 points
lower in average in the EU).
%
90
4?
$
[image:1.595.9.582.12.717.2] [image:1.595.234.556.586.790.2]¡♦Male A Female |
Table 1 - Employment rates by age and sex in the EU, spring 2000
15-64 years
15-24 years
25-54 years
55-64 years
20-64 years
Total
Male
Female
Total
Male
Female
Total
Male
Female
Total
Male
Female
Total
Male
Female
EU-15
63.1
72.4
53.8
39.9
43.3
36.5
76.4
87.1
65.7
37.5
47.6
27.7
67.0
77.1
57.0
EUR11
61.3
71.2
51.4
36.9
40.5
33.3
75.5
87.0
64.0
33.9
44.2
24.1
65.4
76.1
54.8
Β
60.9
69.8
51.9
30.3
33.7
26.7
77.9
87.9
67.8
25.0
35.1
15.4
66.3
76.1
56.4
DK
76.4
80.7
72.1
67.1
70.3
64.0
84.3
88.3
80.4
54.6
61.9
46.2
77.9
82.4
73.3
D
65.3
72.7
57.8
46.1
48.6
43.6
79.3
87.4
71.1
37.4
46.2
28.7
68.7
76.5
60.7
EL
55.9
71.3
41.3
26.9
31.9
22.0
70.2
88.6
52.6
39.0
55.3
24.4
61.0
78.2
45.0
E
54.7
69.6
40.3
31.8
37.0
26.4
67.7
85.4
50.6
36.6
54.8
19.9
59.3
75.6
43.5
F
61.7
68.8
54.8
28.3
31.4
25.2
78.4
87.3
69.6
29.3
32.8
26.0
67.4
75.2
60.0
IRL
64.4
75.4
53.2
47.8
52.1
43.3
75.4
88.1
62.7
45.1
63.0
27.1
70.2
82.6
57.8
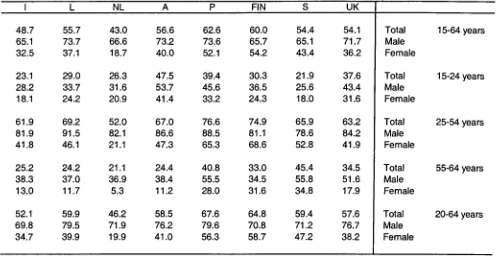
Table 2 - Full time employment rates by age and sex in the EU, spring 2000
15-64 years
15-24 years
25-54 years
55-64 years
20-64 years
Total
Male
Female
Total
Male
Female
Total
Male
Female
Total
Male
Female
Total
Male
Female
EU-15
51.8
67.9
35.7
30.7
36.1
25.3
63.6
83.3
43.9
29.3
43.1
16.1
55.4
72.9
38.1
EUR11
51.0
67.0
35.1
29.8
35.1
24.5
63.4
83.1
43.6
27.4
40.5
14.8
54.6
72.0
37.4
Β
40.8
54.4
27.1
21.8
26.5
16.8
52.6
69.7
35.0
13.5
21.4
6.0
44.5
59.4
29.5
DK
59.9
72.8
46.8
35.5
44.4
27.0
70.6
84.3
56.7
43.2
57.1
27.3
63.8
77.3
50.0
D
52.9
69.5
36.0
40.6
44.4
36.6
63.8
84.3
42.9
28.9
43.1
14.8
55.4
73.2
37.3
EL
53.4
69.6
38.2
24.6
29.6
19.8
67.6
87.0
49.0
37.1
54.1
21.9
58.5
76.5
41.6
E
50.3
67.7
33.4
27.5
34.3
20.5
62.8
83.7
42.6
34.2
53.8
16.2
54.6
73.7
36.2
F
51.4
65.2
37.8
22.0
27.3
16.7
66.0
83.7
48.6
22.8
29.4
16.4
56.2
71.4
41.4
IRL
53.8
70.4
37.0
37.5
43.9
30.9
64.3
84.6
44.1
36.3
57.3
15.2
59.7
78.3
41.1
Statistics in focus
— Theme 3 — 8/2001
[image:2.595.41.576.467.738.2]Table 1 - Employment rates by age and sex in the EU, spring 2000
I
53.4
67.6
39.3
26.1
30.2
22.0
67.7
84.6
50.7
27.3
40.3
15.2
57.1
72.4
42.0
L
62.7
75.0
50.0
31.8
35.3
28.3
78.2
92.8
63.0
27.2
37.9
16.8
67.5
80.8
53.8
NL
72.9
82.1
63.4
68.4
69.9
66.7
81.7
92.2
70.9
37.9
49.9
25.8
74.2
84.2
64.0
A
67.9
76.2
59.7
52.5
56.5
48.6
81.6
89.7
73.5
29.2
41.4
17.8
70.7
79.2
62.2
Ρ
68.1
76.2
60.4
41.9
47.7
36.1
81.9
90.2
73.9
51.7
62.5
42.3
73.6
82.3
65.3
FIN
68.1
71.1
65.2
45.4
47.0
43.8
81.1
84.6
77.6
41.2
41.8
40.7
72.3
75.5
69.0
S
71.1
72.6
69.7
36.9
36.6
37.1
82.5
84.1
80.9
64.3
67.0
61.7
76.3
78.2
74.4
UK
71.2
77.9
64.5
55.9
58.2
53.5
80.4
87.5
73.1
50.5
59.8
41.4
74.1
81.5
66.6
Total
Male
Female
Total
Male
Female
Total
Male
Female
Total
Male
Female
Total
Male
Female
15-64 years
15-24 years
25-54 years
55-64 years
20-64 years
Table 2
-
Full time employment rates by age and sex in the EU, spring 2000
I
48.7
65.1
32.5
L
55.7
73.7
37.1
NL
43.0
66.6
18.7
A
56.6
73.2
40.0
Ρ
62.6
73.6
52.1
FIN
60.0
65.7
54.2
S
54.4
65.1
43.4
UK
54.1
71.7
36.2
Total
Male
Female
15-64 years
23.1
28.2
18.1
61.9
81.9
41.8
25.2
38.3
13.0
52.1
69.8
34.7
29.0
33.7
24.2
69.2
91.5
46.1
24.2
37.0
11.7
59.9
79.5
39.9
26.3
31.6
20.9
52.0
82.1
21.1
21.1
36.9
5.3
46.2
71.9
19.9
47.5
53.7
41.4
67.0
86.6
47.3
24.4
38.4
11.2
58.5
76.2
41.0
39.4
45.6
33.2
76.6
88.5
65.3
40.8
55.5
28.0
67.6
79.6
56.3
30.3
36.5
24.3
74.9
81.1
68.6
33.0
34.5
31.6
64.8
70.8
58.7
21.9
25.6
18.0
65.9
78.6
52.8
45.4
55.8
34.8
59.4
71.2
47.2
37.6
43.4
31.6
63.2
84.2
41.9
34.5
51.6
17.9
57.6
76.7
38.2
Total
Male
Female
Total
Male
Female
Total
Male
Female
Total
Male
Female
15-24 years
25-54 years
55-64 years
20-64 years
[image:3.595.60.562.457.716.2]Table 3 - Employment rates by age and sex in the EFTA and candidate countries, spring 2000
15-64 years
15-24 years
25-54 years
55-64 years
20-64 years
Total
Male
Female
Total
Male
Female
Total
Male
Female
Total
Male
Female
Total
Male
Female
CH
78.3
87.3
69.3
65.0
66.5
63.4
85.4
95.2
75.6
63.3
77.0
50.1
80.9
90.5
71.2
IS
87.1
90.4
83.8
73.9
70.6
77.4
91.8
96.0
87.4
85.4
95.5
75.7
89.4
94.2
84.6
NO
77.9
81.8
73.9
58.7
60.8
56.5
85.6
89.3
81.7
65.6
71.9
59.3
80.7
84.9
76.4
BG
49.2
53.4
45.3
19.3
21.3
17.3
67.3
69.4
65.2
18.9
31.1
8.5
54.1
58.7
49.7
CY
65.5
78.9
52.5
34.4
38.3
31.0
78.2
92.5
63.8
49.0
67.1
31.9
72.4
86.7
58.3
CZ
64.9
73.1
56.8
36.4
39.3
33.6
81.5
89.2
73.7
36.1
51.6
22.1
70.9
80.1
61.8
EE
60.6
64.3
57.1
27.4
31.4
23.2
76.8
79.5
74.2
43.0
50.2
37.5
67.5
72.3
63.2
%
80.0
75.0
70.0
65.0
60.0
55.0
50.0
î t
1
1
i
I
t *
"
M
A
î
1
t
♦
î
I
i l
i
1
1
1
1
1
1
1
1
1
1
1
1
1
1
• S ^ O ^ O « ! ' « ' « ^ '
^ ~ ^
-
- ¿ 5
-
a
* £
s' r
« ^
<ϋ ^r
2000
[image:6.595.70.515.399.679.2]1998
Figure 2: Employment rates in the EU, 15-64 years, spring 1998-2000
Statistics in focus
— Theme 3 — 8/2001
Table 3 - Employment rates by age and sex in the EFTA and candidate countries, spring 2000
HU
55.9
62.7
49.4
33.1
37.0
29.2
72.8
79.0
66.7
21.9
33.0
13.0
60.9
68.6
53.6
LT
60.1
61.8
58.5
26.7
30.2
23.2
76.0
75.1
76.8
42.2
52.2
34.5
66.6
68.6
64.7
LV
58.2
62.3
54.3
30.4
35.2
25.6
74.2
75.4
73.0
35.4
48.3
25.9
64.2
69.0
59.9
PL
55.1
61.2
49.3
24.1
26.4
21.9
71.0
77.5
64.5
29.0
37.4
21.8
61.1
67.9
54.5
RO
64.2
69.5
59.0
34.0
36.9
31.1
78.6
84.6
72.7
52.0
57.4
47.3
70.5
76.4
64.8
SI
62.7
66.7
58.5
31.2
34.7
27.4
82.6
85.5
79.6
22.3
31.0
14.3
68.5
72.9
64.1
SK
56.3
61.6
51.1
28.3
28.7
27.9
74.2
79.1
69.3
21.5
35.2
10.2
63.0
69.3
56.9
Total
Male
Female
Total
Male
Female
Total
Male
Female
Total
Male
Female
Total
Male
Female
15-64 years
15-24 years
25-54 years
55-64 years
20-64 years
> ESSENTIAL INFORMATION - METHODOLOGICAL NOTES
ÍÍ * O '.? ® f.
ΐ β ·5
Definition
a s e » ί> s « 9
» « • • · Ι · Ι · « « « » * Ι ( β « * ί «
ii
* * * Si «ι S * S 8 »
í
<9 β
The employment rate is the population of employed persons as a share of the total population of the same age living in private households.
Employed persons are those who during the reference week performed work, even for just one hour per week, for pay, profit or family gain
or were not at work but had a job from which they were temporarily absent.
The full-time employment rate is the population of employed persons working full-time as the share of the total population of the same age
group
The classification by part-time or full-time employment depends on a self-assessment in all Member states except the Netherlands and
Austria. When people are asked whether their job is a part-time job, they compare the number of hours in their job to the normal hours
worked in similar jobs, i.e., in a similar economic activity and occupation. In the Netherlands and Austria the classification depends on a
threshold in relationship with the number of hours usually worked.
Data sources
The data source of the employment rates is the Community labour force survey. The scope of the survey is limited to private households.
Conscripts and persons living in collective households, e.g., medical care institutions and religious institutions are excluded. The sample rate
varies between 0.3% and 3.3% (5% in L).
The data refer to Spring and more precisely,
- in Β (since '99), DK, EL, E, NL (in 2000), Ρ and FIN (in 2000) to the 13 weeks in the second quarter
- in IRL (since '98) and UK in the Spring quarter,
-
in D, I and L to one week in April or May,
-
in F to one month in the first quarter,
-
in A to March,
-
in FIN until '99 to one week in April, May and June,
-
in S to one or three months in the period from February to May
EU aggregates on the basis of a continuous labour force survey can not be calculated because the survey is not yet continuous in all
Member states.
Regional classification
A regional breakdown is applied at the NUTS 2 level (208 regions).
=0
eurostat
Further information:
>
Databases
New Cronos, Domain LFS
To obtain information or to order publications, databases and special sets of data, please contact the
Data Shop
network:
B E L G I Q U E / B E L G I Ë D A N M A R K D E U T S C H L A N D E S P A N A F R A N C E I T A L I A - R o m a Eurostat Dsla Shop
Bnixelles/Bnissel Planistat Belgique Rue du Commerce 124 Handelsstaal 124
B-1000 BRUXELLES/ B R U S S a
Tel. (32-2) 234 67 50
Fax (32-2) 234 67 51 E-mail: datashop θ p l a m l a l ha
DANMARKS STATISTIK Bibliotek og Information Eurostat Data Shop Sejrogade 11 DK-2100 KØBENHAVN O Til. (45) 39 17 30 30 Fax ( 4 5 ) 3 9 1 7 3 0 0 3 E-mail: bb@dst.dk
STATISTISCHES BUNDESAMT Eurostat Data Shop Berlin Otto-Braun-StraBe 70-72 (Eingang: Karl-Marx-Allee) D-10178 BERLIN Tel. (49)1888644 94 27/28 Fax (49) 1888-544 94 30 E-Mail: datashop ©statistik -bund.de
INE Eurostat Data Shop Paseo de la Castellana, 183 Oficina 009
Entrada por Estébanez Calderón E-28046 MADRID Tel. (34) 91 583 91 67 Fax (34) 91 579 71 20 E-mail: datashop.eurostat@ine.es
INSEE Info Service Eurostat Data Shop 195, me de Bercy Tour Gamma A F-75582 PARIS CEDEX 12 Tél. (33) 153 17 88 44 Fax (33) 153 17 88 22 E-mail: datashop@insee.fr I T A L I A - M i l a n o L U X E M B O U R G N E D E R L A N D N O R G E P O R T U G A L ISTAT
Ufficio Regionale per la Lombardia Eurostat Data Shop
Via Reno 3 1-20123 MILANO Tel. (39) 02 80 61 32 460 Fax (39) 02 80 61 32 304 E-mail: mileuro@tin.rl
S U O M I / F I N L A N D
Eurostat Data Shop Luxembourg BP453
L-2014 LUXEMBOURG 4. rue Alphonse Weicker L-2721 LUXEMBOURG Tel.(352)4335-2251 Fax (352) 43 35-22221 E-mail: ds!ux@eurostat.dalashop.lu
STATISTICS NETHERLANDS Eurostat Data Shop-Voorburg Postbus 4000
2270 JM VOORBURG Nederland Tel. (31-70)337 49 00 Fax (31-70) 337 59 84 E-mail: datashop@cbs.nl
Statistic s Norway Library and Information Centre Eurostat Data Shop Kongens gale 6 Boks 8131 Dep. N-0033OSLO
Tel. ( 4 7 ) 2 1 0 9 4642/43 Fa» (47) 21 09 45 04 E-mail: Datashcp©ssfcLno
Eurostat Data Shop Lisboa IN E/Serviço de Difusão Av. Ante™ José de Almeida. 2 P-10O0-O43 LISBOA Tel.(351)21842 6100 Fax (351) 21 842 63 64 E-mail: data.shop@ine.pt
ISTAT
Centro di Informazione Statìstica Sede di Roma, Eurostat Data Shop Via Cesare Balbo, 11a 1-00184 ROMA Tel. (39) 06 46 73 31 02/06 Fax (39) 06 46 73 31 01/07 E-mail: dipcliff@istat.it
S C H W E I 2 / S U I S S B S V I 2 Z E R Ã " Statistisches Amt des Kantons Zurich, Eurostat Data Shop Bleicherweg 5
CH-8090 Zürich Tel. (41-1) 22512 12 Fax (41-1) 225 12 99 E-mail: dalashop θ slalislik.zh.ch Internel: http://www.zh.ch/stanstik S V E R I G E U N I T E D K I N G D O M U N I T E D K I N G D O M U N I T E D S T A T E S O F A M E R I C A
STATISTICS FINLAND Eurostat Data Shop Helsinki
TllastoUijasti)
P L 2 B
FIN-00022 Tilastokeskus Tyôpaj&katu 13 B, ¿Kerros, Helsinki P. (358-9) 17 34 22 21 F. (358-9) 17 34 22 79 Sähköposti:
dalashop tilastokeskusÖIJaslokeskus lì Internet
httpy/wwí.tita5tokeskus.li*10Vdalashophlml
STATISTICS SWEDEN
I n f o r m a t i o n s e r v i c e
Eurostat Data Shop Karlavägen 100 - Box 24 300 S-104 51 STOCKHOLM Tfn (46-8) 50 69 48 01 Fax (46-8) 50 69 48 99 Ε-post: ¡nbservice8scb.se lnternet:http^/www.scb.se/info/datasho p/eudatashop.asp
Eurostat Data Shop Enquiries & advice and publications
Office for National Statistics Customers 8. Electron« Services Unit 1 Drummond Gale - B1/05 LONDON SW1V2QQ United Kingdom
Tel. (44-20) 75 33 56 76 F a i (44-1633) 8 t 27 62 E-mail: eurostal.dalashopëons gov uV
Eurostat Data Shop Electronic Data Extractions, Enquiries & advice - R.CADE 1L Mountjoy Research Centre University of Durham DURHAM DH13SW United Kingdom
Tel: (44-191) 374 73 50 Fax (44-191) 384 49 71 E-mail: '. c a c e i S o V a c u k Internet hritpj'.VrtWMcade dur.ac.uk
HAVER ANALYTICS Eurostat Data Shop 60 East 42nd Streel Suite 3310 NEW YORK. NY 10165 USA
Tel. (1-212) 986 93 00 Fax (1-212)986 69 81 E-mail: eurodala@haver.com
Media Support Eurostat (for professional journalists only):
Bech Building Office A3/48 · L-2920 Luxembourg ■ Tel. (352) 4301 33408 · Fax (352) 4301 32649 · e-mail: eurostal-mediasupport@cec.eu.inl
F o r i n f o r m a t i o n o n m e t h o d o l o g y
Gregor Kyi, Eurostat/E1, L-2920 Luxembourg, Tel. (352) 4301 34533, Fax (352) 4301 34415, E-mail: gregor.kyi@cec.eu.int
Contribution from Sylvain Jouhette, Eurostat/E1, L-2920 Luxembourg, Tel. (352) 4301 34290, E-mail: sylvain.jouhette@cec.eu.int
ORIGINAL: English
Please visit our web sile at www.europa.eu.int/comm/eurostat/ for further information!
A list of worldwide sales outlets is available at the Office for Official Publications of the European Communities.
2 rue Mercier - L-2985 Luxembourg BELGIQUE/BELGIË - DANMARK - DEUTSCHLAND - GREECE/ELLADA - ESPAÑA - FRANCE - IRELAND - ITALIA - LUXEMBOURG - NEDERLAND - ÖSTERREICH Tel. (352) 2929 42118 Fax (352) 2929 42709 PORTUGAL - SUOMI/FINLAND - SVERIGE - UNITED KINGDOM - ¡SLAND - NORGE - SCHWEIZ/SUISSE/SVIZZERA - BALGARIJA - CESKÁ REPUBUKA - CYPRUS Internet Address http://eur-op.eu.int/Wgeneral/s-ad.htm EESTI - H RVATSKA - MAGYARORSZÂG - MALTA - POLSKA - ROMANIA - RUSSIA - SLOVAKIA - SLOVENIA - TÛRKIYE - AUSTRALIA - CANADA - EGYPT - INDIA e-mail: info.info@cec.eu.int ISRAEL - JAPAN - MALAYSIA - PHILIPPINES - SOUTH KOREA- THAILAND - UNITED STATES OF AMERICA