Statistics
in focus
AGRICULTURE AND
FISHERIES
24/2007
Agriculture
Authors
György BENOIST
Pol MARQUER
[image:1.595.4.198.2.488.2]C o n t e n t s
Table 1 – Labour force by size
of the farms………3
Table 2 – Agricultural holdings
by size……….4
Table 3 – Land use by size of
the farms………5
[image:1.595.216.569.474.707.2]Table 4 – Livestock by size of
the farms………6
Table 5 – Subsistence farming.7
Fa r m s t r u c t u r e i n Sp a i n – 2 0 0 5
Every fifth holding is specialised in olive
production
This Statistics in Focus is part of a series of country-specific publications on
the results of the Farm Structure Survey (FSS) 2005. It provides a brief but
nevertheless comprehensive insight into the farm structure in Spain. A similar
publication was issued in March 2005 presenting the results of the FSS 2003
in Spain.
* * *
At the end of 2005 in Spain, about 959 thousand* agricultural holdings had
an economic size of at least 1 European Size Unit (ESU).
- These holdings employed 949.2 thousand AWUs (annual work units), the
equivalent of 949.2 thousand persons working full time;
- they made use of about 23.7 million ha of agricultural area, which is on
average 24.8 ha per holding (compared to 23.2 ha in 2003).
Among these 959 thousand agricultural holdings
- 62% made use of less than one AWU, while 11% made use of 2 or more
AWUs;
- 49% used less than 5 ha agricultural area, while 5% used 100 ha or more;
- 20% were holdings of the type specialist olives, 18% specialist fruit and
citrus fruit, 12% specialist cereals, oil seed and protein crops, 8%
specialist vineyard and 7% were engaged in mixed cropping;
- 77% of their agricultural area was situated in less favoured or mountain
areas;
- 2% were organic farms;
- 6% benefited from direct investment aid.
Among the 912 thousand
sole holders
- 28% were women;
- 58% were aged 55 or more, and only 6% were younger than 35 years;
- 27% had another gainful activity as their major occupation.
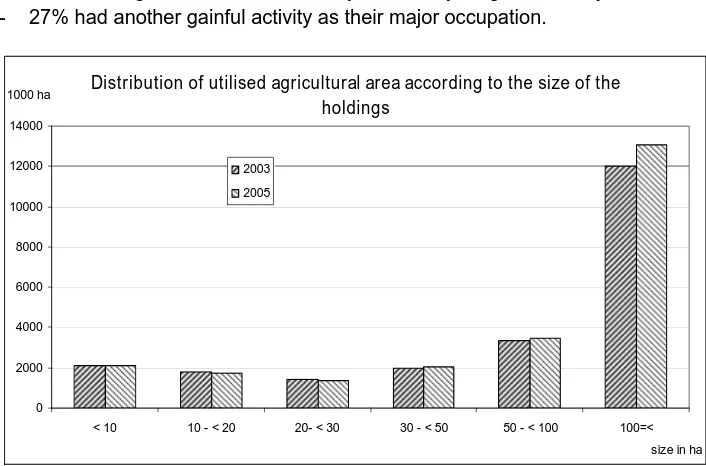
Distribution of utilised agricultural area according to the size of the
holdings
0 2000 4000 6000 8000 10000 12000 14000
< 10 10 - < 20 20- < 30 30 - < 50 50 - < 100 100=< size in ha 1000 ha
2003 2005
(
#
Manuscript completed on: 22.02.2007 Data extracted on: 16.01.2007 ISSN 1977-0316
Catalogue number: KS-SF-07-024-EN-N © European Communities, 2007
Spain 2005 – Holdings of at least 1 ESU
Non Family labour force 339940 AWUs
Agricultural labour force
Family labour force 1796390 persons of which 33% women
609290 AWUs
Working full time 208250 persons
Working part time 630120 persons
Not working on farm 73450 persons
Working full time 30560 persons
Working part time 509260 persons
Working full time 123450 persons
Working part time 71380 persons Working full time
37640 persons
Working part time 307110 persons
Other family members 539820 persons of which 25% women 114930 AWUs
… regular
194830 persons of which 16% women 156020 AWUs
Holders
911820 persons of which 28% women 384290 AWUs
Spouses of the sole holders 344740 persons of which 59% women 110070 AWUs
… non regular 183920 AWUs
60
1000 persons
>= 65
55 - 64
45 - 54
35 - 44
< 35
1000 persons
men women
Family labour force
Age (years)
120 60
180 240
300 120 180 240
holders spouses other family members
Tractor use by utilised agricultural area categories
0% 20% 40% 60% 80% 100%
< 5 5 - < 20 20 - < 50 >= 50 ha
no tracto r
no t-o wned
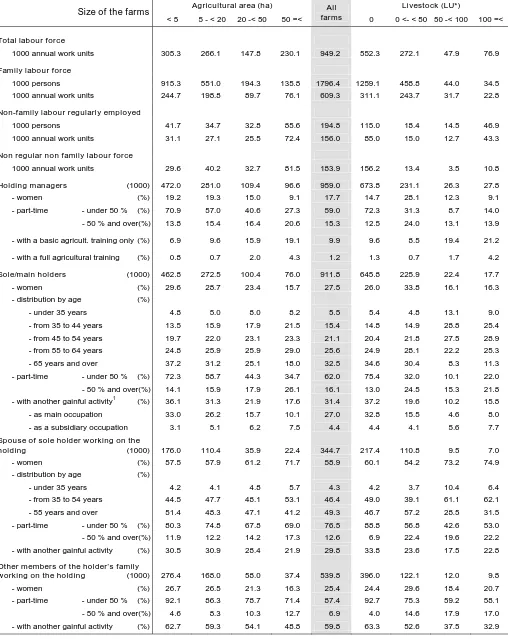
———————————————————————— 24/2007 — Agriculture and fisheries — St a t i s t i c s i n f o c u s 3
#"
Spain – 2005
Table 1 – Labour force by size of the farms
Agricultural area (ha) Livestock (LU*)
Size of the farms
< 5 5 - < 20 20 -< 50 50 =<
All
farms 0 0 <- < 50 50 -< 100 100 =<
Total labour force
1000 annual work units 305.3 266.1 147.8 230.1 949.2 552.3 272.1 47.9 76.9
Family labour force
1000 persons 915.3 551.0 194.3 135.8 1796.4 1259.1 458.8 44.0 34.5
1000 annual work units 244.7 198.8 89.7 76.1 609.3 311.1 243.7 31.7 22.8
Non-family labour regularly employed
1000 persons 41.7 34.7 32.8 85.6 194.8 115.0 18.4 14.5 46.9
1000 annual work units 31.1 27.1 25.5 72.4 156.0 85.0 15.0 12.7 43.3
Non regular non family labour force
1000 annual work units 29.6 40.2 32.7 81.5 183.9 156.2 13.4 3.5 10.8
Holding managers (1000) 472.0 281.0 109.4 96.6 959.0 673.8 231.1 26.3 27.8
- women (%) 19.2 19.3 15.0 9.1 17.7 14.7 28.1 12.3 9.1
- part-time - under 50 % (%) 70.9 57.0 40.6 27.3 59.0 72.3 31.3 8.7 14.0
- 50 % and over(%) 13.8 15.4 16.4 20.6 15.3 12.5 24.0 13.1 13.9
- with a basic agricult. training only (%) 6.9 9.6 15.9 19.1 9.9 9.6 8.5 19.4 21.2
- with a full agricultural training (%) 0.8 0.7 2.0 4.3 1.2 1.3 0.7 1.7 4.2
Sole/main holders (1000) 462.8 272.5 100.4 76.0 911.8 645.8 225.9 22.4 17.7
- women (%) 29.6 28.7 23.4 15.7 27.5 26.0 33.8 16.1 16.3
- distribution by age (%)
- under 35 years 4.8 5.0 8.0 8.2 5.5 5.4 4.8 13.1 9.0
- from 35 to 44 years 13.5 15.9 17.9 21.5 15.4 14.8 14.9 28.8 25.4
- from 45 to 54 years 19.7 22.0 23.1 23.3 21.1 20.4 21.8 27.5 28.9
- from 55 to 64 years 24.8 25.9 25.9 29.0 25.6 24.9 28.1 22.2 25.3
- 65 years and over 37.2 31.2 25.1 18.0 32.5 34.6 30.4 8.3 11.3
- part-time - under 50 % (%) 72.3 58.7 44.3 34.7 62.0 75.4 32.0 10.1 22.0
- 50 % and over(%) 14.1 15.9 17.9 26.1 16.1 13.0 24.5 15.3 21.8
- with another gainful activity1 (%) 36.1 31.3 21.9 17.6 31.4 37.2 19.6 10.2 15.8
- as main occupation 33.0 26.2 15.7 10.1 27.0 32.8 15.5 4.6 8.0
- as a subsidiary occupation 3.1 5.1 6.2 7.5 4.4 4.4 4.1 5.6 7.7
Spouse of sole holder working on the
holding (1000) 176.0 110.4 35.9 22.4 344.7 217.4 110.8 9.5 7.0
- women (%) 57.5 57.9 61.2 71.7 58.9 60.1 54.2 73.2 74.9
- distribution by age (%)
- under 35 years 4.2 4.1 4.8 5.7 4.3 4.2 3.7 10.4 6.4
- from 35 to 54 years 44.5 47.7 48.1 53.1 46.4 49.0 39.1 61.1 62.1
- 55 years and over 51.4 48.3 47.1 41.2 49.3 46.7 57.2 28.5 31.5
- part-time - under 50 % (%) 80.3 74.8 67.8 69.0 76.5 88.8 56.8 42.6 53.0
- 50 % and over(%) 11.9 12.2 14.2 17.3 12.6 6.9 22.4 19.6 22.2
- with another gainful activity (%) 30.5 30.9 28.4 21.9 29.8 33.8 23.6 17.5 22.8
Other members of the holder’s family
working on the holding (1000) 276.4 168.0 58.0 37.4 539.8 396.0 122.1 12.0 9.8
- women (%) 26.7 26.5 21.3 16.3 25.4 24.4 29.6 18.4 20.7
- part-time - under 50 % (%) 92.1 86.3 78.7 71.4 87.4 92.7 75.3 59.2 58.1
- 50 % and over(%) 4.6 8.3 10.3 12.7 6.9 4.0 14.6 17.9 17.0
- with another gainful activity (%) 62.7 59.3 54.1 48.8 59.8 63.3 52.6 37.5 32.9
Symbols : not available 0 less than half of the unit or nil * LU = Livestock Unit
1
[image:3.595.45.553.102.741.2]4 St a t i s t i c s i n f o c u s — Agriculture and fisheries — 24/2007 —————————————————————————
#
Spain – 2005
Table 2 – Agricultural holdings by size
Agricultural area (ha) Livestock (LU)
Size of the farms
< 5 5 - < 20 20 -< 50 50 =<
All
farms 0 0 <- < 50 50 -<100 100 =<
Holdings
- total number (1000) 472.0 281.0 109.4 96.6 959.0 673.8 231.1 26.3 27.8
- by legal personality of the holder (%)
- sole holder 98.1 97.0 91.8 78.7 95.1 95.8 97.7 85.5 63.7
- legal person 1.9 3.0 8.2 21.3 4.9 4.2 2.3 14.5 36.3
- group holders 0.0 0.0 0.0 0.0 0.0 0.0 0.0 0.0 0.0
- by employed labour force (%)
- under 1 AWU 75.5 60.3 39.8 26.8 62.0 74.7 37.7 8.3 8.7
- from 1 to less than 2 AWU 18.8 28.7 40.9 42.6 26.6 18.1 46.7 55.4 39.7
- from 2 to less than 3 AWU 4.3 8.3 13.3 14.9 7.6 4.1 13.5 26.7 25.3
- 3 AWU and over 1.4 2.7 6.0 15.6 3.7 3.2 2.1 9.6 26.3
- by economic size (%)
- from 1 to less than 8 ESU 78.0 45.9 19.6 2.8 54.4 57.4 58.1 0.6 0.3
- from 8 to less than 16 ESU 12.7 25.1 25.9 9.6 17.5 18.6 17.7 7.0 0.4
- from 16 to less than 40 ESU 6.5 22.7 30.1 36.6 17.0 15.7 18.9 39.1 10.9
- from 40 to less than 100 ESU 2.0 5.1 20.0 31.9 8.0 6.2 4.7 49.0 39.9
- 100 ESU and over 0.9 1.2 4.3 19.2 3.2 2.1 0.7 4.3 48.5
- by farm type (%)
- specialist olives 25.3 20.1 10.7 5.4 20.1 26.8 5.2 0.2 0.3
- specialist fruit and citrus fruit 29.1 10.9 5.0 2.0 18.3 24.0 6.1 0.1 0.1
- specialist cereals, oil seed and protein
crops 2.7 12.8 25.6 36.5 11.7 14.0 7.5 1.5 0.6
- specialist vineyard 7.1 12.0 7.5 2.4 8.1 10.6 2.7 0.0 0.0
- mixed cropping 5.3 6.5 9.4 10.0 6.6 6.0 9.5 1.1 1.2
- other types of farming 30.4 37.7 41.8 43.8 35.2 18.6 69.1 97.0 97.8
- by farming methods (%)
- organic farming 0.9 1.4 2.3 3.7 1.5 1.6 1.2 2.1 2.4
- irrigating 51.0 43.5 45.7 44.6 47.6 51.6 39.9 27.6 31.5
- with fixed irrigation equipment 56.0 47.0 44.9 40.3 50.5 53.4 45.7 32.6 37.1
- with crops under glass 5.7 1.6 0.8 0.4 3.4 3.9 2.4 0.5 0.4
- benefiting of direct investment aids 2.7 5.7 10.8 14.8 5.7 3.3 8.4 25.9 22.8
- using a tractor (%) 70.5 90.4 95.0 94.6 81.6 81.3 80.5 86.6 91.0
- with their own tractor 32.2 65.6 81.5 84.4 52.9 47.3 63.1 75.6 80.6
- using a combine harvester (%) 5.7 25.2 51.5 64.3 22.6 21.7 22.4 32.6 35.0
- with another gainful activity than agricultural
production (%) 2.2 3.5 4.7 6.0 3.3 2.6 4.8 5.6 5.5
- tourism 0.1 0.6 0.7 1.1 0.4 0.3 0.6 0.9 1.2
- handicraft 0.0 0.0 0.1 0.0 0.0 0.0 0.0 0.1 0.1
- processing of farm products 1.5 1.4 1.6 1.3 1.5 0.9 3.1 2.5 1.6
- wood processing 0.0 0.0 0.0 0.1 0.0 0.0 0.0 0.0 0.1
- aquaculture 0.0 0.0 0.0 0.1 0.0 0.0 0.0 0.0 0.0
- renewable energy production 0.0 0.0 0.0 0.2 0.0 0.0 0.0 0.1 0.3
- contractual work 0.0 0.2 0.9 1.8 0.4 0.3 0.5 1.2 0.9
- other gainful activities n.a.e. 0.5 1.4 1.6 1.8 1.0 1.2 0.6 1.0 1.7
[image:4.595.56.549.99.746.2]———————————————————————— 24/2007 — Agriculture and fisheries — St a t i s t i c s i n f o c u s 5
#"
Spain – 2005
Table 3 – Land use by size of the farms
Agricultural area (ha) Livestock (LU)
Size of the farm
< 5 5 - < 20 20 -< 50 50 =< All farms 0 0 <- < 50 50 -<100 100 =<
Area (1000 ha)
Total area of agricultural holdings 1577.2 3648.6 4057.3 21117.7 30400.7 18311.8 5166.6 2204.9 4717.5
Other area 586.3 794.1 668.5 4610.8 6659.7 4399.5 992.4 365.6 902.2
Wooded area 260.0 427.4 381.2 2800.1 3868.7 2497.5 554.0 218.0 599.2
Agricultural area 990.9 2854.4 3388.7 16506.9 23741.0 13912.4 4174.2 1839.3 3815.2
Arable land 198.9 968.1 1839.4 8849.0 11855.4 7790.0 2091.0 734.2 1240.2
Cereals 77.3 543.6 1150.2 5338.7 7109.8 4714.0 1258.6 412.1 725.2
Common wheat and spelt 10.6 94.4 226.7 1012.7 1344.5 873.1 282.9 70.9 117.5
Durum wheat 8.2 64.3 110.0 745.0 927.5 657.2 120.5 48.4 101.5
Rye 1.5 6.2 15.1 98.4 121.2 43.2 35.5 18.3 24.2
Barley 21.0 229.8 560.7 2604.6 3416.0 2446.9 550.7 156.3 262.2
Oats 6.8 46.2 91.8 537.7 682.4 295.9 150.4 85.7 150.3
Grain maize 22.4 72.7 109.3 234.7 439.1 267.2 97.5 26.0 48.4
Dried pulses 7.2 42.1 52.2 390.6 492.0 326.7 91.4 27.9 46.0
Root crops 10.8 22.1 37.3 104.0 174.2 123.4 37.6 5.6 7.6
Potatoes 9.9 10.9 13.2 23.4 57.3 35.0 19.7 1.1 1.4
Sugar beet 0.4 10.1 23.5 77.7 111.7 86.0 16.5 3.2 6.0
Fodder root 0.5 1.1 0.7 2.9 5.2 2.3 1.3 1.3 0.3
Industrial crops 7.5 65.9 104.7 490.4 668.5 533.7 82.7 18.5 33.6
Tobacco 1.5 4.9 2.1 4.4 12.9 9.1 3.2 0.3 0.3
Hops 0.2 0.0 0.0 0.0 0.2 0.2 0.0 0.0 0.0
Cotton 2.3 21.2 14.6 45.7 83.8 72.9 4.7 1.3 4.9
Rape and turnip 0.0 0.1 1.5 4.3 5.9 4.5 0.5 0.1 0.8
Sunflower 2.5 38.3 84.0 400.9 525.7 416.7 68.4 15.0 25.6
Soya 0.0 0.0 0.2 1.2 1.4 1.0 0.1 0.0 0.3
Fresh vegetables, melons, strawberry 56.6 57.5 43.7 125.2 283.0 240.7 27.4 5.0 9.9
outside 30.0 47.8 40.5 118.6 236.8 199.1 23.6 4.5 9.7
under glass 26.6 9.7 3.2 6.5 46.1 41.6 3.8 0.5 0.2
Flower and ornamental plants 2.6 1.7 1.0 0.9 6.1 5.4 0.5 0.0 0.2
outside 1.0 1.2 0.8 0.7 3.7 3.4 0.2 0.0 0.2
under glass 1.5 0.5 0.2 0.2 2.4 2.0 0.4 0.0 0.0
Forage plants 18.2 97.8 142.5 384.7 643.2 212.9 177.0 112.9 140.5
Fallow land 18.6 137.2 307.7 2013.3 2476.8 1631.7 415.8 152.3 277.0
Kitchen garden 1.7 1.4 0.5 0.3 3.9 1.5 2.2 0.1 0.1
Permanent pasture and meadows 112.2 589.8 667.5 6293.9 7663.4 2440.6 1707.5 1049.6 2465.7
Permanent crops 678.2 1295.1 881.4 1363.7 4218.3 3680.2 373.6 55.3 109.2
Fruit and berry plantation 147.3 295.7 165.8 195.3 804.2 656.7 109.2 14.2 24.1
Citrus plantation 110.0 72.3 35.3 64.6 282.3 263.0 14.6 0.8 3.9
Olive trees 329.2 596.1 420.7 759.2 2105.2 1823.6 183.4 31.6 66.7
Vineyard 88.9 327.9 257.2 339.4 1013.4 926.7 64.7 8.7 13.3
Ratios
Agricultural area per holding (ha) 2.1 10.2 31.0 171.0 24.8 20.6 18.1 70.0 137.1
Agricultural area… (%)
… own farmed 92.1 82.3 67.8 63.2 67.4 72.3 59.9 52.0 64.9
… in less favoured or mountain area 60.6 71.8 75.2 79.8 77.4 74.0 82.2 84.3 81.1
… organic farmed 0.8 1.1 1.4 1.5 1.4 1.2 1.3 1.4 2.1
… irrigated 32.6 22.1 19.4 10.5 14.1 18.9 8.9 6.1 6.1
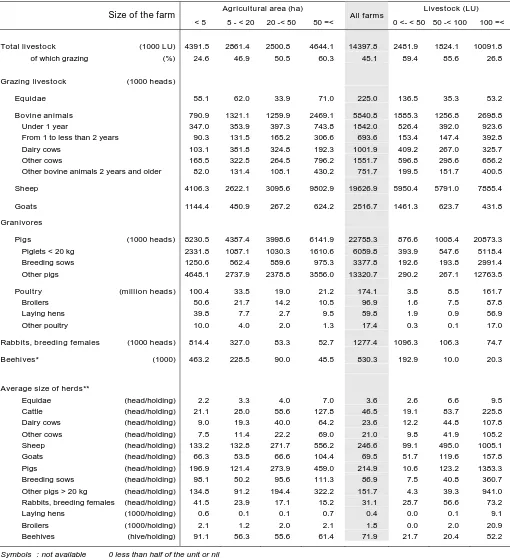
[image:5.595.50.552.100.737.2]6 St a t i s t i c s i n f o c u s — Agriculture and fisheries — 24/2007 —————————————————————————
#
Spain – 2005
Table 4 – Livestock by size of the farms
Agricultural area (ha) Livestock (LU)
Size of the farm
< 5 5 - < 20 20 -< 50 50 =< All farms 0 <- < 50 50 -< 100 100 =<
Total livestock (1000 LU) 4391.5 2861.4 2500.8 4644.1 14397.8 2481.9 1824.1 10091.8
of which grazing (%) 24.6 46.9 50.5 60.3 45.1 89.4 85.6 26.8
Grazing livestock (1000 heads)
Equidae 58.1 62.0 33.9 71.0 225.0 136.5 35.3 53.2
Bovine animals 790.9 1321.1 1259.9 2469.1 5840.8 1885.3 1256.8 2698.8
Under 1 year 347.0 353.9 397.3 743.8 1842.0 526.4 392.0 923.6
From 1 to less than 2 years 90.3 131.5 165.2 306.6 693.6 153.4 147.4 392.8
Dairy cows 103.1 381.8 324.8 192.3 1001.9 409.2 267.0 325.7
Other cows 168.5 322.5 264.5 796.2 1551.7 596.8 298.6 656.2
Other bovine animals 2 years and older 82.0 131.4 108.1 430.2 751.7 199.5 151.7 400.5
Sheep 4106.3 2622.1 3095.6 9802.9 19626.9 5950.4 5791.0 7885.4
Goats 1144.4 480.9 267.2 624.2 2516.7 1461.3 623.7 431.8
Granivores
Pigs (1000 heads) 8230.5 4387.4 3998.6 6141.9 22758.3 876.6 1008.4 20873.3
Piglets < 20 kg 2331.8 1087.1 1030.3 1610.6 6059.8 393.9 547.6 5118.4
Breeding sows 1250.6 562.4 589.6 975.3 3377.8 192.6 193.8 2991.4
Other pigs 4648.1 2737.9 2378.8 3556.0 13320.7 290.2 267.1 12763.5
Poultry (million heads) 100.4 33.5 19.0 21.2 174.1 3.8 8.5 161.7
Broilers 50.6 21.7 14.2 10.5 96.9 1.6 7.5 87.8
Laying hens 39.8 7.7 2.7 9.5 59.8 1.9 0.9 56.9
Other poultry 10.0 4.0 2.0 1.3 17.4 0.3 0.1 17.0
Rabbits, breeding females (1000 heads) 814.4 327.0 83.3 52.7 1277.4 1096.3 106.3 74.7
Beehives* (1000) 463.2 228.5 90.0 48.5 830.3 192.9 10.0 20.3
Average size of herds**
Equidae (head/holding) 2.2 3.3 4.0 7.0 3.6 2.6 6.6 9.5
Cattle (head/holding) 21.1 28.0 58.6 127.8 46.5 19.1 83.7 225.8
Dairy cows (head/holding) 9.0 19.3 40.0 64.2 23.6 12.2 44.8 107.8
Other cows (head/holding) 7.5 11.4 22.2 69.0 21.0 9.8 41.9 105.2
Sheep (head/holding) 133.2 132.8 271.7 556.2 246.6 99.1 495.0 1005.1
Goats (head/holding) 66.3 53.5 66.6 104.4 69.5 51.7 119.6 157.8
Pigs (head/holding) 196.9 121.4 273.9 459.0 214.9 10.6 123.2 1383.3
Breeding sows (head/holding) 98.1 50.2 95.6 111.3 86.9 7.5 40.8 360.7
Other pigs > 20 kg (head/holding) 134.8 91.2 194.4 322.2 151.7 4.3 39.3 941.0
Rabbits, breeding females (head/holding) 41.5 23.9 17.1 18.2 31.1 28.7 56.6 73.2
Laying hens (1000/holding) 0.6 0.1 0.1 0.7 0.4 0.0 0.1 9.1
Broilers (1000/holding) 2.1 1.2 2.0 2.1 1.8 0.0 2.0 20.9
Beehives (hive/holding) 91.1 56.3 55.6 61.4 71.9 21.7 20.4 52.2
Symbols : not available 0 less than half of the unit or nil
[image:6.595.42.552.99.657.2]Spain – 2005
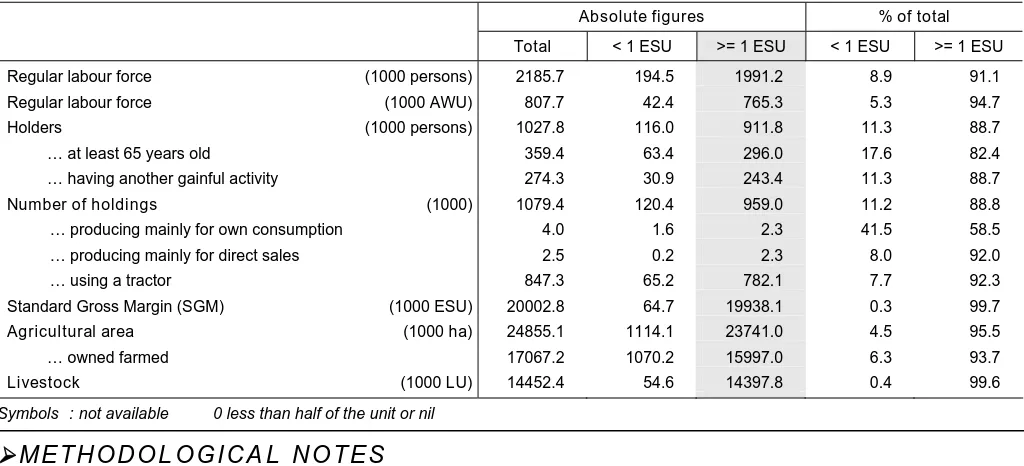
Table 5 – Subsistence farming
Absolute figures % of total
Total < 1 ESU >= 1 ESU < 1 ESU >= 1 ESU
Regular labour force (1000 persons) 2185.7 194.5 1991.2 8.9 91.1
Regular labour force (1000 AWU) 807.7 42.4 765.3 5.3 94.7
Holders (1000 persons) 1027.8 116.0 911.8 11.3 88.7
… at least 65 years old 359.4 63.4 296.0 17.6 82.4
… having another gainful activity 274.3 30.9 243.4 11.3 88.7
Number of holdings (1000) 1079.4 120.4 959.0 11.2 88.8
… producing mainly for own consumption 4.0 1.6 2.3 41.5 58.5
… producing mainly for direct sales 2.5 0.2 2.3 8.0 92.0
… using a tractor 847.3 65.2 782.1 7.7 92.3
Standard Gross Margin (SGM) (1000 ESU) 20002.8 64.7 19938.1 0.3 99.7
Agricultural area (1000 ha) 24855.1 1114.1 23741.0 4.5 95.5
… owned farmed 17067.2 1070.2 15997.0 6.3 93.7
Livestock (1000 LU) 14452.4 54.6 14397.8 0.4 99.6
Symbols : not available 0 less than half of the unit or nil
ME T H O D O L O G I C A L N O T E S
"
The survey on the structure of agricultural holdings in Spain was
carried out between 1 October and 31 December 2005 on a sample
basis. The previous full-scale agricultural census had been
conducted in 1999. The reference period of the farm structure
survey 2005 was the production year 2005 which ended on
30 September 2005. However, for livestock the reference date was
the day of the interview.
The target population was all holdings in the last agricultural census,
which exceeded one of the following three thresholds: at least 1 ha
UAA or at least 0.2 ha UAA under vegetables, flowers and
ornamental plants, production under protection or irrigated fruit trees
or nurseries or at least 1 LSU and 0.75 ESU. A stratified simple
random sample was drawn. The stratification was made separately
for each autonomous community (NUTS 2) based on type of farming
and size of the holding (5 size-classes determined by using
economic size, LSU, UAA, AWU, total area). In the strata, optimum
allocation was applied. Certain holdings were included in an
exhaustive stratum created with the use of the sigma-gap rule to
each key variable in each region. The total size of the sample was
about 55.000.
———————————————————————— 24/2007 — Agriculture and fisheries — St a t i s t i c s i n f o c u s 7