GROWING UP IN IRELAND
KEY FINDINGS: COHORT ’08 AT 9 YEARS OLD
INTRODUCTION
Growing Up in Ireland is the national longitudinal study of children designed to inform policy affecting children and their families. The study follows two cohorts of children, born roughly a decade apart. The families of Cohort ’08 (the Infant Cohort) were first interviewed in 2008/2009, when the child was 9 months old. They were re-interviewed when the child was 3 years, 5 years, and 7/8 years (the latter by postal survey) and between July 2017 and March 2018 when the child was 9 years old. The other cohort is Cohort ‘98 (the Child Cohort) that includes children born in 1998 and recruited into the study when they were 9 years old in 2007/8.
This series of Key Findings draws on information provided by the Cohort ‘08 9-year-old and his or her Primary Caregiver (usually the mother, and henceforth in this report referred to as the mother). The series is based on the 7,563 9-year-olds whose families participated in the study at ages 9 months, 3 years, 5 years and 9 years old.
This Key Findings report is the second in a series from this latest round of data collection from Cohort ’08 at 9 years of age. It looks at children’s attitudes to school and specific school subjects and relates these to their family context and to their skills and dispositions at the age of 5. At the time of the survey, almost all children were in school. Of these, 9% were in second class, 66% were in third class and 24% were in fourth class.1 Out-of-school
learning is also examined and mothers’ reports of their support for, and involvement in, their child’s education are discussed. For some outcomes, findings on the 9-year-olds of Cohort ’08 are contrasted with those of the earlier Cohort ’98. There are important differences between the two cohorts at 9 years old, apart from being born a decade apart. The main difference is that the children in the ‘08 cohort at 9 years old have been living in Ireland since they were 9 months old. The cohort does not include children who had moved to Ireland when they were older than 9 months; or children whose families had dropped out of the study since they were 9 months old. Cohort ’98, on the other hand, was recruited at 9 years old and represents all 9-year-olds living in Ireland at the time they were recruited in 2007/08. Many useful comparisons can be made between the cohorts, but, for the reasons noted here, comparisons between them cannot be used to draw firm conclusions about differences between all 9-year-olds in 2017 and all 9-year-olds in 2007.
NO. 2
SCHOOL AND LEARNING
Growing Up in Ireland is funded by the Department of Children and Youth Affairs (DCYA), with a contribution from The Atlantic Philanthropies in Phase 2; and managed and overseen by the DCYA in association with the Central Statistics Office.
1These figures differ slightly from DES figures for 2017/18 because GUI data
ATTITUDES TO SCHOOL AND SCHOOL SUBJECTS
The majority of children said they ‘always’ or ‘sometimes’ liked school and school subjects
Positive attitudes to school and to school subjects at primary level contribute to improved educational achievement and easier integration into second-level education. Broadly positive attitudes to school were reported by 9-year-olds in 2017, with 33% reporting they always liked school while 62% sometimes liked school. Only 5% reported never liking school. Girls were more likely to report that they always liked school than boys (41% vs. 25%).
In relation to school subjects, attitudes were broadly positive to Reading and Maths but less positive in relation to Irish, with 62% always liking Reading, 48% always liking Maths and 22% always liking Irish (Figure 1). Only 5% reported
never liking Reading, while the proportions never liking Maths or Irish were higher at 10% and 28% respectively (not
illustrated). Girls were more positive than boys about Reading (68% vs. 55% always liking it) and Irish (26% vs. 19%
always liking it) (Figure 1). Boys were more positive than girls about Maths (53% of boys always liking it compared to
[image:2.595.51.393.340.506.2]42% of girls).
Figure 1: The percentage of 9-year-olds who said they always liked school, Reading, Maths and Irish in 2017
0% 10% 20% 30% 40% 50% 60% 70% 80%
Boys Girls All Boys Girls All Boys Girls All Boys Girls School
% of 9-year
-olds
Reading
Always like
Maths Irish
All 25%
41% 33%
55% 68%
62% 53%
42% 48%
19% 26% 22%
The proportion of 9-year-olds who always liked school and school subjects did not vary markedly by household income, mother’s education or family structure. However, children from families with lower maternal education or lower income and from one-parent families were more likely to never like school or school subjects. For example, 9% of children of mothers with Junior Certificate or lower qualifications never liked school compared with 4% of the children of mothers with a degree or higher. Similarly, 38% of children whose mothers had Junior Certificate qualifications never liked Irish compared with 22% of the children of mothers with a degree or higher.
Attitudes to school were more positive among the later
cohort of 9-year-olds (33% of Cohort ’08
always liked
school vs. 27% of Cohort ’98). However, attitudes to school
subjects were very similar.
Girls were
more positive
about school
overall and
about Reading
and Irish. Boys
were more
positive about
At the age of 5, children completed a naming vocabulary test and their teachers were asked to rate their dispositions and attitudes to school. Those who had less developed vocabulary skills at 5 years were significantly less positive about school and school subjects by the age of 9. For example, 13% of those in the lowest fifth of vocabulary scores at age 5 never liked Maths at age 9 compared with 9% of those in the top fifth. Those rated by their teachers as having less positive attitudes to school at age 5 were more likely to have less positive attitudes four years later than those who had been rated as having more positive attitudes at 5: 10% of those who had less positive attitudes to school at age 5 said they never liked school at age 9 compared to 4% of those who had more positive attitudes.
Children whose vocabulary skills were not as strong and who had less positive attitudes to school at age 5 had
more negative attitudes to school and school subjects when they were interviewed at age 9.
READING FOR FUN AMONG 9-YEAR-OLDS
Most 9-year-olds said they read for fun at least a few times a week
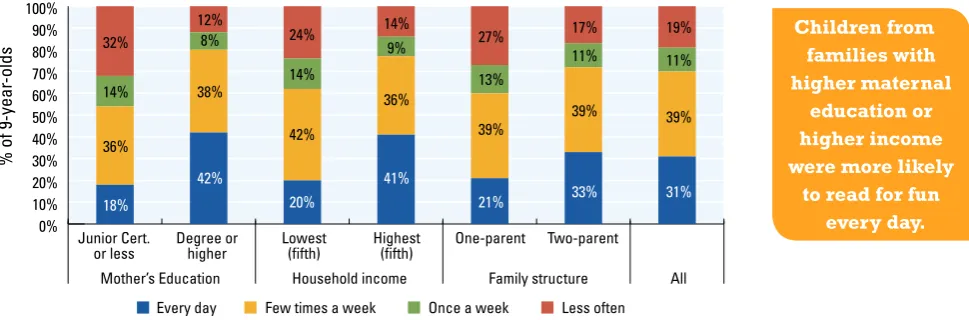
[image:3.595.67.552.436.596.2]Learning takes place outside as well as inside the classroom. Reading with their parents or by themselves has a very positive influence on children’s language development and provides a crucial foundation for in-school learning. In the survey, 9-year-olds were asked about how often they read for fun and what they liked to read. Almost a third (31%) of children said that they read for fun every day, 39% read for fun a few times a week, 11% read for fun once a week while 19% read for fun less often.
Figure 2: How often 9-year-olds read for fun, as reported by the child
Lowest (fifth) Degree or
higher Junior Cert.
or less Highest(fifth) One-parent Two-parent 0%
10% 20% 30% 40% 50% 60% 70% 80% 90% 100%
% of 9-year
-olds
Mother’s Education Household income Family structure All Every day Few times a week Once a week Less often 18%
36% 14% 32%
42% 38% 8% 12%
20% 42% 14% 24%
41% 36% 9% 14%
21% 39% 13% 27%
33% 39% 11% 17%
31% 39% 11% 19%
Note: Income fifths are based on disposable income, after adjusting for household size and composition.
How often children read for fun varied by aspects of their family background. Children whose mothers had a degree or higher were much more likely to read for fun every day (42%) than those whose mothers had a Junior Certificate qualification or less (18%) (Figure 2). A similar difference was seen for household income (41% of 9–year-olds in the top income group read every day compared with 20% of the lowest income group). Reading for fun also varied by family structure, with 33% of children in two-parent families reading every day compared to 21% of those in one-parent families, but this difference was not as large as it was for level of maternal education and income.
Children from
families with
higher maternal
education or
higher income
were more likely
Comparing 9-year-olds in Cohort ’98 and Cohort ’08 (born a decade apart), there was little overall difference in how often children reported reading for fun at age 9. However, children in families with lower income or lower levels of maternal education in the later cohort were more likely to report reading infrequently than their counterparts in the earlier cohort. Among those whose mothers had a Junior Certificate education or lower, 32% of Cohort ’08 read less
than once a week compared to 21% of Cohort ’98. Among those in the lowest income fifth, the figures were 24% for
Cohort ’08 and 19% for Cohort ’98.
Among children from families with lower levels of maternal education or lower income, 9-year-olds from
Cohort ‘08 read for fun less often than those from Cohort ‘98.
Gender differences in reading behaviour
[image:4.595.54.537.359.537.2]As shown earlier, girls were more positive than boys about Reading as a school subject and this is also seen in how often they reported reading for fun: 35% of girls reported reading for fun every day compared to 28% of boys; 24% of boys read less often than once a week compared to 14% of girls (see Figure 3).
Figure 3: How often 9-year-olds reported reading for fun in 2017 and what they liked to read by gender
0% 20% 40% 60% 80% 100%
% of 9-year
-olds
Every
day Few timesa week a weekOnce
Reading frequency Likes reading Less
often Stories/novels fictionNon- Maga-zines Comicbooks
28% 35%
31%
37%42%39%
12% 10%11% 24%
14%19% 80%
91% 86%
35%
18% 27%31%
15% 10% 23%
17% 13%
Boys Girls All
Novels/stories were by far the most popular reading material for both boys (80%) and girls (91%). Boys were more likely than girls to like reading non-fiction (35% compared with 27%) and comic books (23% compared with 10%; Figure 3).
Mothers’ reports on the time 9-year-olds spent reading for pleasure
Mothers were asked about how many hours per day the 9-year-old spent reading for pleasure during the week and at weekends. As with children’s own reports, mothers in 2017 reported significant gender differences in the time spent reading for pleasure. Boys were more likely than girls to never read on a week day (12% compared to 7%), with this gender gap widening at the weekend (22% compared to 12%). At the other end of the spectrum, girls were more likely than boys to read for an hour or more a day (15% compared to 11% during the week and 24% compared to 16% at the weekend) (Figure 4).
As with children’s own reports, the time spent reading for pleasure varied significantly by mother’s education. On a week day, 16% of those whose mothers had a degree or higher qualification read for pleasure every day compared with 11% of those whose mothers had a Junior Certificate or lower qualification. This difference was wider at the weekend, with 26% of those from more highly educated families reading for pleasure for an hour or more every day compared with 12% of those from families with lower levels of education.
Girls read more
often for fun than
boys. They were
more likely than
boys to read
stories / novels
and less likely to
read non-fiction or
Figure 4: The proportion of 9-year-olds in 2017 who read for pleasure for one hour a day or more, as reported by their mothers, by gender and mother’s educational level
% of 9-year
-olds 0% 5% 10% 15% 20% 25% 30% W eekday W eekend All 13% 20% 11% 16% 15% 24% 11% 12% 16% 26%
Boys Girls Junior Cert. Degree Gender Mother’s education
W eekday W eekend W eekday W eekend W eekday W eekend W eekday W eekend
Reading frequency at 9 and earlier language skills and reading experience
The frequency of reading for fun at 9 years of age, as reported by the children, was significantly related to their earlier language skills and experience of reading. Children who had better vocabulary skills at the age of 5 were more likely to read for fun every day at age 9 (see Figure 5). This relationship was strong – 42% of those in the top fifth on the vocabulary test at age 5 read for fun every day at 9 years old compared with just 22% of those who had been in the lowest fifth on the test. Similarly, children who were reported by their teachers as less positively engaged in school at the age of 5 were less likely to read for fun frequently when they were 9 years old (26% compared with 33%). Children whose mothers reported reading to them every day at the age of 5 were more likely to say they read for fun
every day at the age of 9 (35% of those whose mothers read to them every
[image:5.595.66.552.597.788.2]day when they were 5 read for fun every day at 9 compared with 23% of those whose mothers read to them occasionally or less often).
Figure 5: Percentage of 9-year-olds who reported reading for fun daily in 2017 by the child’s vocabulary test score, teacher reports of attitudes to school and mothers’ reports of frequency of reading to the child at the age of 5
0% 5% 10% 15% 20% 25% 30% 35% 40% 45%
% of 9-year
-olds
Lowest 2nd 3rd
Naming vocabulary at 5 Attitudes to school
Characteristics at age 5
Parental reading All 4th Highest Lowest Med.
/High Never/ occas-ionally 1-2 times a week Every day 22% 26% 33% 34% 42% 26% 33% 23% 24% 35% 31%
Note: When the children were aged 5, their teachers were asked to rate their attitudes and dispositions using nine items. In the analysis presented here children with scores of six or lower are termed the ‘lowest’ while those scoring 7 to 9 are termed ‘medium/high’.
The gender
gap in time
spent reading
for pleasure
was wider at the
weekends than
during the week.
Early language
skills and
experiences of
reading were
associated with
greater frequency
Most mothers reported they used the library with their 9-year-old children
[image:6.595.314.551.517.779.2]Almost two-thirds (63%) of mothers reported using the public library with their 9-year-old child. There was significant socio-economic differentiation in library use, with higher levels of use among families with higher income (66%) and where mothers were degree-educated (72%, see Figure 6). There was also a higher likelihood of use of libraries among two-parent than one-parent families (64% compared with 57%). The mothers of girls were more likely to report library use than the mothers of boys (67% compared with 60%). Children whose parents used the public library with them reported reading for fun more often than other children: 36% read every day compared with 24% of those who did not use the library.
Figure 6: Mother’s use of the public library with 9-year-olds in 2017 by child gender and family characteristics
0%
10%
20%
30%
40%
50%
60%
70%
80%
Boys Girls Junior
Cert. Degree Lowest Highest parentOne- parent Two-60%
67%
49%
72%
56%
66%
57%
64% 63%
All Family structure Household income
Mother’s education Gender
% of 9-year
-olds
PARENTAL SUPPORT FOR, AND INVOLVEMENT IN, THE EDUCATION
OF 9-YEAR-OLDS
Parent-teacher meetings and help with homework
Parental involvement in, and support for, their child’s education includes attending a parent-teacher meeting and helping the child with their homework. Very high levels of attendance at parent-teacher meetings were reported, with almost all (98%) parents attending them. Attendance was common across all social groups.
Figure 7: How often mothers helped 9-year-olds with their homework in 2017
Regularly, 21%
Always/nearly always, 42%
Now and again, 21%
Rarely/never, 16%
42%
16%
21%
21%
Voluntary financial contributions to the
primary school
The issue of parents being asked to make a voluntary financial contribution to their child’s school has been controversial because of the burden it potentially places on families. In the survey, mothers were asked whether their child’s school had asked for a contribution, whether they had paid it and the amount involved (calculated per child). Just over a third (34%) of 9-year-olds attended schools where no contribution was requested. In 59% of cases there was a request for a contribution which families had paid, and the remaining 7% had been asked but did not pay. The annual amounts involved (per child) were evenly spread between amounts under €50 and payments between €50 and €99.2 However,
12% of families paid more than €100 per child.
Figure 8: School voluntary financial contribution by mother’s education and household income
0% 10% 20% 30% 40% 50% 60% 70% 80% 90% 100%
% of families of 9-year
-olds
All Mother’s education Household income Junior Cert. Degree Lowest
fifth Highestfifth
Not requested
Requested - not paid
<€50
€50-99
€100+
Amount not known
34%
7% 23%
23%
12%
48%
9% 24%
12%5%
27%
6% 23%
24%
18%
42%
9% 24%
18%
5%
26%
4% 19%
27%
24%
Nearly
two-thirds
of mothers
regularly or
always helped
their 9-year-old
with homework
in 2017.
2A small number (<2%) indicated that they were asked for and paid a financial contribution but information on the amount paid was incomplete.
59%
of mothers
of
9-year-olds paid a
voluntary
contribution
to their child’s
[image:7.595.63.323.143.264.2]Children from families with lower levels of maternal education and income were more likely to attend schools where they were not asked for a financial contribution. Thus, 42% of the lowest income group were not asked for a contribution compared with 26% of the highest income group. These patterns largely reflect the over-representation of families with lower incomes and maternal education in DEIS schools which were less likely to request a contribution than non-DEIS schools (63% of families with children in Urban Band 1 DEIS schools were not asked for a contribution compared with 31% of those in non-DEIS schools).
In addition, families with lower levels of maternal education and income were less likely to pay a contribution when one was requested; thus, 9% of the lowest income group did not pay the contribution while this was the case for 4% of the highest income group (Figure 8). Family structure was not related to being asked for a voluntary contribution but one-parent families were less likely to have paid where there was a request (12% compared with 6% of two-parent families). Families with higher levels of income or maternal education were more likely to be asked to make larger contributions; 24% of the highest income group paid €100 or more per child while this was the case for only 5% of the lowest income group. However, it is worth noting that 23% of low-income families were contributing over €50 per child per year.
Educational expectations for 9-year-olds
Mothers were asked how far they expected their child to go within the education system. Expectations were very high for 9-year-olds in 2017, with four-fifths (82%) of mothers expecting their child to obtain a degree or higher qualification. Only 7% of parents felt their child would finish their education at Leaving Certificate level or earlier. Parents held higher expectations for girls than for boys (86% compared with 79% expecting them to go on to higher education), a pattern that was also observed in the earlier Cohort ’98.
Figure 9: Mothers’ expectations that 9-year-olds will reach degree level or higher by child gender and family characteristics
0% 10% 20% 30% 40% 50% 60% 70% 80% 90% 100%
All Gender Mother’s education Household income Family structure Boys Girls Junior
Cert. Degree Lowestfifth Highestfifth parentOne- parent
Two-82% 79% 86%
58%
95%
68%
94%
74%
83%
% of 9-year
-olds
Mothers held high educational expectations for their children. These expectations were even higher
than they had been among mothers of the cohort of 9-year olds interviewed 10 years earlier.
Registering for a second-level school
[image:10.595.282.545.119.480.2]The issue of second-level school enrolment has been subject to recent legislation removing criteria (such as very early registration on waiting lists) which disadvantage some families. However, there has to date been little information on the prevalence of early registration. Just over one-fifth (21%) of mothers reported that they had already put their child’s name down for a second-level school by age 9. Among this group, 41% had put their child’s name down for two or more schools.
Figure 10 shows much higher rates of early registration for a second-level school among families with high income (40%) and families with high maternal education (31%). The mothers of girls were somewhat more likely than the mothers of boys to have already put their name down for a second-level school (23% compared with 18%). This is likely to reflect the fact that more girls than boys attend single-sex schools, which are more likely to be over-subscribed. Early registration was also much more common in urban than in rural areas (33% compared with 11%), most likely because urban schools are more likely to be over-subscribed.
Figure 10: Registering for a second-level school by age 9 according to child gender and family characteristics
All Gender Mother’s education Household income Family structure Boys Girls Junior
Cert. Degree Lowestfifth Highestfifth parentOne- parent
Two-21% 18%
23%
7%
31%
11% 40%
14% 21%
% of 9-year
-olds
0% 5% 10% 15% 20% 25% 30% 35% 40% 45%
Two-fifths of
high-income families had
already put their
child’s name down
for a second-level
school. This was more
[image:10.595.47.387.521.680.2]Attitudes to school and school subjects can already be formed
at primary level. Broadly positive attitudes were found among
9-year-olds. Only 5%
never liked school but higher proportions
never liked Maths (10%) or Irish (28%).
The majority (59%) of parents were asked for and made a voluntary
financial contribution to their child’s primary school.
Higher-income families were more likely to be asked to contribute and to
have given a larger amount, but 23% of low-income families were
contributing over
€
50 per child per year.
Most 9-year-olds (69%) read for fun at least a few times a
week. However, among children from families with lower
levels of maternal education or lower income, 9-year-olds
from Cohort ’08 read for fun less often than those from Cohort
’98. Reading for fun was more common among girls, children
whose families had higher levels of maternal education and
income, and where their parents had read to them every day
when they were younger.
Mothers held high educational expectations for their children,
with 82% expecting them to go on to higher education, compared
to 71% among the parents of the 9-year-olds in Cohort ’98 ten
years earlier.
BACKGROUND
Growing Up in Ireland is the national longitudinal
study of children and young people. The study is
funded by the Department of Children and Youth
Affairs (DCYA), with a contribution from The Atlantic
Philanthropies, and is managed by the DCYA in
association with the Central Statistics Office. It is
being carried out by a consortium of researchers
led by the Economic and Social Research Institute
(ESRI) and Trinity College Dublin (TCD).
The study tracks the development of two nationally
representative cohorts of children over time.
Cohort ’08 (Infant Cohort) families were first
interviewed on a face-to-face basis when the Study
Child was 9 months and subsequently at 3 years,
5 years, and most recently at age 9. The families
were surveyed by post at 7/8 years. Cohort ’98
(Child Cohort) families were interviewed at 9 years
(in 2007/08), at 13 and at 17/18 years and at age 20
in 2018/19.
There were just over 11,100 9-month-olds in
the first round of interviews with the families of
Cohort ’08 between September 2008 and March
2009. The response rate was 65%. The second
round of interviews (at 3 years of age) took
place between January and August 2011; the
third round of interviews (at 5 years of age) was
completed between March and September 2013.
The response rate (as a percentage of those who
had participated in the previous wave) was 90% at
both the second and third rounds. The fourth round
of data collection (at 7/8 years old) was conducted
on a postal basis (from March to October 2016),
with a 55% response rate. The fifth round at age 9
was conducted on a face-to-face basis (from June
2017 to April 2018), with a response rate of 88.1%
of those who had participated at age 5. These Key
Findings reports analyse the 7,563 children whose
families participated in the rounds at 9 months, 3
years, 5 years and 9 years (i.e. excluding children
who missed the 3 year or 5 year interview).
The questionnaires can be found at:
https://www.growingup.ie.
In any study that follows people over time, some will
drop out. To account for non-response, information
collected in the surveys was statistically adjusted
on the basis of mother’s education, family income
and family social class. This ensures that the data
are representative of the population as a whole -
all 9-year-olds who had lived in Ireland since they
were 9 months old. All figures presented in this
Key Findings report are based on the statistically
adjusted data. While the researchers have made
every effort to adjust for any differences between
those who left the study and those who continued
to participate, it is possible that this adjustment is
imperfect.
The figures presented here are purely descriptive
and do not control for potential interactions or
confounding effects.
All figures are preliminary and may be subject to
change.
Access to Growing Up in Ireland data:
Anonymised versions of all data collected
in Growing Up in Ireland are available for
research through the Irish Social Science Data
Archive (ISSDA, https://www.ucd.ie/issda/) for
quantitative data; and the Irish Qualitative Data
Archive (IQDA, https://www.maynoothuniversity.
ie/iqda) for qualitative data.
THANK YOU TO ALL PARTICIPANTS
The success of Growing Up in Ireland is the
result of contributions from a large number of
individuals, schools, organisations and groups,
many of whom helped to recruit the sample and
collect the data. The Study Team is particularly
grateful to the thousands of families from every
part of the country who gave so generously of their
time on numerous occasions to make this study
possible. A very big ‘thank you’ to all the children
and their families.
For further information about Growing Up in
Ireland visit www.growingup.ie or email
growingup@esri.ie or Freephone 1800 200 434.
If you would like further information about Growing Up in Ireland visit: www.growingup.ie