The effect of physical fatigue on oscillatory dynamics of the
sensorimotor cortex
Adam Fry1, Karen J. Mullinger2,3, George C. O‟Neill2, Matthew J. Brookes2 and Jonathan P. Folland1
1
School of Sport, Exercise and Health Sciences, Loughborough University, Leicestershire, LE11 3TU, United Kingdom
2
Sir Peter Mansfield Imaging Centre, School of Physics and Astronomy, University of Nottingham, University Park, Nottingham, NG7 2RD, United Kingdom
3
Birmingham University Imaging Centre, School of Psychology, University of Birmingham, Birmingham, B15 2TT, United Kingdom
*Correspondence to:
Adam Fry,
School of Sport Exercise & Health Sciences, Loughborough University,
Leicestershire, LE113TU UK
E-mail: [email protected]
ABSTRACT
Aim: While physical fatigue is known to arise in part from supraspinal mechanisms
within the brain exactly how brain activity is modulated during fatigue is not well
understood. Therefore, this study examined how typical neural oscillatory responses to
voluntary muscle contractions were affected by fatigue.
Methods: Eleven healthy adults (age 27±4 years) completed two experimental sessions
in a randomised crossover design. Both sessions first assessed baseline maximal
voluntary isometric wrist-flexion force (MVFb). Participants then performed an
identical series of fourteen test contractions (2 × 100%MVFb, 10 × 40%MVFb, 2 ×
100%MVFb) both before and after one of two interventions: forty 12-s contractions at
55%MVFb (fatigue intervention) or 5%MVFb (control intervention).
Magnetoencephalography (MEG) was used to characterise both the movement-related
mu and beta decrease (MRMD and MRBD) and the post-movement beta rebound
(PMBR) within the contralateral sensorimotor cortex during the 40%MVFb test
contractions, while the 100%MVFb test contractions were used to monitor physical
fatigue.
Results: The fatigue intervention induced a substantial physical fatigue that endured
throughout the post-intervention measurements (28.9-29.5% decrease in MVF,
P<0.001). Fatigue had a significant effect on both PMBR (ANOVA, session ×
time-point interaction: P=0.018) and MRBD (P=0.021): the magnitude of PMBR increased
following the fatigue but not the control interventions, whereas MRBD was decreased
post-control but not post-fatigue. Mu oscillations were unchanged throughout both
Conclusion: Physical fatigue resulted in an increased PMBR, and offset attenuations in
MRBD associated with task habituation.
Keywords: magnetoencephalography; MEG; motor; sensory; mu; beta; event-related
INTRODUCTION
Physical fatigue can be defined as a reversible decline in the force generating capacity
of the neuromuscular system. During physical activity, fatigue arises not only from
peripheral processes within the active skeletal muscle(s) but also from supraspinal
mechanisms within the brain (Gandevia 2001). In fact, studies utilising transcranial
magnetic stimulation (TMS) have demonstrated supraspinal fatigue (a component of
central fatigue relating to a progressively suboptimal output from the motor cortex) can
account for as much as 66% of the exhibited physical fatigue during a prolonged
low-intensity muscle contraction (Smith et al. 2007), and as much as 30% during a 2-min
maximal contraction (Taylor et al. 2006). Overall, fatigue has clear implications to
physical performance, and is experienced as a chronic activity-limiting symptom that
adversely affects the quality of life in many physical, neurological and psychiatric
disorders. However, exactly how brain activity is modulated during physical fatigue is
not well understood.
Previous attempts at neuroimaging during physical fatigue have largely relied upon
functional magnetic resonance imaging (fMRI). Here, an increase in sensorimotor
neural activity is inferred from increases in the blood-oxygen-level dependent (BOLD)
fMRI signal, which have been found to accompany fatigue onset during the
performance of both maximal (Liu et al. 2002; Steens et al. 2012) and submaximal
isometric contractions (Liu et al. 2003; van Duinen et al. 2007; Benwell et al. 2007).
However, the haemodynamically derived fMRI signal is both physiologically and
temporally remote from the electrical activity that is of primary interest as the method
of communication within the brain. Dendritic currents, synchronised across neuronal
role in co-ordinating brain function (Donner & Siegel 2011). This rhythmic oscillatory
activity can be non-invasively assessed using electroencephalography (EEG) and
magnetoencephalography (MEG), with the latter offering greater spatial resolution and
sensitivity due, in part, to the fact that magnetic fields are not distorted by the biological
tissues between the cortex and sensors (Cheyne 2013).
In the sensorimotor system, motor action has been linked with robust changes in neural
oscillations in the mu (~8-15 Hz) and beta (~15-30 Hz) bands. During the preparation
and performance of unilateral movements, decreases in both mu and beta amplitude are
observed, with the largest effect occurring local to the contralateral primary
sensorimotor cortex (Jasper & Penfield 1949; Salmelin & Hari 1994; Pfurtscheller et al.
2003). These responses are known as the movement-related mu/beta decrease
(MRMD/MRBD), or event-related desynchronisation. Following movement cessation,
beta oscillations exhibit a period of elevated amplitude, known as the post-movement
beta rebound (PMBR) (Pfurtscheller et al. 1996; Jurkiewicz et al. 2006). These
responses have been measured widely, and recent work suggests that they may have
great potential to inform important biomarkers for disease. For example, PMBR is
greater in healthy controls than patients with schizophrenia, and the magnitude of
PMBR in patients correlates with persistent symptoms of disease (Robson et al. 2016). In individuals with Parkinson‟s disease, where movements are limited and poorly
controlled, resting beta oscillations are increased and the relative magnitude of MRBD
and PMBR are reduced in amplitude compared with healthy controls
(Heinrichs-Graham et al. 2014; Pollok et al. 2012). Additionally, these responses may have further
clinical utility by informing brain computer interfaces (Pfurtscheller & Solis-Escalante
Despite their robust nature and high potential value these movement-related oscillatory
responses remain poorly understood, and whether they are modulated by physical
fatigue is largely unknown. Knowledge of the interactions between sensorimotor
oscillatory activity and physical fatigue may help to inform our understanding of the
nature of fatigue. Moreover, these interactions may have important implications for
researchers who measure and interpret these oscillatory responses in a wider context.
One preliminary study measured sensorimotor oscillations during submaximal
contractions performed in a state of physical fatigue and reported an elimination of
MRBD (Tecchio et al. 2006). This might indicate a strong influence of fatigue on the
typically robust movement-related oscillatory dynamics described above, importantly
however, no control session was conducted making it impossible to isolate fatigue from
time/habituation effects. Therefore, the purpose of the current study was to determine
the influence of physical fatigue on movement-related oscillatory dynamics within the
sensorimotor cortex, using a crossover (fatigue and control) design to isolate the effects
of fatigue. Our previous work (Fry et al. 2016) has shown MRBD magnitude to be
independent of changes in contraction kinetics, while PMBR was augmented following
greater sensorimotor activity. By extension, we hypothesise that MRMD and MRBD
will be unaffected by the development of physical fatigue, whereas the PMBR
following submaximal contractions may be increased.
MATERIALS AND METHODS
Fourteen healthy adults with no known history of neurological or musculoskeletal
disorders volunteered their participation. Three participants found the fatigue protocol
(described below) particularly challenging, such that they were unable to maintain the
post-intervention test contractions for the prescribed time, and were omitted from
subsequent analyses. This left a total of eleven participants (7 males, 2 left handed, age
27 ± 4 years [mean ± standard deviation]). The experimental procedures were approved
by the Loughborough University Ethical Advisory Committee, and each participant
provided written informed consent prior to their involvement. All experimental
measurements were carried out in the MEG facility at the Sir Peter Mansfield Imaging
Centre, University of Nottingham, UK.
Experimental protocol
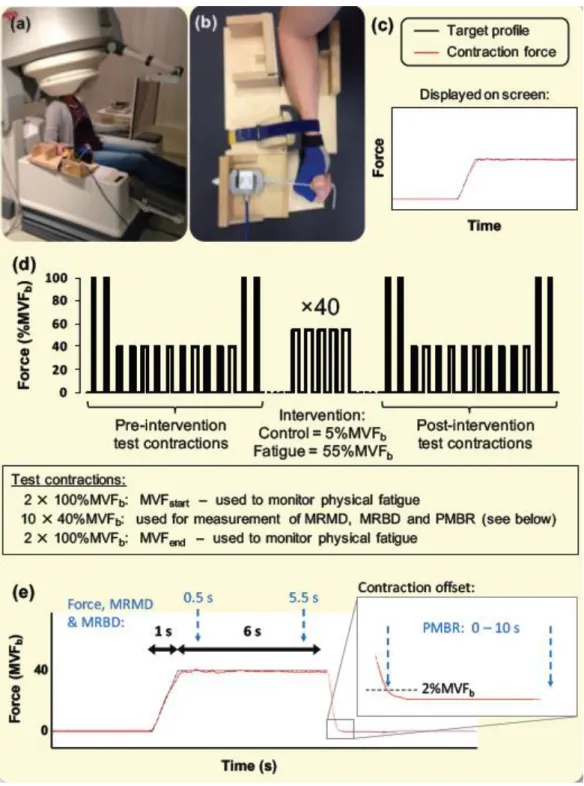
An overview of the experimental procedure is given in Fig. 1. Participants were seated
upright in the MEG system with their right forearm and hand positioned in a custom
built isometric wrist-flexion dynamometer that was secured to the armrest of the MEG
system (Fig. 1a,b). The dynamometer held the participant‟s arm in a neutral position of
pronation/supination, radial/ulnar deviation and wrist flexion/extension. Waist and right
forearm straps were lightly applied to maintain a consistent posture, but without risk of
restricting blood flow. Participants were instructed to exert wrist-flexion force against a
cylindrical handle that was attached in series to a strain gauge. The handle was sewn
onto a mitt that participants wore throughout the experimental sessions to ensure a
length). Participants were also instructed to refrain from any movements other than the
prescribed wrist-flexion (e.g. gripping).
Participants were well familiarised with the motor tasks and MEG environment prior to
their participation in two experimental sessions. A randomised crossover design was
adopted with sessions completed approximately 7 days apart and at a consistent time of
day. Participants were instructed to abstain from strenuous or atypical exercise for 36
hours prior to each experimental session, and to avoid the intake of nutritional
stimulants (e.g. caffeine) within two hours of the session.
Each experimental session started with a short warm up of submaximal isometric
wrist-flexions. Participants then completed four maximal voluntary contractions, with 30 s
rest between contractions, from which a baseline value of maximal voluntary force
(MVFb) was established. Participants were instructed to exert a maximum effort of
wrist-flexion force continuously for 3 s, with visual biofeedback and verbal
encouragement provided. The peak force (200 ms epoch)during these contractions was
used as the measure of MVFb from which all subsequent force outputs were prescribed.
A 5-min rest was then provided before commencing the pre-intervention test
contractions.
Pre- and post-intervention test contractions both involved an identical series of fourteen
prescribed wrist-flexion contractions: two maximal voluntary contractions (MVFstart),
ten contractions at 40%MVFb, and a further two maximal contractions (MVFend) (Fig.
1d). The 40%MVFb contractions were 6 s duration, and performed every 30 s, in order
to measure oscillatory activity with MEG both during (MRMD & MRBD) and post
test the neuronal responses before and after the fatigue/control interventions.
Submaximal contractions were used so that participants were able to repeat the
contractions enough times to collect a sufficient quantity of MEG data, and also to
ensure that the same motor task (with respect to force output) could be replicated even
during a state of physical fatigue. The maximal voluntary contractions were used to
determine MVF at two time-points pre- and post-intervention, allowing monitoring of
each participant‟s fatigue throughout each experimental session. These maximal
contractions were 3 s duration, and performed every 30 s. Participants had received
prior instructions to perform a maximal effort of wrist-flexion for this entire duration.
Both interventions comprised a series of 40 contractions; each of 12 s duration,
performed every 30 s, and at a constant-force of either 5%MVFb (control intervention)
or 55%MVFb (fatigue intervention).An additional 90sof rest was provided both before
and after the intervention. The fatigue intervention was designed to induce physical
fatigue, whereas the control intervention was designed to involve the same number and
duration of contractions as the fatigue intervention, but without posing a physical
challenge. As fatigue developed during the fatigue intervention, participants attempted
to maintain the 55%MVFb force output for as much of the 12 s as they could, and
maintained a maximal effort of force output thereafter. The specific force level for the
fatigue intervention (55%MVFb) was selected following comprehensive pilot testing,
which found this protocol to be practicable for most participants, while also being
fatiguing to all those who attempted it.
Force prescription and feedback was facilitated by participants viewing a visual display
throughout the experimental procedures. They were presented with a temporal profile of
their contraction force to the target profiles as closely as possible. Real-time (measured)
contraction force was overlaid on the target profile and this provided feedback (see Fig.
1c). The target force profile for each contraction included a preparatory period of 2-8 s
at 0%MVFb (time dependent on forthcoming contraction duration), a linear ramp of 1 s
duration, and a constant-force (plateau) phase at the prescribed force output (times
detailed above). Each profile disappeared to leave a blank screen immediately following
each contraction (constant-force phase). Participants received prior instructions to cease
the contraction as soon as the target force profile had disappeared from the screen.
Data Collection
MEG data were collected during the 40%MVFb test contractions and intervening rest
periods. MEG data were sampled at 600 Hz using a 275 channel CTF MEG system
(MISL, Coquitlam, Canada) operating in third order synthetic gradiometer configuration.
Three localisation coils were attached to the head as fiducial markers (nasion, left
preauricular and right preauricular) prior to the recording. Energising these coils
throughout data acquisition enabled continuous localisation of the fiducial markers
relative to the MEG sensor geometry. This also allowed us to monitor if the participants‟
head position had shifted during the intervention, and to make readjustments prior to the
post-intervention test contractions. In order to coregister individual brain anatomy to the
MEG sensor array, each participant's head shape was digitised (Polhemus IsoTrack,
Colchester, VT, USA) relative to the fiducial markers prior to the MEG recording.
Separately, volumetric anatomical MR images were acquired for each participant using
(1-mm3 resolution). Each participant‟s head surface was extracted from the MR image
and coregistered (via surface matching) to their digitised head shape. This allowed
complete coregistration of the MEG sensor array to the brain anatomy, facilitating
subsequent forward and inverse calculations.
Force data were measured using a calibrated S-beam strain gauge (0-500 N linear range;
Force Logic, Swallowfield, UK) housed in the isometric wrist-flexion dynamometer.
Force data were sampled at 2000 Hz by a PC running Spike 2 software (CED,
Cambridge, UK), via an external A/D converter (Micro 1401, CED, Cambridge, UK).
For each individual contraction, markers were inserted within the MEG and force
recordings to time-synchronise the two data sources.
Data Analyses
Mean force output and steadiness (standard deviation of the contraction force within
each 40%MVFb contraction) were determined for each individual contraction. Averages
of these mean and steadiness values were calculated first within each individual, and
subsequently averaged across participants. The first and last 0.5 s of each contraction
(constant-force phase) were excluded from all analyses to ensure force output was at the
prescribed level throughout the analysed time-window (see Fig. 1e).
Initially, MEG data were visually inspected in order to exclude common sources of
interference, including the magnetomyogram, magnetooculogram and
magnetocardiogram, which are easily identified from their well characterised MEG
signatures. Following this pre-processing, MEG data were analysed using synthetic
localise neural oscillatory amplitude changes. Firstly, pre- and post-intervention
measurements were concatenated so that source localisation produced a single location
of interest (LOI) for each experimental session. This approach ensured the region of the
cortex analysed was consistent pre- and post-intervention, and any observed changes in
oscillatory amplitudes were due to the intervention and not an inconsistency in LOI.
Subsequently, data were filtered to the mu (8-15 Hz) and beta (15-30 Hz) bands. These
exact frequency bands were iteratively determined by generating time-frequency spectra
and evaluating the banded oscillatory responses. Importantly, the 15 Hz boundary was
chosen to optimally dissociate the mu and beta responses. Oscillatory amplitude was
then contrasted between active and control time windows in order to delineate the
spatial signatures of mu and beta amplitude changes. Individual LOIs were sought for
the MRMD, MRBD and PMBR in order to construct beamformers that were optimal for
quantifying each response, and because the peak location of these phenomena may
differ significantly (Fry et al. 2016). To localise MRMD and MRBD an active window
between 0.5 and 5.5 s of the 40%MVFb test contractions was used. To localise PMBR
an active window commencing 0.25 s after contraction offset and lasting 5 s was used;
where contraction offset was defined as the time at which contraction force fell below
2%MVFb when returning to rest (Fig. 1e). In all cases, the control window commenced
20 s after the prescribed contraction onset and lasted for 5 s. The forward model was
based upon a multiple local sphere head model and the forward calculation by Sarvas
(Sarvas 1987; Huang et al. 1999). Pseudo-t-statistical images (5-mm3 isotropic
resolution) were generated showing regions of oscillatory amplitude exhibiting
sensorimotor regions were identified (where present) and used as LOIs for subsequent
analysis.
Following identification of LOIs using SAM, time frequency spectrograms were
generated for each individual participant in order to measure oscillatory dynamics both
pre- and post-intervention, in both sessions. Here, another SAM beamformer was
applied, this time with weighting parameters determined for each LOI using a
covariance window spanning the 1-150 Hz frequency range, and a time window
encompassing the ten 40%MVFb test contractions and their inter-contraction rest
periods. The derived beamformer weights for each location were multiplied by the
MEG data (filtered 1-150 Hz) to create a „virtual sensor‟ time-series of the electrical
activity at that LOI. Virtual sensor time-series were filtered into 31 overlapping
frequency bands, and a Hilbert transform was used to generate the amplitude envelope
of oscillations within each band. For each intervention (fatigue and control), these
envelope time-courses were then averaged across the ten 40%MVFb test contractions
measured pre- and post-intervention, separately. Averaged envelopes were baseline
corrected by subtracting the baseline activity (average signal from 20-25 s window
relative to contraction onset) from the whole 25-s trial, for each envelope separately.
Baseline corrected envelopes in the overlapping frequency bands were then
concatenated in the frequency dimension to generate a single time frequency spectrum
(TFS) per participant, for each LOI identified. TFSs were subsequently averaged over
all participants leaving a single TFS from the spatial maxima of the MRMD, MRBD
and PMBR.
To assess the effect of fatigue on oscillatory activity, mean values of MRMD, MRBD
were calculated as the integral of the amplitude of the signal in the 8-15/15-30 Hz
frequency bands across the same active time windows as those used to identify LOIs
(0.5-5.5 s relative to contraction onset), and were divided by the duration (5 s) of these
windows. Thus, MRMD and MRBD represent the mean mu/beta amplitude decrease
from baseline during the 40%MVFb test contractions. For PMBR, the total integral of
the beta amplitude was calculated between 0-10 s following contraction offset, which
allowed for this protracted response to reach baseline. These results were separately
generated from the individual LOIs of each response in each participant. This analysis
yielded a single value (absolute difference from baseline) of MRMD, MRBD and
PMBR for each participant, both pre- and post-intervention in both the fatigue and
control sessions (i.e. four values per participant). These values were then averaged
across participants to determine group means and standard deviations. In addition,
MRMD, MRBD and PMBR were also calculated as percentage changes from baseline
amplitude to investigate whether any changes in these oscillatory responses can be
explained purely by changes in baseline activity.
Individual responses were confirmed as local to the contralateral sensorimotor cortex in
individual brain space following SAM beamforming, however, to characterise the group
mean spatial location of MRMD, MRBD and PMBR, individual brain images were
normalised to an anatomical standard (Montreal Neurological Institute (MNI) brain)
using FLIRT in FSL. The MNI coordinates for each peak (MRMD, MRBD and PMBR)
in each participant were then measured, before averaging across participants to create
MNI co-ordinates of the group means. The most likely cortical locations of the mean
Two-way repeated measures ANOVAs were used to compare both force output and
neural oscillations between experimental sessions (control vs. fatigue session) and
across measurement time-points (e.g. pre- vs. post-intervention for neural oscillations,
or 4 time-points [start and end of test contractions both pre- and post-intervention] for
MVF). In the event of a significant session × time-point interaction effect, post-hoc
paired t-tests/ one-way repeated measures ANOVAs (with Bonferroni corrections) were
performed as appropriate to elucidate the cause of these effects. Effect sizes (Cohen‟s dz
[as per Lakens (2013)]) were also calculated using the delta scores (post – pre) for the
control and fatigue sessions where a significant interaction effect was identified in the
analyses of MRMD, MRBD and PMBR. Finally, a paired t-test was also used to
compare the average contraction force between the first and last five repetitions of the
fatigue intervention.A P-value below 0.05 was considered statistically significant.Data
are expressed as group means ± standard error of the mean (SEM) unless otherwise
stated.
RESULTS
Force measurements
Eleven participants were able to accurately perform the prescribed 40%MVFb test
contractions throughout both experimental sessions (Table1). Neither intervention had
any influence on either the mean force output (ANOVA; session, time-point and session
× time-point interaction effects: all P≥0.269) or the steadiness of force output (all
oscillatory neuronal activity was assessed was kinetically equivalent before and after
both interventions.
Wrist-flexion MVFb was similar for the fatigue and control sessions (mean ± standard
deviation: 282.8 ± 82.6 N and 278.1 ± 74.4 N, respectively). During the fatigue
intervention, maintaining 55%MVFb for 12 s became supra-maximal for all participants.
Overall, the mean force was 23.0% lower in the last five contractions compared to the
first five (of forty) (53.7 ± 0.5 vs. 41.3 ± 2.2%MVFb; t-test, P<0.001), demonstrating
the occurrence of fatigue during this intervention. Conversely, the 5%MVFb
contractions in the control intervention were performed without any difficulty or
sensations of fatigue.
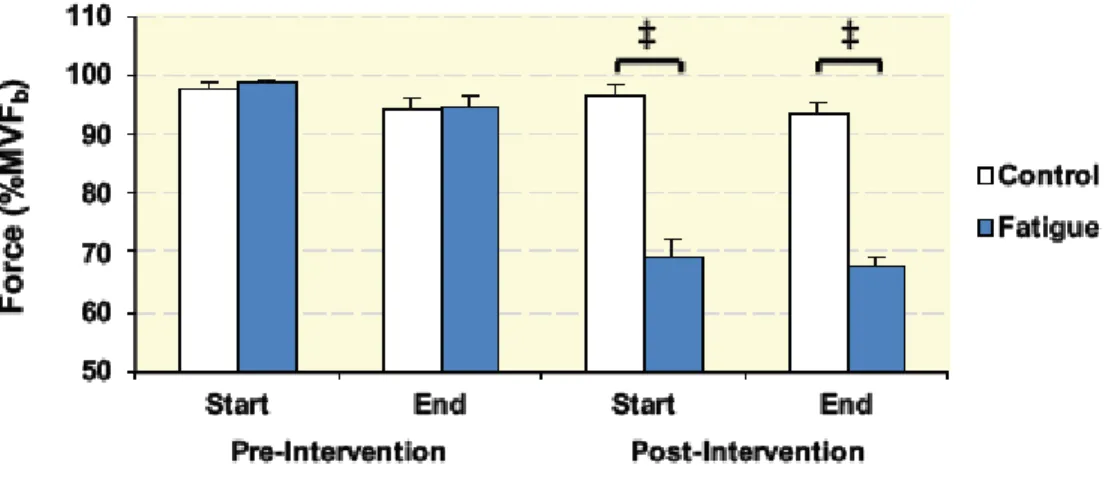
The efficacy of the fatigue intervention was clearly demonstrated by the MVF
measurements (ANOVA; session × time-point interaction effect: P<0.001; Fig. 2). Both
MVFpost-start and MVFpost-end (see Fig. 1d) were markedly attenuated from their
respective pre-intervention values (MVFpre-start and MVFpre-end) in the fatigue session
(-29.5 ± 3.0% and -28.9 ± 2.4%, ANOVA: P<0.001 following Bonferroni correction) but
not the control session (P≥0.511). Additionally, paired t-tests confirmed that MVF
differed between the two experimental sessions in both post-intervention measurements
(P<0.001), but not pre-intervention (P≥0.531). No significant differences were observed
between MVFstart and MVFend either pre- or post-intervention in either session
(P≥0.063), indicating that the 40%MVFb test contractions did not have a significant
fatiguing effect in themselves.
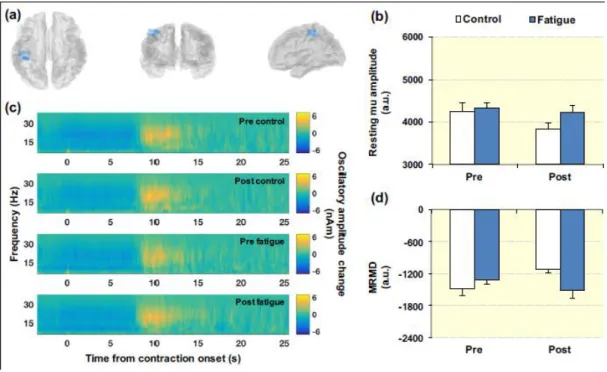
The primary results for the mu band analyses are shown in Fig. 3 A clear MRMD, local
to the contralateral sensorimotor cortex, was observed in 9 of the 11 participants. Fig. 3a
illustrates the locations of peak MRMD for these 9 participants, plotted in MNI space.
Fig. 3b shows the magnitude of the baseline (resting) mu amplitude at the location of
MRMD, averaged across participants, both pre- and post-intervention in both sessions.
Statistical analysis revealed that resting mu amplitude was similar both pre- and
post-intervention in both experimental sessions (ANOVA; session, time-point and session ×
time-point interaction effects: all P≥0.092; Fig. 3b). Fig. 3c shows the time-frequency
spectrograms extracted from the locations of MRMD, and averaged across participants.
In each TFS, blue represents a decrease in oscillatory amplitude with respect to baseline
whereas yellow reflects an increase. A clear decrease in mu oscillations (the MRMD)
occurring prior to and throughout the 40%MVFb contractions is seen in each TFS. Fig.
3d shows the average magnitude of MRMD. MRMD was similar throughout both
experimental sessions (ANOVA; session, time-point and session × time-point interaction effects: all P≥0.325; Fig. 3d), suggesting that there was no consistent effect
of physical fatigue on mu band oscillatory dynamics.
The primary results for the beta band analyses are shown in Fig. 4 and 5. The layouts
are equivalent to that of Fig. 3 (described above). A clear MRBD and PMBR, local to
the contralateral sensorimotor cortex, was observed in 10 and 9 of the 11 participants,
respectively. The locations of peak MRBD and PMBR for all participants are shown in
Figs. 4a and 5a. Resting beta activity at the location of MRBD decreased between pre-
and post-intervention (ANOVA, time-point effect: P=0.014; Fig. 4b), however these
following both interventions, and with no difference between experimental sessions
(ANOVA, time-point effect: P=0.031; session and session × time-point interaction effects: both P≥0.138; Fig. 5b). As expected there was a decrease in beta amplitude
immediately prior to and throughout the 40%MVFb contractions, and a beta rebound
following contraction offset was evident during both experimental sessions (Fig. 4c and
5c). MRBD demonstrated a different response to the two interventions (ANOVA,
session × time-point interaction: P=0.021; effect size: dz = 0.89; Fig. 4d); decreasing in
magnitude from pre- to post-intervention in the control session (i.e. a smaller decrease
in beta amplitude is seen post-control intervention; t-test: P=0.006), but not the fatigue
session (P=0.470). Conversely, the magnitude of PMBR was affected by physical
fatigue (ANOVA; session × time-point interaction: P=0.018; effect size: dz = 0.99; Fig.
5d); demonstrating an increase following the fatigue intervention (i.e. a larger PMBR
post-fatigue intervention; t-test: P<0.001), but not the control intervention (P=0.623).
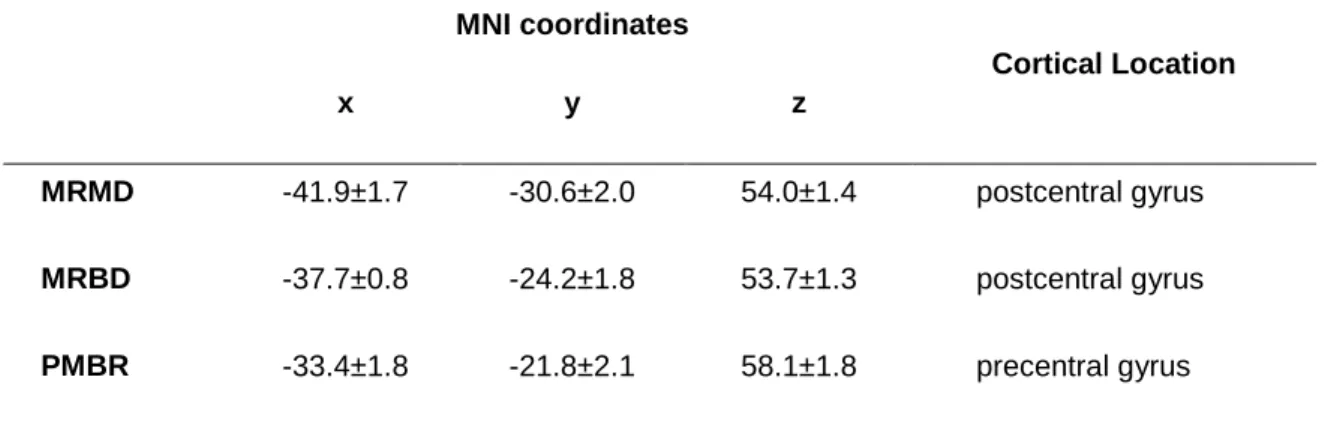
The mean MNI coordinates of MRMD, MRBD and PMBR are displayed in Table 2,
alongside the most likely cortical locations of these coordinates according to the
Oxford-Harvard brain atlas. These results show the spatial peaks of MRMD and MRBD
were located postcentrally, whereas PMBR arose precentrally.
Overall, whether MRMD, MRBD and PMBR were expressed in absolute terms
(presented above), or as a percentage change relative to resting (baseline) oscillatory
amplitude, the effects of physical fatigue on these oscillatory responses were extremely
similar. Relative MRBD showed a session × time-point interaction, with a substantial
decrease after the control intervention and no change following the fatigue intervention
(Table 3). This was despite the decrease in resting beta amplitude observed in both
time-point interaction for relative PMBR, with a greater rebound observed post-fatigue but
not post-control.
DISCUSSION
Physical fatigue arises not only from peripheral processes within the muscles but also
from supraspinal mechanisms within the cortex. However, exactly how
electrophysiological brain activity is modulated during fatigue is not well understood.
This study used MEG to provide a direct measure of neural activity during voluntary
muscle contractions performed in a state of physical fatigue. The primary findings were
that MRBD was maintained following the fatigue inducing intervention, in contrast a
reduction in MRBD was found after the control intervention, and PMBR magnitude was
found to increase following the fatigue but not the control intervention. MRMD was
unchanged following either intervention.
From the force recordings it was clear that the fatigue intervention induced substantial
physical fatigue (~30% reduction in MVF) that endured throughout the
post-intervention measurements; and was in clear contrast to the control session. Moreover,
despite the exhibited fatigue, eleven of the fourteen initial participants were able to
accurately perform all of the prescribed 40%MVFb contractions, which were used to
assess movement-related oscillatory dynamics. These contractions were kinetically
equivalent (force and steadiness) before and after both interventions, demonstrating
The MRBD was consistent throughout the fatigue session, whereas an attenuation was
observed following the control intervention. Our observation that MRBD was
maintained following the fatigue intervention is in contrast to one previous study that
reported an elimination of MRBD during submaximal contractions of the extensor
communis digitorum performed after a prolonged maximal voluntary contraction of the
same muscle (Tecchio et al. 2006). However, this study lacked both a control session
and an objective measure of physical fatigue. In the current investigation, the presence
of fatigue throughout the post-intervention measurements was clearly demonstrated by
the ~30% decrease in MVF, which was not the case for the control session. Furthermore,
these authors (Tecchio et al. 2006) found agonist electromyography amplitude during
the submaximal contractions to be unaffected by the intervention, in contrast to the
widely documented increase in electromyography amplitude that occurs with fatigue
(Bigland-Ritchie et al. 1986; Dorfman et al. 1990).
In general, high amplitude beta oscillations are widely believed to reflect cortical
inhibition (Cassim et al. 2001; Gaetz et al. 2011). For example, blocking reuptake of the
inhibitory neurotransmitter gamma aminobutyric acid (GABA) via administration of
Tiagabine increases both baseline beta amplitude and MRBD (Muthukumaraswamy et
al. 2013). Administration of diazepam (a GABA-A receptor modulator) has also
indicated MRBD to be a GABA-A mediated process (Hall et al. 2011). Thus, the
MRBD likely reflects a removal of inhibition during movement planning and execution,
enabling a greater flexibility for local encoding processes within cellular assemblies
(Donner & Siegel 2011; Brookes et al. 2015). Furthermore, a task habituation effect of
attenuated MRBD has been found to occur during the early phases of task repetition
neurophysiological marker of early cortical reorganisation with task habituation (Pollok
et al. 2014). Therefore, the decrease in MRBD between pre- and post-intervention in the
control session of the current study adds to the weight of evidence that task habituation
attenuates MRBD and may reflect a reduction in the number of sensorimotor neural
populations recruited to perform a given task following habituation (Mancini et al.
2009). The current study also extends previous work by showing that this habituation
effect of attenuated MRBD was counteracted by the induction of physical fatigue.
Fatigue is known to induce an extensive range of neurophysiological adaptations (see
Gandevia 2001) including an increased corticospinal output to maintain a consistent
force output, and also induces extensive group III and IV afferent feedback in response
to metabolite accumulation (Taylor & Gandevia 2008). These adaptations may have
meant that, from a cortical perspective at least, the task of performing the prescribed
40%MVFb contractions remained unfamiliarised (i.e. participants effectively remained
non-habituated).
To the authors‟ knowledge, this was the first study to investigate the effect of physical
fatigue on PMBR. The results demonstrated that PMBR was augmented following the
fatigue intervention but not the control intervention. The increase in beta amplitude
following movement cessation is believed to reflect an active inhibition of the
sensorimotor networks recruited during the preparation and execution phases of motor
actions (Alegre et al. 2008; Solis-Escalante et al. 2012). Moreover, there is growing
evidence to suggest that beta modulations, and PMBR in particular, are related to
GABAergic inhibition. Specifically, the magnitude of PMBR has been shown to
correlate with individuals‟ GABA levels, measured using magnetic resonance
modulator indicated PMBR was a non-GABAA mediated process (Hall et al. 2011).
Therefore, a greater PMBR during fatigue might reflect a stronger GABAB-driven
inhibition of sensorimotor networks that were more highly activated/excited during
contraction; potentially due to increases in corticospinal output or somatosensory
processing (either directly or indirectly). For example, the magnitude of the PMBR may
be positively related to the number of motor units recruited during voluntary
contractions (Pfurtscheller et al. 1998; Fry et al. 2016), which is known to increase with
the development of fatigue (Bigland-Ritchie et al. 1986). Alternatively, Cassim et al.
(2001) proposed that movement-related somatosensory processing may be fundamental
to the engenderment of the PMBR, having observed a PMBR to be present following
passive finger movements but not active movements performed under ischaemic
deafferentation. Therefore, increased activity of fatigue sensitive afferents may also
have contributed to the larger PMBR observed following the development of physical
fatigue.
That PMBR may be modulated by fatigue has wide implications for the measurement
and interpretation of this response. Recent work has demonstrated that PMBR has the potential to be used as a biomarker for pathology, with examples including Parkinson‟s
disease (Pollok et al. 2012; Heinrichs-Graham et al. 2014; Hall et al. 2014) and
schizophrenia (Robson et al. 2016). Judicious design of study protocols is therefore
essential to ensure the PMBR is not affected by the experimental procedures,
particularly when investigating disorders in which susceptibility to fatigue represents a
common symptom.
Resting beta amplitude at the locations of both MRBD and PMBR demonstrated similar
beta activity across the whole brain after a prolonged intensive cycling performance in
the heat; designed to induce supraspinal fatigue. Additionally, Jagannath &
Balasubramanian (2014) found widespread decreases in beta amplitude following a
monotonous 60-min simulated driving task, which was designed to induce mental
fatigue. In the present study, the decrease in resting beta amplitude following the
interventions was not specific to the fatigue session; however, other fatigue modalities,
such as mental fatigue arising from the prolonged periods of concentration and task
repetition, might have contributed to this beta decrease. While this reduction in baseline
beta activity may contributed to the observed changes in MRBD and PMBR, these
changes cannot completely explain the attenuated MRBD following the control
intervention and increased PMBR following the fatigue intervention (see Table 3).
Fatigue had no effect on either resting mu amplitude or MRMD, which were both
unchanged following both interventions. This indicated that mu activity within the
sensorimotor cortex was not affected by either the induction of physical fatigue, or the
prolonged period of task adherence involved in both experimental sessions.
In conclusion, this study revealed two novel findings regarding the effects of physical
fatigue on movement-related sensorimotor oscillatory dynamics. Firstly, physical
fatigue offsets the attenuation in MRBD observed with repetition of a motor task in a
non-fatiguing control session. Secondly, PMBR increased when submaximal
contractions were performed in a state of physical fatigue; which supports an emerging
theory that PMBR is sensitive to increases in corticospinal output and changes in
ACKNOWLEDGEMENTS
This work was funded by a Medical Research Council New Investigator Research Grant
(MR/M006301/1) awarded to MJB. AF was funded by a Loughborough University
Graduate School studentship. GCO is funded by an MRC studentship. KJM is funded
by an Anne McLaren Fellowship. We also acknowledge Medical Research Council
Partnership Grant (MR/K005464/1).
CONFLICTS OF INTEREST
There are no competing interests to declare.
REFERENCES
Alegre, M., Alvarez-Gerriko, I., Valencia, M., Iriarte, J. & Artieda, J. 2008. Oscillatory
changes related to the forced termination of a movement. Clin Neurophysiol 119,
290–300.
Benwell, N., Mastaglia, F. & Thickbroom, G. 2007. Changes in the functional MR
signal in motor and non-motor areas during intermittent fatiguing hand exercise.
Exp Brain Res 182, 93–97.
contractions. Acta Physiol Scand Suppl 556, 137–148.
Brookes, M., Hall, E., Robson, S., Price, D., Palaniyappan, L., Liddle, E., Liddle, P.,
Robinson, S. & Morris, P. 2015. Complexity measures in magnetoencephalography: Measuring “disorder” in schizophrenia. PLoS One 10,
e0120991.
Cassim, F., Monaca, C., Szurhaj, W., Bourriez, J.-L., Defebvre, L., Derambure, P. &
Guieu, J-D. 2001. Does post-movement beta synchronization reflect an idling
motor cortex? Neuroreport 12, 3859–3863.
Cheyne, D. 2013. MEG studies of sensorimotor rhythms: a review. Exp Neurol 245, 27–
39.
De Pauw, K., Roelands, B., Marusic, U., Tellez, H.F., Knaepen, K. & Meeusen, R. 2013.
Brain mapping after prolonged cycling and during recovery in the heat. J Appl
Physiol 115, 1324–1331.
Donner, T. & Siegel, M. 2011. A framework for local cortical oscillation patterns.
Trends Cogn Sci 15, 191–199.
Dorfman, L., Howard, J. & McGill, K. 1990. Triphasic behavioral response of motor
units to submaximal fatiguing exercise. Muscle and Nerve 13, 621–628.
Fry, A., Mullinger, K., O‟Neill, G., Barratt, E., Morris, P., Bauer, M., Folland, J. &
Brookes, M. 2016. Modulation of post-movement beta rebound by contraction
force and rate of force development. Hum Brain Mapp doi:10.1002/hbm.23189
cortical oscillations to resting γ-aminobutyric acid (GABA) concentration.
Neuroimage 55, 616–621.
Gandevia, S. 2001. Spinal and supraspinal factors in human muscle fatigue. Physiol Rev
81, 1725–1789.
Hall, S., Prokic, E., McAllister, C., Ronnqvist, K., Williams, A., Yamawaki, N., Witton,
C., Woodhall, G. & Stanford, I. 2014. GABA-mediated changes in
inter-hemispheric beta frequency activity in early-stage Parkinson‟s disease.
Neuroscience 281, 68–76.
Hall, S., Stanford, I., Yamawaki, N., Mcallister, C., Rönnqvist, K., Woodhall, G. &
Furlong, P. 2011. The role of GABAergic modulation in motor function related
neuronal network activity. Neuroimage 56, 1506–1510.
Heinrichs-Graham, E., Wilson, T., Santamaria, P., Heithoff, S., Torres-Russotto, D.,
Hutter-Saunders, J., Estes, K., Meza, J., Mosley, R. & Gendelman, H. 2014.
Neuromagnetic evidence of abnormal movement-related beta desynchronization in Parkinson‟s disease. Cereb Cortex 24, 1–10.
Huang, M., Mosher, J. & Leahy, R. 1999. A sensor-weighted overlapping-sphere head
model and exhaustive head model comparison for MEG. Phys Med Biol 44, 423–
440.
Jagannath, M. & Balasubramanian, V. 2014. Assessment of early onset of driver fatigue
using multimodal fatigue measures in a static simulator. Appl Ergon 45, 1140–
1147.
movement upon the electrical activity of the precentral gyrus. Arch für Psychiatr
und Zeitschrift Neurol 183, 163–174.
Jurkiewicz, M., Gaetz, W., Bostan, A. & Cheyne, D. 2006. Post-movement beta
rebound is generated in motor cortex: Evidence from neuromagnetic recordings.
Neuroimage 32, 1281–1289.
Kranczioch, C., Athanassiou, S., Shen, S., Gao, G. & Sterr, A. 2008. Short-term
learning of a visually guided power-grip task is associated with dynamic changes
in EEG oscillatory activity. Clin Neurophysiol 119, 1419–1430.
Lakens, D. 2013. Calculating and reporting effect sizes to facilitate cumulative science:
A practical primer for t-tests and ANOVAs. Frontiers in Psychology 4, 863.
Liu, J., Dai, T., Sahgal, V., Brown, R. & Yue, G. 2002. Nonlinear cortical modulation
of muscle fatigue: a functional MRI study. Brain Res 957, 320–329.
Liu, J.Z., Shan, Z.Y., Zhang, L.D., Sahgal, V., Brown, R.W. & Yue, G.H. 2003. Human
brain activation during sustained and intermittent submaximal fatigue muscle
contractions: an FMRI study. J Neurophysiol 90, 300–312.
Mancini, L., Ciccarelli, O., Manfredonia, F., Thornton, J., Agosta, F., Barkhof, F.,
Beckmann, C., De Stefano, N., Enzinger, C., Fazekas, F., Filippi, M., Gass, A.,
Hirsch, J., Johansen-Berg, H., Kappos, L., Korteweg, T. et al. 2009. Short-term
adaptation to a simple motor task: A physiological process preserved in multiple
sclerosis. Neuroimage 45, 500–511.
Muthukumaraswamy, S., Myers, J., Wilson, S., Nutt, D., Lingford-Hughes, A., Singh,
movement-related network oscillations. Neuroimage 66, 36–41.
Pfurtscheller, G., Graimann, B., Huggins, J., Levine, S. & Schuh, L. 2003.
Spatiotemporal patterns of beta desynchronization and gamma synchronization in
corticographic data during self-paced movement. Clin Neurophysiol 114, 1226–
1236.
Pfurtscheller, G. & Solis-Escalante, T. 2009. Could the beta rebound in the EEG be
suitable to realize a “brain switch”? Clin Neurophysiol 120, 24–29.
Pfurtscheller, G., Stancák, A. & Neuper, C. 1996. Post-movement beta synchronization.
A correlate of an idling motor area? Electroencephalogr Clin Neurophysiol 98,
281–293.
Pfurtscheller, G., Zalaudek, K. & Neuper, C. 1998. Event-related beta synchronization
after wrist, finger and thumb movement. Electroencephalogr Clin Neurophysiol
109, 154–160.
Pollok, B., Krause, V., Martsch, W., Wach, C., Schnitzler, A. & Südmeyer, M. 2012.
Motor-cortical oscillations in early stages of Parkinson‟s disease. J Physiol 590,
3203–3012.
Pollok, B., Latz, D., Krause, V., Butz, M. & Schnitzler, A. 2014. Changes of
motor-cortical oscillations associated with motor learning. Neuroscience 275, 47–53.
Robson, S., Brookes, M., Hall, E., Palaniyappan, L., Kumar, J., Skelton, M.,
Christodoulou, N., Qureshi, A., Jan, F., Katshu, M., Liddle, E., Liddle, P. & Morris,
P. 2016. Abnormal visuomotor processing in schizophrenia. NeuroImage Clin
Salmelin, R. & Hari, R. 1994. Spatiotemporal characteristics of sensorimotor
neuromagnetic rhythms related to thumb movement. Neuroscience 60, 537–550.
Sarvas, J. 1987. Basic mathematical and electromagnetic concepts of the biomagnetic
inverse problem. Phys Med Biol 32, 11–22.
Smith, J., Martin, P., Gandevia, S. & Taylor, J. 2007. Sustained contraction at very low
forces produces prominent supraspinal fatigue in human elbow flexor muscles. J
Appl Physiol 103, 560–568.
Solis-Escalante, T., Müller-Putz, G., Pfurtscheller, G. & Neuper, C. 2012. Cue-induced
beta rebound during withholding of overt and covert foot movement. Clin
Neurophysiol 123, 1182–1190.
Steens, A., Heersema, D., Maurits, N., Renken, R. & Zijdewind, I. 2012. Mechanisms
underlying muscle fatigue differ between multiple sclerosis patients and controls: a
combined electrophysiological and neuroimaging study. Neuroimage 59, 3110–
3118.
Studer, B., Koeneke, S., Blum, J. & Jäncke, L. 2010. The effects of practice distribution
upon the regional oscillatory activity in visuomotor learning. Behav Brain Funct 6,
8.
Taylor, J., Gandevia, S., 2008. A comparison of central aspects of fatigue in
submaximal and maximal voluntary contractions. J Appl Physiol 104, 542–550.
Taylor, J., Todd, G. & Gandevia, S. 2006. Evidence for a supraspinal contribution to
Tecchio, F., Porcaro, C., Zappasodi, F., Pesenti, A., Ercolani, M. & Rossini, P. 2006.
Cortical short-term fatigue effects assessed via rhythmic brain-muscle coherence.
Exp Brain Res 174, 144–151.
van Duinen, H., Renken, R., Maurits, N. & Zijdewind, I. 2007. Effects of motor fatigue
on human brain activity, an fMRI study. Neuroimage 35, 1438–1449.
Vrba, J. & Robinson, S. 2001. Signal processing in magnetoencephalography. Methods
Table 1. Actual wrist flexion force during the test contractions at a target force of
40%MVFb. „Pre‟/„Post‟: pre-/post-intervention. Steadiness: within participant standard
deviation. Data are group means ± SEM (n=11).
Control Session Fatigue Session
Pre Post Pre Post
Force (%MVFb) 40.00 ± 0.17 40.05 ± 0.15 39.87 ± 0.15 39.80 ± 0.18
Steadiness (%MVFb) 0.95 ± 0.06 0.99 ± 0.08 1.01 ± 0.08 1.12 ± 0.10
Table 2. Average MNI coordinates and the most likely cortical locations (according to
the Oxford-Harvard brain atlas) of MRMD, MRBD and PMBR. Data are group means ±
SEM (beta, n=10; mu and PMBR, n=9).
MNI coordinates
Cortical Location
x y z
MRMD -41.9±1.7 -30.6±2.0 54.0±1.4 postcentral gyrus
MRBD -37.7±0.8 -24.2±1.8 53.7±1.3 postcentral gyrus
PMBR -33.4±1.8 -21.8±2.1 58.1±1.8 precentral gyrus
Table 3. MRMD, MRBD and PMBR expressed as a percentage change relative to
Relative Amplitude
Loss/Increase
(% resting amplitude)
Control Session Fatigue Session
Session ×
time-point
interaction
(P value)
Pre Post Pre Post
MRMD -32.2 ± 1.4 -28.7 ± 1.2 -30.4 ± 1.7 -33.2 ± 1.7 0.215
MRBD -41.1 ± 1.0 -31.9 ± 1.1 -34.9 ± 0.9 -36.4 ± 0.9 0.005
Figure 1. Experiment overview: (a) A participant seated within the MEG scanner. (b) A
forearm positioned within the isometric wrist-flexion dynamometer (white arrow
profile with the real-time visual feedback of the performed contraction force overlaid. (d)
A schematic of the experimental protocol. The intervention involved 40 contractions at
either 5%MVFb (control intervention) or 55%MVFb (fatigue intervention; illustrated in
the schematic). The same 14 test contractions were repeated pre- and post-intervention.
(e) The data measurement periods (blue annotations) during and after the 40%MVFb
test contractions.
Figure 2. Maximum voluntary force (as an index of physical fatigue) at four time-points
throughout the experimental sessions. ‡ = significant difference between sessions
Figure 3. (a) Locations of peak MRMD during the 40%MVFb test contractions for each
individual participant (blue dots). (b) Absolute mu amplitude at location of peak
MRMD during baseline period (20-25 s following contraction onset). (c)
Time-frequency spectrograms extracted from locations of peak MRMD, showing task-related
change from baseline oscillatory amplitude. (d) Average MRMD (1.5-6.5 s following
Figure 4. (a) Locations of peak MRBD during the 40%MVFb test contractions for each
individual participant (blue dots). (b) Absolute beta amplitude at location of peak
MRBD during baseline period (20-25 s following contraction onset). (c)
Time-frequency spectrograms extracted from locations of peak MRBD, showing task-related
change from baseline oscillatory amplitude. (d) Average MRBD (1.5-6.5 s following
contraction onset). * = Significant session × time-point interaction (P<0.05). Data are
Figure 5. (a) Locations of peak PMBR following the 40%MVFb test contractions for
each individual participant (blue dots). (b) Absolute beta amplitude at location of peak
PMBR during baseline period (20-25 s following contraction onset). (c) Time-frequency
spectrograms extracted from locations of peak PMBR, showing task-related change
from baseline oscillatory amplitude. (d) Total PMBR amplitude (0-10 s following
contraction offset). * = Significant session × time-point interaction (P<0.05). Data are