A Dissertation on
“A STUDY OF ESTIMATION OF DEPRESSION AND ANXIETY
IN CHRONIC MEDICAL ILLNESSES- TYPE 2 DIABETES
MELLITUS, SYSTEMIC HYPERTENSION AND CHRONIC
OBSTRUCTIVE PULMONARY DISEASE”
Submitted to
THE TAMILNADU DR. M.G.R. MEDICAL UNIVERSITY
In partial fulfillment of the requirements
f
or the award of degree of
M.D.
(
PSYCHIATRY)
(Branch-XVIII
)
GOVERNMENT STANLEY MEDICAL COLLEGE &
HOSPITAL,
THE TAMILNADU DR. M.G.R. MEDICAL UNIVERSITY,
CHENNAI, TAMILNADU.
CERTIFICATE
This is to certify that this dissertation entitled “A STUDY OF
ESTIMATION OF DEPRESSION AND ANXIETY IN CHRONIC
MEDICAL ILLNESSES- TYPE 2 DIABETES MELLITUS,
SYSTEMIC HYPERTENSION AND CHRONIC OBSTRUCTIVE
PULMONARY DISEASE” submitted by Dr. JEYAPRAKASH J to the
faculty of PSYCHIATRY, The Tamil Nadu Dr. M.G.R. Medical University,
Chennai, in partial fulfillment of the requirements in the award of degree of
M.D.(PSYCHIATRY) Branch-XVIII for the April 2016 examination is a
bonafide research work carried out by him during the period of
FEBRUARY 2015 to JULY 2015 at Government Stanley Medical
College & Hospital, Chennai, under our direct supervision and guidance of
Prof. Dr. W.J.ALEXANDER GNANADURAI., M.D., DPM., Department
of Psychiatry at Government Stanley Medical College, Chennai.
Prof. Dr. W.J.ALEXANDER GNANADURAI.,M.D., DPM.
Professor and Head of the Department, Department of Psychiatry,
Government Stanley Medical College and Hospital, Chennai – 600 001.
Dr. ISAAC CHRISTIAN MOSES. M.D., FICP., FACP
DEAN
CERTIFICATE
This is to certify that this dissertation entitled “A STUDY OF
ESTIMATION OF DEPRESSION AND ANXIETY IN CHRONIC
MEDICAL ILLNESSES – TYPE 2 DIABETES MELLITUS,
SYSTEMIC HYPERTENSION AND CHRONIC OBSTRUCTIVE
PULMONARY DISEASE” submitted by Dr. JEYAPRAKASH J is an
original work done in the Department of Psychiatry, Government Stanley
Medical College and hospital, Chennai in partial fulfillment of regulations of
The Tamil Nadu Dr.M.G.R. Medical University, for the award of degree of
M.D. (PSYCHIATRY) Branch – XVIII, under my supervision during the
academic period 2013-2016.
Prof. Dr.W.J.ALEXANDER GNANADURAI M.D., DPM.
Professor and Head of the department, Department of Psychiatry,
Government Stanley Medical College & Hospital, Chennai - 600001.
DECLARATION
I, Dr. JEYAPRAKASH J, solemnly declare that the dissertation
“A STUDY OF ESTIMATION OF DEPRESSION AND ANXIETY IN
CHRONIC MEDICAL ILLNESSES – TYPE 2 DIABETES MELLITUS,
SYSTEMIC HYPERTENSION AND CHRONIC OBSTRUCTIVE
PULMONARY DISEASE” is a bona- fide work done by me during
the period of February 2015 to July 2015 at Government Stanley
Medical College and Hospital, under the expert supervision of
Prof. Dr. W.J.ALEXANDER GNANADURAI. M.D, D.P.M., Professor
and Head of the Department of Psychiatry, Government Stanley Medical
College, Chennai. This thesis is submitted to The Tamil Nadu Dr .M.G.R.
Medical University in partial fulfillment of the rules and regulations for the
M.D. degree examinations in Psychiatry to be held in April 2016.
ACKNOWLEDGEMENT
I wish to thank Dr. ISAAC CHRISTIAN MOSES MD., Dean,
Stanley Medical College and Hospital, Chennai for permitting me to carry out
this study.
With sincere gratitude, I wish to acknowledge the expert guidance and
suggestions of my Professor Dr .W.J.ALEXANDER GNANADURAI MD.,
DPM. without whose guidance this study would not have been possible.
I wish to thank Associate Professor Dr. R.SARAVANA JOTHI MD.,
Department of Psychiatry, Stanley Medical College, Chennai for the able
guidance, constant inspiration and continuous encouragement rendered at
every stage of this study.
I am deeply indebted to and highly grateful to Dr. M. MOHAMED
ILYAS RAHMATULLAH., MD., DPM, and Dr. HARIHARAN MD.,
Assistant Professors, Department of Psychiatry, Stanley Medical College,
without whom this work would not be in the present shape.
I am highly grateful to my co-guides Dr. SUBHASHREE..S,
MD.,Dip.Diab. ,Department of Diabetology, Dr.JAYANTHI.R MD.,
Department of General medicine and Dr.SRIDHAR.R MD., Department of
Chest medicine for their permission and guidance in the completion of my
dissertation.
I wish to thank all my co-post graduates for helping me in this work.
I gratefully acknowledge all patients and participants who gave their consent
CONTENTS
S.NO TITLE PAGE NO
1. INTRODUCTION 1
2. REVIEW OF LITERATURE 10
3. AIMS AND OBJECTIVES 32
4. MATERIALS AND METHODS 33
5. OBSERVATION AND RESULTS 39
6. DISCUSSION 76
7. CONCLUSION 79
8. LIMITATIONS 81
9. RECOMMENDATIONS 82
ANNEXURES
BIBLIOGRAPHY
PRO-FORMA
SCALES
TABLES
S.NO TITLE PAGE NO.
1 MARITAL STATUS OF PARTICIPANTS 44
2 EDUCATION DISTRIBUTION 46
3 OCCUPATION DISTRIBUTION 48
4 SALARY DISTRIBUTION 50
5 DURATION OF ILLNESS DISTRIBUTION 53
6 DISTRIBUTION OF HOSPITALIZATION 56
7 DISTRIBUTION OF ANXIETY 60
8 RELATIONSHIP BETWEEN GENDER & DEPRESSION
61
9 RELATIONSHIP BETWEEN DEPRESSION AND DM,SHT & COPD
62
10 CHI-SQUARE TEST FOR INDEPENDENCE DEPRESSON AND DM,SHT & COPD
63
11 COMPARISON OF DEPRESSION AMONG THREE GROUPS
64
12 MULTIPLE COMPARISONS OF BDI SCORES 65
13 COMPARISON OF ANXIETY AMONG THREE GROUPS
66
14 MULTIPLE COMPARISONS OF HAM-A SCORES
67
15 COMPARISON OF DEPRESSION AND DURATION OF ILLNESS
S.NO TITLE PAGE NO.
16 COMPARISON OF DEPRESSION AND HOSPITAL STAY
69
17 COMPARISON OF DEPRESSION AND MEDICATION ADHERENCE
70
18 COMPARISON OF DEPRESSION AND PRESENCE OF COMPLICATIONS
71
19 COMPARISON OF ANXIETY AND DURATION OF ILLNESS
72
20 COMPARISON OF ANXIETY AND PRESENCE OF COMPLICATIONS
73
21 COMPARISON OF ANXIETY AND HOSPITAL STAY
74
22 COMPARISON OF DEPRESSION AND MEDICATION ADHERENCE
GRAPHS
S.NO GRAPHS PAGE NO
1 AGE DISTRIBUTION 39
2 SEX DISTRIBUTION 40
3 RELIGION DISTRIBUTION 41
4 FAMILY TYPE DISTRIBUTION 42
5 DOMICILE OF STUDY GROUPS 43
6 MARITAL STATUS 44
7 EDUCATION DISTRIBUTION 45
8 OCCUPATION DISTRIBUTION 47
9 SALARY DISTRIBUTION 49
10 SOCIO ECONOMIC STATUS 51
11 DURATION OF ILLNESS 52
12 PRESENCE OF COMPLICATIONS 54
13 NUMBER OF HOSPITALIZATIONS 55
14 ADHERENCE OF MEDICATION 57
15 DISTRIBUTION OF DEPRESSION 58
INTRODUCTION
Chronic illnesses are non-communicable illnesses that last for a very
long time, usually do not resolve spontaneously and rarely cured completely.
These illnesses are the foremost causes of disability and death among the
most treatable and preventable of all health related problems. Chronic
diseases include illness such as heart diseases, diabetes mellitus, systemic
hypertension, cancer , chronic obstructive lung disease, epilepsy and arthritis.
Mental health illnesses are medical conditions that disrupt a person's
emotions, thinking, behavior, mood, self care, interpersonal relationship and
daily functioning. They are medical conditions that often result in a reduced
capability to cope with the routine daily activities.
The relationship between mental health illnesses and chronic physical
conditions are significant. Regardless of etiology, chronic illnesses and
mental health illnesses are treatable and both the conditions are common and
disabling among general population. Individuals with chronic medical
illnesses have increased risk for mental illnesses such as depression and
anxiety as compared to the physically healthy people. Mental health care
priorities need to be focused attention from psychotic disorders to common
mental illnesses like depression and anxiety disorders, which are also
The prevalence rates of depression and anxiety not only vary among the
general population but also vary in the same population from time to time.
Depression and anxiety have been reported to be associated with chronic
medical illnesses.1 The odds for a specific mental health disorder (mostly depression) are increased with systemic hypertension (Wells et al., 1989),
chronic pulmonary diseases ( Wells et al., 1988 ; Ede, Ijzermans & Brouwer,
1999) and diabetes (Anderson, Freedland, Clouse, & Lustman, 2001;
Garvard, Lustman, & Clouse, 1993; Popkin, Callies, Lentz, Colon, &
Sutherland, 1988; Lustman & Clouse, Griffith, Carney, & Freedland, 1997) .
Depression and anxiety caused by chronic diseases often make the
condition worse. When depression or anxiety is comorbid with any of
chronic medical disorders, there is additive functional impairment and
increase in the symptom burden which leads to increase in medical costs and
to impair adherence , functioning , self care and quality of life.2 Depression,
in particular, is associated with worse functional outcomes for patients with
chronic physical illnesses. Comorbid depression and anxiety is a risk factor
for increased severity of the chronic illness because of non-adherence with the
treatment and related complications and is also associated with increased
frequency of hospitalizations, increased morbidity and increased mortality.
The associated depression and anxiety in chronic medical illnesses
like diabetes mellitus, systemic hypertension and chronic obstructive
(i) economic issues as they cause higher health care costs in chronic
physical illnesses.
(ii) maladaptive effects on chronic illnesses like amplification of
symptoms burden, increased adverse health behaviors, decreased
self-care and decreased adherence to medical regimens by adversely
influencing expectations and benefits about efficacy of treatment
(iii) Morbidity and mortality and
(iv) Treatment implications.
So, the prompt diagnosis of depression and anxiety in chronic diseases
is mandatory in optimizing the management and in understanding the cause
of the illness.
Diabetes mellitus is a syndrome of disordered metabolism, usually due
to a combination of genetic and socio-environmental causes, due to defects in
either insulin secretion or insulin action resulting in abnormally high blood
sugar levels. Diabetes is a chronic medical illness which needs lifelong
treatment either with dietary modifications or medication , in order to prevent
or manage its complications.
According to International Diabetes Federation (IDF), India has the
largest number of diabetic patients globally, and now, the number of diabetic
69.9 million diabetic population in India by 2025. (Diabetes Atlas – 6th
edition). India is the leading country in having highest number of diabetic
patients among world population and so it is being termed as the “diabetes
capital of the world”.
In India, there have been consistent reports of differences in the
prevalence of diabetes mellitus between urban and rural population. The
ICMR study reported that the prevalence of diabetes in urban areas was 2.1
per cent and in rural areas was 1.5 per cent, where as an another study showed
that threefold increase in prevalence of diabetes among urban population
(8.2 % ) than the rural population (2.4%).
According to the WHO-ICMR national NCD (Non Communicable
Diseases) risk factor surveillance at 2006, a surveillance was conducted in 5
States of India, in a different geographical locations (which includes northern,
southern, eastern and western/central India) and it indicated that the
prevalence of diabetes were 7.3% among urban people, 3.2% among by
peri-urban area and 3.1% among rural population.3
The Chennai Urban Rural Epidemiology Study (CURES) reported that
the prevalence of Impaired Glucose Tolerance was 10.6 % (age -
standardized: 10.2%) and that of diabetes mellitus was 15.5 % (age -
standardized: 14.3%). Between the period of 1989- 1995 , the prevalence of
and in between period of 1995 - 2000 the prevalence rate increased by
16.3 % (From 11.6% to 13.5%) and between the period of 2000 - 2004, the
prevalence rate further increased to 6.0% (From 13.5% to 14.3%). These
results show that in Chennai itself within the period of 14 years, the
prevalence of diabetes mellitus increased markedly to 72.3%.4
In clinical practice, identification of psychiatric co-morbidity like
depression and anxiety in diabetes is often overlooked for a variety of
reasons : societal disapproval of psychiatric illness, complicity between
physicians and patients not to discuss psychiatric symptoms, and wrongly
considering co morbid depression and anxiety as a ‘ normal consequence of
difficult medical illness’.5
The comorbid depression or anxiety associated with diabetes can
worsen the clinical outcome of the disease and it may be due to the fact that
depression and anxiety would affect the treatment adherence and self care
regimes of the patients. Similarly, uncontrolled diabetic status might lead to
or aggravate depression and anxiety and it is due to the effects of diabetes
over the central nervous system functions directly or through its indirect
effects on complications , functional impairment or decreased quality of life.
Among South Asian population, Systemic hypertension emerges as the
third leading risk factor for disease burden.6 Hypertension (HTN) evolves as
hypertension is the important causative factor for 24% of all deaths due to
coronary heart disease (CHD) and 57% of deaths due to stroke in India.8
According to WHO reports, systemic hypertension is one among the risk
factor in premature deaths worldwide .9
According to worldwide data analysis of the global burden of
hypertension, 20.6% of men and 20.9% of women in India were found to
have hypertension, in 2005.10 The percentage of hypertension may increase
up to 22.9 for men and 23.6 for women in India by 2025.11 The prevalence
of hypertension is 25% in urban areas and 10% in rural people in India.12
According to the WHO (2008), the prevalence of systemic hypertension in
India was 32.5% (33.2% in men and 31.7% in women)
Among hypertensive patients all over the world, 17.8% of them reside in
India as per Global Burden of Hypertension (2005),11 the Global Burden
Diseases (2010) study6 and WHO (2011) NCD India specific data. The
prevalence of hypertension was increased multiple folds from 13.9 to 46.3%
in urban population and from 4.5 to 58.8% in rural areas which was reported
in a review study of studies published between 1969 and July 2011.13.
One-third of urban adult Indians and close to one fourth of rural adult Indians are
hypertensive. Hypertension was estimated to be 20% among adults population
Because hypertension is one among the most prevailing chronic
conditions, it is necessary to investigate the prevalence of anxiety and
depression in these patients. There is strong evidence that the co morbidity
between systemic hypertension and mental illness is very high. The
relationship between systemic hypertension and depressive symptoms is a
complex issue. The course of the hypertension can be negatively affected
and greatly influenced by depression and anxiety. The sympathetic nervous
system over activity and genetic predisposition are the underlying
mechanisms in explaining the co morbidity of depression and systemic
hypertension.
Chronic obstructive pulmonary disease (COPD) is the fourth leading
cause of death worldwide and a major cause of chronic morbidity and
mortality throughout the world.15 COPD includes diseases that were
previously known as chronic bronchitis and emphysema.
The British Medical Research Council (BMRC) defined chronic
bronchitis as “daily productive cough for at least three consecutive months for
more than two successive years. The definition of emphysema put forth by the
National Heart, Lung and Blood Institute in 1984 is as “a condition of the
lung characterized by abnormal, permanent enlargement of airspaces distal to
the terminal bronchiole, accompanied by the destruction of their walls, and
without obvious fibrosis”. COPD has abnormalities of both airway and
recently defined COPD as “a common preventable and treatable disease
characterized by persistent airflow limitation that is usually progressive and
associated with an enhanced chronic inflammatory response in the airways
and the lung to noxious particles or gases.
The prevalence of COPD varies widely across countries and this
variation is due to the method of classification and diagnosis of COPD. The
global prevalence of physiologically defined chronic obstructive pulmonary
disease (GOLD stage 2 or more) in adults aged ≥40 yr is approximately 9-10
percent.16 The overall prevalence of COPD of GOLD stage II or higher was
10.1 per cent and the prevalence was 11.8 per cent for men and 8.5 per cent
for women (The Burden of Obstructive Lung Disease (BOLD) study).17
The prevalence of COPD was 3.36 per cent in males and 2.54 per cent
in females in a study. 18. The prevalence in New Delhi in 1977 was 8.1 per
cent in men and 4.6 per cent in women19 and the prevalence was 3.9 per cent
in women and 6.2 per cent in men in rural area, and 1.6 and 4.2 per cent,
respectively in urban area in 1993.20 The prevalence of COPD is 1.9 per cent
in males and 1.2 per cent in females in Chennai.21. Ray et al in 1995 found
that the prevalence of COPD was 4.08 per cent in males and 2.55 per cent in
females from south India. There are wide variations in the prevalence of
Anxiety and depression are highly prevalent co morbidities in Chronic
obstructive pulmonary disease.23 Investigating depression and anxiety in
COPD is difficult due to the variability in presentation and the significant
overlap of symptoms between COPD, depression and anxiety and the
subjective nature of the diagnostic process.24 The anxiety and depression in COPD were associated with poor course of the disease, poor quality of life
and increased burden of symptoms , health-care utilities, and even mortality.25
The psychiatric symptoms themselves can be aggravated by patients’
disabilities and, in turn, they can magnify patients’ COPD symptoms. Thus,
detecting depression or anxiety in COPD patients is of great importance.
Considering all the above factors it is necessary to study the prevalence
of psychiatric co morbidities of depression and anxiety in chronic illnesses
like Diabetes mellitus, Systemic hypertension and Chronic obstructive lung
REVIEW OF
REVIEW OF LITERATURE
DEPRESSION: A VIGNETTE
According to ICD – 10, an individual is said to be in depression either
mild, moderate or severe who usually suffers with typical symptoms of
depressed mood, loss of interest and decreased energy that may lead to
increased fatigability and decreased activity.
The various other symptoms are
(1) Decreased attention and concentration,
(2) Decreased self – esteem and self – confidence,
(3) Guilty feelings and worthlessness
(4) Negative view about the future,
(5) Self – harm or suicidal thoughts,
(6) Sleep disturbances,
(7) Lack of appetite.
Depression can be categorized in to mild, moderate and severe,
according to the number of typical symptoms and the various other
about 2 weeks and cause significant impairment in social and occupational
functioning.
Depression can occur alone or as a part of Bipolar disorder. If it occurs
alone, then it is known as Unipolar depression. Depression is more common
in women than men with the ratio of 2 : 1. At least 25 % of the patients had
one or more precipitating events. There is also a diurnal variation in the
symptoms: the symptoms worse in the morning. Approximately 75% of
depressed patients experienced sleep disturbances, either insomnia or
hypersomnia. About 60 % of the depressed patients have suicidal ideation and
15% commit suicide.
ANXIETY: A VIGNETTE
Most of us have experienced the anxiety symptoms but for a definite
diagnosis, it should be clinically significant, must be severe enough to cause
significant distress, and / or it must be markedly interfere our day–to–day
lives and socio occupational functioning.
Anxiety is a state which has many effects. It influences the cognition
and produces the perceptual distortions. There is a difference between fear
and anxiety. In fear, there is an appropriate response to a known threatening
stimuli, where as in anxiety there is also a response to a threat which is not
Most of the symptoms of anxiety are dreadful which are accompanied
with somatic complaints and autonomous nervous system hyperactivity such
as tachycardia, palpitation, sweating, dry mouth, etc.,. Anxiety accompanies
with psychological symptoms such as feeling of dread, difficulty in
concentration, insomnia, decreased libido, lump in the throat (Globus
Hystericus ) and stomach upset (Butter flies).
DSM-IV eliminated the term “Neurosis” in its diagnostic manual, but
still it is retained in the ICD – 10, as Neurotic, stress related and somatoform
disorders (F 40 – F 48). It may be convenient to divide the anxiety and stress
related disorders in to 3 categories, because of the acceptable quality of the
symptoms in each category.
1. The common neuroses:
Anxiety / Panic disorders; e.g. Panic disorder,
Agoraphobia,
Generalized Anxiety Disorder,
Specific Phobia,
Social Phobia,
Hypochondriasis.
(Illness anxiety disorder in DSM 5)
Adjustment disorders,
Post Traumatic Stress Disorder (PTSD).
Obsessive compulsive disorders (Separate entity in DSM – 5)
2. The Unusual Neuroses:
Anxiety / Phobic disorders e.g. “ non – understandable” phobias
Dysmorphophobia.
Hysterical conversion disorder,
Dissociation /Depersonalization – Derealization disorders,
Somatoform disorders.
3. “Culture specific” disorders:
Chronic fatigue syndrome / Eating disorder,
Other “culture bound” disorders.
DEPRESSION IN DIABETES MELLITUS PATIENTS
According to the World Health Organization (WHO) , depression is a
significant health concern causing 12% total years lived with disability.
Approximately 43 million people worldwide with diabetes have symptoms of
depression.26. In people with diabetes, the prevalence of clinically relevant
depressive symptoms is between 26 – 31 % and that of major depression
Diabetes increases twice the prevalence of depression. These increased
rates of depression among diabetic population have been confirmed in
multiple studies28 in South Asia. The earlier hypothesis observed that
depression in diabetes may be the result of psychosocial stress of having a
chronic illness29. Another hypothesis also known as the common soil hypothesis posits that association between depression and diabetes results
from factors affecting both disorders.
Current research also supports a contribution of biological changes in
diabetes, such as functional, structural and neurochemical changes in the brain
regions responsible for the affect and cognition in both type 1 and type 2
diabetes that may increase the risk of depression. 30
Depression in diabetes is persistent and /or recurrent. In longitudinal
and follow up studies, the rates of depression persistence or recurrence have
been reported to range widely, between 11.6 % and 92 %, depending on
sample sizes, diagnostic criteria of depression and depression classification.
PREVALENCE OF DEPRESSION IN TYPE 2 DIABETES MELLITUS
CONTROLLED STUDIES:
Controlled studies which have used the control groups may allow us
for better comparisons. In a meta – analysis study by Ali S et al in 2006 31, 10 controlled studies including 7 community based studies ( Palinkar et al,
Black et al,1999; Gregg et al, 2000; Pouwer et al, 2003), 2 primary care based
studies ( Janet Thomas et al,2003; Nicolas et al,2003) and 1 secondary care
based study (Saeed and Al-Dabbagh et al, 2003) were reviewed. Various
assessment scales were used in these studies. BDI – Beck Depression
Inventory, a self report questionnaire used in Palinkar et al, 1991, CES-D
(Centre for Epidemiological Studies for Depression) Scale was used in Black
et al, 1999; and Pouwer et al, 2003.
This meta-analysis review inferred the prevalence of depression among
type 2 diabetes mellitus patients when compare with non diabetic individuals.
(Odds Ratio; 1.77, 95% CI; 1.5 – 2.0). These findings were consistent when
the rates were determined by gender, sample source, depression assessment
methods and by geographical location. According to this meta-analysis, the
overall prevalence of depression among type 2 diabetic patients was 17.6%, in
which the female patients had a higher prevalence (23%) than male patients
(12.8%).
Anne Engum et al in 2005 32 conducted a large population study and
found that, the prevalence of depression among type 2 diabetic patients was
19% and in the non diabetic control groups the prevalence was 10%.
Shamsaeiet al in 2006 33conducted a study in Iran and found that mean Beck depression score among type 2 diabetic patients was more (18.6) than the non
diabetic control groups (9.1). Mary de Groot et al in 2007 34,conducted a
31% of the participants showed a clinically significant depression in Beck
Depression Inventory Scale.
UNCONTROLLED STUDIES:
In a meta - analysis study of Andersonet alin 2001 35; he reviewed 22 uncontrolled studies to estimate the prevalence of depression in diabetic
patients. According to this study the overall prevalence of depression among
diabetic patients was 29.7%. Among the 22 uncontrolled studies, 5 of them
(Biglan et al, Connellet al, Geringeret al, Marcus et al 36 and Nalibottet al )
evaluated the prevalence of depression in type 2 diabetic patients which
showed that the prevalence of depression in type 2 diabetic patients was
higher (Mean: 33.8%, Range: 18.8% - 47%) than the type 1 diabetic patients
(Mean: 21.2%, Range: 11.5% - 42.4%).
Among the 22 uncontrolled studies, 5 of them estimated the prevalence
of depression in male and female diabetic patients separately (Bailoy et al,
Haire – Joshu et al, Naliboff et al, Peyrotet al 37 and Slawsonet al) which
showed that the prevalence of depression was greater in females (33%) than
in males (20.7%).
In a recent study at Malaysia, Kurubaran Ganasegeranet al in 2014 38 demonstrated the factors connected with depression and anxiety among type 2
diabetic patients. They conducted a descriptive cross – sectional study in a
women, n=70), depression present in 68 patients (40.3%), and anxiety present
in 53 patients (31.4%). Multivariate analysis of this study shows that, the age
of onset, ethnicity, monthly income and the complications associated with
diabetes were significantly influenced the causation of both depression and
anxiety among the type 2 diabetic patients.
INDIAN STUDIES:
Poongothai S et al 39 and her colleagues at 2009, conducted a
population based study to estimate the prevalence of depression in an urban
south Indian population –Prevalence of depression was assessed by using
Patient Health Questionnaire (PHQ) - 12: a self – reported questionnaire, and
found that, the overall prevalence of depression was 15.1%, and the
prevalence of depression was higher in females (16.3%) than in males
(13.9%).
Chandranet alin 2002 40 conducted a study, to estimate prevalence of
depression among rural and low socio economic status women
(359 participants) and found that overall prevalence of depression among
them was 11%.
Biswaset al in 2009 41conducted a door to door survey to estimate the prevalence of depression in elderly individuals (204 participants) and found
Amit Raval et al in 201042, in Chandigarh, India conducted a study to
estimate the prevalence and determinants of depression among type 2 diabetic
patients and found that, among 300 type 2 diabetes mellitus patients (147
male patients and 153 female patients ), 68 patients (23%) had major
depression, 54 patients (18%) had moderate depression and 178 patients
(59%) had no clinically significant depression. They also found that the age of
onset, duration of diabetes, obesity, glycemic control and the diabetic
complications having an impact in the causation of depression in type 2
diabetic patients.
In a recent study of Nitin Joseph, Bhaskaran Unnikrishnan,
Y.P.Ragavendhra Babu M, Shashidhar Kotian, and Maria Nelliyanil et al
in 2013 43; they conducted a study to estimate the proportion and determinants of depression in type 2 diabetic patients in various tertiary care hospitals at
Mangalore, South India. Among the 230 type 2 diabetic patients (119 male
patients, 111 female patients), 71 patients (30.9%) met the criteria of
moderate depression, 33 patients (14.3%) met the criteria of severe depression
and the remaining126 patients did not have any clinically significant
depression. They also found that, the older age, low socio economic status,
female gender, unskilled & retired employment status, obesity, daily
medications and the complications of diabetes, were markedly associated with
PREVALENCE OF ANXIETY IN DIABETES MELLITUS:
Most of the studies in Diabetes focus on the psychiatric disturbance of
depression, where as only few studies demonstrated the anxiety disorders in
Diabetes mellitus patients.
Kaufmanet al 44 and Roy A et al, demonstrated that, the co - morbid Anxiety disorder with Diabetes lead to a symptom severity and persistence of
symptoms and greatly impair the individual role in the social and
occupational milieu.
Barker et al in 2008 demonstrated the association of anxiety disorders
in type 2 diabetes mellitus patients. In this study, a structured diagnostic
interview method like DIS – DSM IV (Diagnostic Interview Schedule for
DSM – IV) was used. They found that the overall life time prevalence of
anxiety disorder among diabetic patients was 19.5%, when compare to the
non – diabetic individuals (10.9%).
Grisby et al in 2001 45 conducted a systematic review on 18 studies
regarding the prevalence of anxiety disorders in an adult population with
diabetes. He found that, the symptoms of anxiety were present in about 40%
of the diabetic patients. He also found that there is an significantly elevated
anxiety symptoms present among female diabetic patients (55.3%) than the
male diabetic patients (32.9%) and there is an increased symptoms of anxiety
patients (41.3%). Among the 40% of diabetic patients presented with anxiety
symptoms, while applying definite diagnostic criteria only 14% of the
diabetic patients were qualified for the definite diagnosis of Anxiety
disorders.
Hermanns et al in 200546 carried out a study to estimate the prevalence of anxiety symptoms in a secondary care clinic and found that,
19.3% of the diabetic patients had anxiety symptoms and 5.9% of them were
fulfilling the criteria of anxiety disorders.
Lloydet al in 200047 demonstrated that 28% of the participants had
moderate to severe levels of anxiety or depression or both. Shaban et al in
2006, found that 36% of the study participants had anxiety symptoms, and
also found that, there is an elevated severe anxiety symptoms present among
female diabetic patients.
Janet Thomas et al in 200348, conducted a comparative study in a
primary care patients who were diagnosed as type 2 diabetes mellitus, to
evaluate the 12 months prevalence of depression and anxiety and found that
11.7% of the T2DM patients had anxiety disorders and 13% of the T2DM
patients had mixed anxiety and depression disorder. This study shows that,
type 2 diabetes mellitus increases the probability of acquiring anxiety
In a recent study, Carlos Tovilla-Zarate et al in 2012 49 conducted a
study to estimate the prevalence of anxiety and depression among T2DM
patients in an outpatient set up in the Mexican population. The prevalence of
anxiety was 55.10% (95% CI; 44.48 – 52.06) and also found that, occupation
and diabetic complication were the associating factor for anxiety in type 2
diabetic patients.
In a recent study at Malaysia, Kurubaran Ganasegeran et al in
201450, demonstrated the factors connected with depression and anxiety
among type 2 diabetic patients. They conducted a descriptive cross – sectional
study in a single centre and found that, among 169 T2DM patients (men,
n=99; women, n=70), anxiety present in 53 patients (31.4%). Multivariate
analysis of this study shows that, the age of onset, ethnicity, monthly income
and the complications associated with diabetes mellitus were significantly
associated with the causation of both depression and anxiety among the type 2
diabetic patients.
Khuwaja AK et al in 2010 51 conducted a multi – centre study at
Karachi, Pakistan, to evaluate the prevalence of anxiety and depression
among T2DM patients and found that, among the 889 participants 57.9% of
DEPRESSION AND ANXIETY IN SYSTEMIC HYPERTENSION
Systemic hypertension is one among the most commonly prevailing
chronic illnesses in the community and psychiatric co morbidities of
depression and anxiety are also more prevalent in hypertensive patients.
OVERACTIVE AUTONOMIC NERVOUS SYSTEM
Plenty of studies have been done and a theory has been propounded
with evidence that a possible overactive sympathetic response of the
autonomic nervous system and genetic involvement form the intrinsic
mechanisms which define a relation between hypertension and depression and
anxiety, in which depression largely has a negative influence on the course of
hypertension.52
The abnormality in the sympathetic division of the autonomic nervous
system in depressive patients, exclusively with regard to reduced vagal
control and an increase in sympathetic activity, has been evidenced by studies
which reported the presence of elevated levels of nor epinephrine and its
significant CNS metabolite 3-methoxy 4-hydroxyphenylglycol in plasma,
CSF and urine samples of depressive patients.53,54,55.
A distinctive reduced level of cholinergic outflow with increased
activity of the alpha and beta adrenergic systems was found to characterize
variability in heart rate suggesting a reduced activity of the parasympathetic
system and an over active sympathetic system in patients with depressive
disorder.56,57
It is possible that several other explanations may exist to define the
relation between blood pressure and depression with an overactive
sympathetic system not being the sole one; however it was proposed by
Seiver et al 58 that the increased understanding in the influences exerted by
neurotransmitter systems in mood disorders are possibly due to failure of the
regulation of the systems, and not just a simple decrease or increase in their
activity, and such dysfunction in the noradrenergic system regulation was
expected to negatively affect the individuals affective response to internal and
external stimuli.
Studies hypothesized a possible relation between depression and an
abnormality in the circadian regulation of blood pressure evidenced by the
depressive symptoms exhibited by 126 men, devoid of any psychiatric illness
and not on any medication, associated with an increased ratio of night/day
systolic blood pressure. Disturbances in the regulation of hormones and
dysfunction of the Autonomic Nervous System have been advocated as
explanations for the above results.59
A possible relation between hypertension and depressive
borderline hypertension, who demonstrated an increased range of scores in
negative affect post tasks.60.
A study conducted by Rabkin et al 61, evidenced the presence of a three
times higher rate of major depression in hypertensive patients and it was
attributed by elevated sympathetic tone and increased secretion of adreno
cortico tropic hormone and cortisol. In the study conducted over a period of 7
days in 54 subjects by monitoring their blood pressure ranges over a period of
24 hours each day, it was found that a positive relation existed between high
levels of diastolic (P=0.030) and systolic (P = 0.037) blood pressures and a
depressive mood .62
The genetic influences form an important etiology in mood disorders
was evidenced by several family, adoption and twin studies, with similar
others advocating a ‘shared genetic-vulnerability’ explanation to define the
association between hypertension and depressive disorders.
Increased levels of symptoms of depression was shown to exist with
higher risk of stroke in elderly hypertensive patients as evidenced by
epidemiological studies conducted to evaluate the longitudinal association
between stroke, cardiovascular related mortality, BP control and depressive
symptomatology in elderly patients, with such association especially in
women considered to be a function of BP control.63
Several studies advocated that depressed patients showed an increased
susceptivity to activation of platelets possibly being the intrinsic mechanism
involved in the higher risk of cerebrovascular disease , ischemic heart disease
and post myocardial infarction in such patients.64 . Another theory has been propounded based on the evidence offered by several brain imaging studies,
which demonstrated an increased rate of ischemic abnormalities in depressive
disorders occurring late in life, that hypertension could serve as a risk factor
in development of the same.65
Associations between hypertension and anxiety have been
hypothesized for decades. The possible relationship between hypertension and
anxiety are increased autonomic nervous system functions via
hypothalamic-pituitary axis and subsequent increase in circulating catecholamines. This
association holds across the spectrum of anxiety disorders. In hypertensive
patients , the outcome is negatively affected by anxiety. The underlying
mechanisms between negative effects of anxiety and hypertension and
cardiovascular diseases are possible arousal of sympathetic nervous system,
elevated inflammatory markers and defect in endothelial function .66
PREVALENCE OF DEPRESSION AND ANXIETY IN
HYPERTENSION
In a population-based estimation study conducted in sub-Saharan Africa,
8.1% and 4.9% were found to have a 12-month anxiety or depressive disorder
in hypertensive patients, respectively.( Grimsrud A et al).67
Scherrer et al,68 reported that there are common genetic and
environmental risk factors underlying hypertension , depressive symptoms
and heart disease. They conducted an association study with 6,903 male‐male
twins from the Vietnam Era Twin Registry and found that, of the total
variance in depression, 8% was common to hypertension and heart disease,
7% of the variance in hypertension was common with depressive symptoms
and heart disease, and 64% of the variance in heart disease was common with
depressive symptoms and hypertension and suggesting that there are common
genetic factors that predispose individuals to hypertension and depression
In a review study, Huapaya, L et al 69 revealed that many studies
indicated that the prevalence of depression is high in 37% in hypertensive
patients compared to a prevalence of 4–22% in the general population. In a
community based study in Hong Kong, they concluded that hypertension is
associated with anxiety but not depression. Vetere G et al 70 observed that
higher frequency of anxiety symptoms in hypertension than in the control
group (p <0.001) .
Wei and Wang 71 found that anxiety symptoms were prevalent in 12%
of known hypertensive patients. The occurrence and severity of Anxiety
and history of hospitalization in patients with hypertension. Thombre72 and
colleagues found that pre pregnancy depression or anxiety symptoms were
associated with hypertension during pregnancy.
DEPRESSION AND ANXIETY IN CHRONIC OBSTRUCTIVE
PULMONARY DISEASES
Chronic Obstructive Pulmonary Diseases are at an increased risk of
developing depression. It could be attributed to genetic vulnerability to mood
disorder, the environmental factors and the direct neuropsychiatric
consequences of chronic pulmonary diseases.
GENETIC FACTORS
This risk due to genetic vulnerability is validated by twin and adoption
studies. The twin studies infer a concordance rate of 50% in monozygotic
twins, 10%–25% in dizygotic (Kaplan and Sadock 1988; Kendler et al 2006;
Sullivan et al 2000). The risk of an adolescent in turning into chain smoker is
directly proportional to the number of each additional copy of an identified
allele (DRD2A1) for a subtype of a dopamine receptor and the depressive
symptoms are augmenting the effect.( Audrain-McGovern et al 2004).73
SOCIAL FACTORS
The depression in chronic medical illness leads to loss of functionality
impairments caused by depression include decline in daily activities,
difficulty in performing previous role in family, social and occupational life
and inability to follow their interests and hobbies. The social support available
to the patients will help them to cope with the stressful conditions due to
chronic diseases. Lesser the social support, the more is the patients’
vulnerability to depressive symptoms.. ( McCathie et al 2002)75. Loneliness, poor functionality and poor reversibility of FEV1 contributes to depression.
(van Manen et al 2002 ).76
NEUROPSYCHIATRIC FACTORS
The concentration of subcortical hyperintensities (SH) in MRI brain is
found to be associated with higher proportion in depression.77Videbech 1997
78 inferred in a meta-analysis that a common odds ratio for subcortical hyper
intensities and major depression was 3.2 (95% CI 2.11–4.82). There is strong
evidence of an association between subcortical hyperintensities and late-onset
depression, as well as between COPD and an increased severity of subcortical
hyperintensities (van Dijk et al 2004). 79 The accumulation of subcortical
hyperintensities would be due to the changes in microvasculature and
biochemical alteration by depression and COPD.
The biomarkers of oxidative damage are considerably elevated in
depression. A study by Forlenza and Miller 2006 80, showed a direct
depression and levels of oxidative stress with severity of depression.
Depressed mood is the sequelae of recurrent nocturnal hypoxaemia . In both
depression and COPD, micro vascular thrombosis are caused by more
pronounced platelet activation (Davi et al 1997).81
Anxiety is more commonly associated with COPD. The common
mechanisms underlying the high association of anxiety with Chronic
pulmonary obstructive disease include factors related to dyspnoea and
smoking.
Dyspnoea is the most distressing symptom in COPD patients.
Individuals with COPD experiencing severe dyspnoea are being associated
with anxious feelings and they describe anxiety features during disease
exacerbations. Furthermore, anger outbursts and frustration are triggering
factor for anxiety, which causes breathlessness. Therefore, it is very apparent
that the complex association between breathlessness and anxiety contribute
to the increased prevalent rate of anxiety symptoms in COPD.82
The variables associated with Depression and Anxiety in patients with
COPD are severe dyspnea , physical disability, presence of co morbidity ,
poor quality of life , living alone, percentage of predicted FEV1 < 50% ,
long-term oxygen therapy, female gender, current smoking and low social
PREVALENCE OF DEPRESSION AND ANXIETY IN COPD
In a case control study, Gehan Elassal et al83 found that in a sample of
80 patients, 55% of them have psychiatric illnesses and depression was found
to be around 42.5% in COPD patients and anxiety was found to be 22.5%
in COPD patients.
Light RW et al 84 found that there was significant correlation
between depression and anxiety scores and 42 % of the patients had
significant depression, while only 2 % of the patients had significant anxiety.
In a prevalence study of depression and anxiety in COPD patients,
Regvat et al85 found that 50% of the patients of COPD study group showed
anxiety and/or depression. In a similar study by D. Janssen et al 86 , the mean anxiety scores was 7.6 points and mean depression scores was 7.2 points , in a
study conducted with 701 patients.
K. Roundy at al 87 stated that depression and anxiety disorders are
recognized about 49 % of the patients in COPD in primary care setting. In a
Korean study, Y.Ryu et al 88 found patients with chronic respiratory diseases
have increased association for depression and anxiety particularly in those
having decreased lung function with airflow limitations. The incidence of
anxiety and depression symptoms is higher in COPD patients with more
In another study, depression and anxiety were more frequent in patients
with chronic bronchitis than those without chronic bronchitis and in female
gender and those having co morbidities. 90 In stable COPD, the prevalence of
clinical depression ranges between 10% and 42%, while that of anxiety ranges
between 10% and 19%.91 Depression occurs in 7 to 42% of patients with COPD, and a strong association was found between COPD and depression
which was evident from four controlled studies and three of six
non-controlled studies and it also revealed the prevalence of depression was high
in COPD compared with general population. 92
Multiple studies have found increased prevalence of depression in
patients with COPD than in control subjects. Yellowlees 93 found that 34% had an anxiety disorder and 16% had depression in a study with 50 inpatient
COPD patients. Dowson et al 94 found anxiety in 50% and depression in 28%
AIMS AND
AIMS AND OBJECTIVES
1) To estimate the prevalence of Depression and Anxiety in Type 2
Diabetes Mellitus, Systemic Hypertension and Chronic Obstructive
Lung Disease.
2) To understand Socio demographic characteristics of the patients with
DM, COPD, SHT and anxiety and depression.
3) To evaluate the difference between the presentation of anxiety and
depression in the study groups.
4) To compare the prevalence of depression and anxiety among patients
MATERIALS AND
MATERIALS AND METHODS
STUDY DESIGN
Cross sectional study with internal comparison
STUDY SETTING
The study was conducted at the Diabetology / Hypertension / Chest
diseases Out patient department at Government Stanley Medical College
Hospital, Chennai. It is a tertiary care teaching institute where patients come
from northern part of Chennai, Tiruvallur District and from southern districts
of Andhra Pradesh.
STUDY PERIOD
6 Months
STUDY POPULATION
The study population includes patients attending out - patients
department of Department of Diabetology / Systemic Hypertension OPD /
SUBJECTS OF STUDY
Group I
Diabetic patients who have been diagnosed and registered in
Department of Diabetology.
Group II
Patients who have been diagnosed as Hypertensive and registered in
Systemic Hypertension OPD
Group III
Patients who have been diagnosed as Chronic Obstructive Pulmonary
Disease (COPD) and registered in Department of TB and Chest Diseases.
INCLUSION CRITERIA
1. Patients diagnosed as Diabetes mellitus / Systemic Hypertension /
COPD and registered in the respective departments.
2. Age > 30 years and < 50 years
3. Patients of both genders with duration of illness ( DM / SHT / COPD)
more than 5 years
4. Informed consent
EXCLUSION CRITERIA
1. Presence of any other associated Co-morbid chronic physical
disorders with the primary illness..
2. Past or present history of any mental illness.
3. Family History of any psychiatric illness
4. Age Below 30 years or above 50 years
5. History of substance abuse
SAMPLING
For each group, consecutive cases from respective department OPD
who satisfied Inclusion criteria were taken.
VARIABLES STUDIED
Socio economic Variables- Age, Sex, Religion, Family, Domicile,
Marital status, Education, Occupation, Income And Socio economic status
Clinical Variables - Duration of chronic physical illness, Complication of the
illness, number of hospitalization, medication adherence, depression and
STUDY PROCEDURE
1. After obtaining informed consent from patients with DM / SHT /
COPD attending the respective speciality OPD, they will be
interviewed and assessed using various scales. Data will be recorded
for this purpose.
2. Information is obtained from patient, reliable informant, and from
medical records.
3. Socio – demographic and medical details will be obtained using a semi
structured questionnaire designed for this study.
MATERIALS FOR THE ASSESSMENT
1. Socio – demographic pro- forma sheet designed for this study.
2. Beck depression inventory (BDI).
3. Hamilton rating scale for Anxiety (HAM-A).
4. Morisky Medication Adherence Scale : MMAS‐8
BECK DEPRESSION INVENTORY (BDI).
BDI95 is the one of the most important self - report rating scale which is
a gold standard tool to assess the depression severity. BDI was developed by
which concern about various symptoms with varying degrees of severity and
rated the scores as 0 – 3. BDI96 – II edition was released after the introduction
of DSM – IV , which included some new items and excluded some items
present in the previous scale, and make it more reflective towards DSM – IV.
BDI– II consists of 21 items, with a total score ranges of 0 – 84. Scores of 0
-10 considered as normal mood swings of ups and downs; considered as
normal, the according to the scores, classified as mild to extreme depression.
BDI was used in various studies because of its high reliability and consistent
validity, and also the internal consistency of this scale is higher. Since this
scale is having the advantage of time consumption, patient self reporting
model, and the easy scoring of the severity make it a gold standard tool to
assess the severity of depression.
THE HAMILTON RATING SCALE FOR ANXIETY97 (HAM-A):
This rating scale is administered by the clinician, and it is basically a
semi – structured type to evaluate the anxiety symptoms. This scale evaluates
symptoms alone and not for any specific disorders. It is one of the rating scale
developed first to assess the severity of the symptoms. Still, it is used for
clinical studies and for research purposes, because of it’s high reliability as
well as it’s high validity. It also yields a high consistency. This scale is also
used in the drug trials for the quantifying the outcome, in Generalized anxiety
This scale consists of fourteen entities, each of the entity is graded as 0
to 4 (not present to severe), higher the scores more severe in the anxiety
symptoms. The total score is ranges from 0 – 56, and the scores < 17 indicates
mild severity, scores between 18 and 24 indicates mild to moderate severity,
scores between 25 and 30 indicates moderate to severe anxiety symptoms, and
the total scores more than 30 indicates very severe.
HAM – A scale is a simple scale easy to administer within 20 to 30
minutes. It is useful to monitor the improvement after initiation of drug
treatment. This scale was translated in various languages, because of it’s
acceptable inter – rater reliability
MORISKY MEDICATION ADHERENCE SCALES: MMAS‐898
This self-reported medication adherence scale was originally
developed by Prof.Morisky. This MMAS-8 was developed from a previously
validated MMAS-4 scale. It was supplemented with additional items
considering the circumstances surrounding adherence behavior. Each item is
measuring a specific medication-taking behavior and not a determinant of
OBSERVATION AND
OBSERVATION AND RESULTS
Socio-demographic characteristics
The survey data were analysed to find out the age, sex, religion, family
type, residence, marital status, education, occupation, income and
socio-economic status of the participants across three groups.
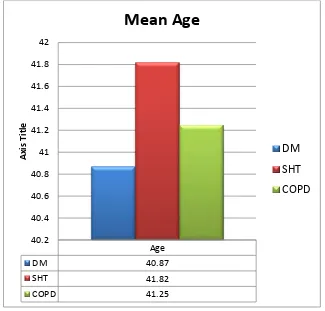
The mean age of the participants (N=180) is 41.31 with a standard
deviation of 5.19. Individual mean scores across patients of DM, SHT and
[image:56.595.143.468.379.690.2]COPD are presented in figure 1.
Figure 1: Individual mean age in different study groups.
Sex distribution across DM, SHT and COPD
Figure 2 depicts the distribution of males and females across DM, SHT
and COPD. The males and females are equally distributed in DM and SHT
[image:57.595.105.507.226.644.2]groups whereas males predominate the COPD group.
Figure 2: Sex distribution across DM, SHT and COPD
DM SHT COPD
Male 50 50 55
Female 50 50 45
0 10 20 30 40 50 60
Religion
Figure 3 illustrates the frequency distribution of religion among the
[image:58.595.102.508.193.655.2]study participants. Hindus were more in number.
Figure 3: Frequency distribution of religion across DM, SHT and COPD
22
33 27
17 9
12
13
18 18
8 8
COPD SHT DM
Religion-frequency distribution
Family type
Most of our study participants come from nuclear families, n=108
[N=180]. Figure 4 shows the distribution of family type across the study
[image:59.595.106.506.222.631.2]groups.
Figure 4: Frequency distribution of family type across
DM, SHT and COPD
36
39
33
24
21
27
DM SHT COPD
Family type-Frequency
Domicile
Urban population were more with 68.9% of the entire study
population, N=180. Figure 5 demonstrates the residence of the study groups
[image:60.595.103.499.224.672.2]in percentage.
Figure 5: Domicile of study groups
70 70 66.7
30 30
33.3
0 10 20 30 40 50 60 70 80
DM SHT COPD
Domicile in percentage
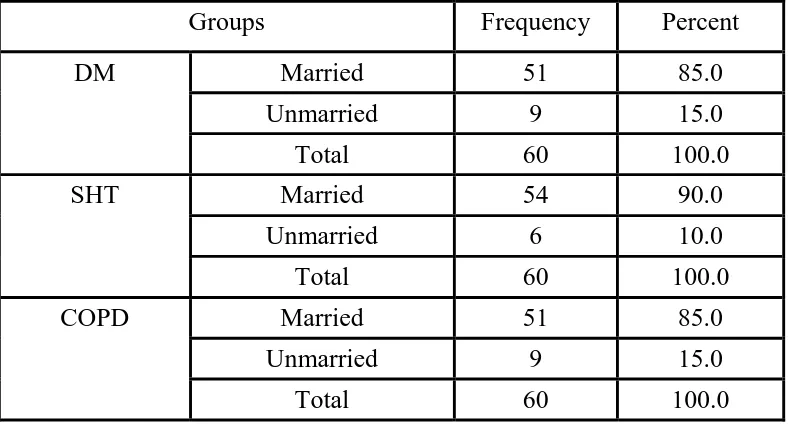
Marital status
The marital status of the participants is given below in figure 6. Most
of the participants were married n=156 while only 24 of them were
[image:61.595.109.503.476.688.2]unmarried.
Figure 6: Marital status of the participants
Groups Frequency Percent
DM Married 51 85.0
Unmarried 9 15.0
Total 60 100.0
SHT Married 54 90.0
Unmarried 6 10.0
Total 60 100.0
COPD Married 51 85.0
Unmarried 9 15.0
Total 60 100.0
Table 1: Marital status of the participants
85 90 85
15 10 15
DM SHT COPD
Chart Title
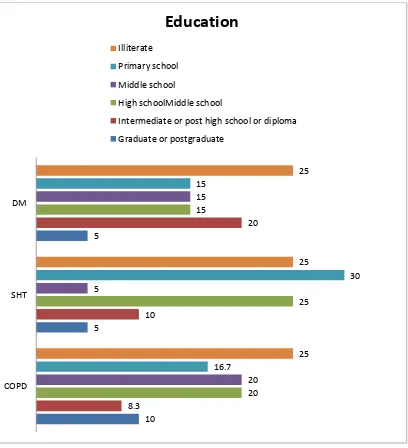
Education
Forty-eight participants (26.7%) from the three groups were illiterate
with no professionals in any of the groups. A small group of the participants
were graduates or post-graduates. Rest of them were almost equally spread
[image:62.595.105.513.254.702.2]between primary school and diploma.
Figure 7: Education of the participants
10 5 5 8.3 10 20 20 25 15 20 5 15 16.7 30 15 25 25 25 COPD SHT DM
Education
Illiterate Primary school Middle schoolHigh schoolMiddle school
Intermediate or post high school or diploma
Study Groups Frequency Percent DM Graduate or postgraduate 3 5.0
Intermediate or post high school
or diploma 12 20.0
High school 9 15.0
Middle school 9 15.0
Primary school 9 15.0
Illiterate 18 30.0
Total 60 100.0
SHT Graduate or postgraduate 3 5.0
Intermediate or post high school
or diploma 6 10.0
High school 15 25.0
Middle school 3 5.0
Primary school 18 30.0 Illiterate 15 25.0
Total 60 100.0
COPD Graduate or postgraduate 6 10.0 Intermediate or post high school
or diploma 5 8.3
High school 12 20.0
Middle school 12 20.0 Primary school 10 16.7
Illiterate 15 25.0
[image:63.595.98.507.72.704.2]Total 60 100.0
Occupation
The following Figure 8 denotes the percentage of occupation of the
study participants of the groups: DM, SHT and COPD. 25.6% (n=46) of the
participants were skilled workers and unemployed each across the three
categories. Clerical/shop owner or farmer constituted 19.4% of the total study
[image:64.595.104.514.282.666.2]sample.
Figure 8: Occupation of the participants
0 5 10 15 20 25 30 35
DM SHT COPD
Clerical/shop owner or farmer
Skilled worker
Semiskilled worker
Unskilled worker
Study groups Frequency Percent
DM Clerical/shop owner or farmer 14 23.3
Skilled worker 17 28.3
Semiskilled worker 6 10.0
Unskilled worker 9 15.0
Unemployed 14 23.3
Total 60 100.0
SHT Clerical/shop owner or farmer 6 10.0
Skilled worker 15 25.0
Semiskilled worker 15 25.0
Unskilled worker 12 20.0
Unemployed 12 20.0
Total 60 100.0
COPD Clerical/shop owner or farmer 15 25.0
Skilled worker 14 23.3
Semiskilled worker 4 6.7
Unskilled worker 7 11.7
Unemployed 20 33.3
[image:65.595.100.513.75.678.2]Total 60 100.0
Income
The average income of the participants falls mainly within the salary
range of Rs.13,874 – 18,497 (32.3%) and 9,249-13,875 (29.4%) with a small
proportion of 7.8% within the salary range of 18,498-36,996. No one is found
in the higher income group of Rs.>36,996. Figure 9 shows the salary
[image:66.595.99.517.276.679.2]distribution of the study sample across DM, SHT and COPD.
Figure 9: Salary distribution of the study sample
10
13.3 38.3
30
28.3 28.3
40
20
10
15
28.3
13.3
15
10
DM SHT DM
Income in percentage
18,498 -36,996 13,874 – 18,497 9,249-13,875 5,547- 9,248 1,866- 5,546
Salary range in rupees Frequency Percent
DM 18,498 -36,996 6 10.0
13,874 – 18,497 23 38.3
9,249-13,875 17 28.3
5,547- 9,248 6 10.0
1,866- 5,546 8 13.3
Total 60 100.0
SHT 13,874 – 18,497 18 30.0
9,249-13,875 24 40.0
5,547- 9,248 9 15.0
1,866- 5,546 9 15.0
Total 60 100.0
COPD 18,498 -36,996 8 13.3
13,874 – 18,497 17 28.3
9,249-13,875 12 20.0
5,547- 9,248 17 28.3
1,866- 5,546 6 10.0
[image:67.595.98.510.76.656.2]Total 60 100.0
Socio-economic Status
The study population predominantly come from the lower
socioeconomic status. The following figure 10 shows the distribution of the
[image:68.595.105.508.226.637.2]participants across various socio-economic groups.
Figure 10 : Socioeconomic status of the study groups
5
10 10
43.3
30
36.7 45
50
48.3
6.7
10
0 10 20 30 40 50 60
DM SHT COPD