Copper electrodeposition in the presence of guar or activated polyacrylamide
90
0
0
Full text
(2) unstable, may therefore also be inferred1-4. Cyclic Voltammetry and Electrochemical Impedance Spectroscopy were selected to extract kinetic parameters for copper electrodeposition in the presence of a mass transport rate-determining step and organic additives. The interest in Electrochemical Impedance Spectroscopy to determine the double-layer capacitance, to characterize the electrode processes and to unravel the kinetics of electrochemical systems has enormously increased in recent years5, 6. The application of this technique in metals electrodeposition in the presence of additives has also increased in recent years since adsorption phenomena strongly influence the electrochemical impedance structure7. The principle of EIS is to measure the impedance, usually at fixed potential during a frequency scan, to study the kinetics of processes at the metal electrolyte interface and to distinguish between the various mechanisms that regulate chargetransfer. EIS involves high-precision measurements over wide time ranges (104 to 10-6 s or 10-4 to 106 Hz), which makes it suitable for the study of two one-electron steps with the stabilization of the intermediate step in copper deposition discussed in Section 2.4. This method analyses the response of the electrochemical system to a small-amplitude alternating current signal perturbation. The results of EIS testwork can be interpreted using either or both the complexplane plot, also known as the Nyquist plot, and Bode plot. The complex-plane plot presents the real and imaginary impedances as a function of frequency and the Bode plot presents the dependence of the phase angle on frequency. Analysis of the system response therefore may contain information about the chemical and electronic structure of the metal electrode/cupric ions-sulfuric acid electrolyte with either APAM or Guar at the interface as the impedance is measured as a function of the frequency of the AC source. A number of studies have been recently conducted to understand the effect of organic additives on copper deposition. The effect of chloride ions on the currentvoltage polarization behaviour of polyethylene glycol [PEG: (CH2-O-CH2)n] indicates that, in the presence of either cupric ions (0.3M) or sulfuric acid (2.2M), PEG polarizes 116.
(3) or inhibits the electrode more strongly in the presence of chloride ions than in its absence8, 9.. In separate studies, Moffat et al.8,. 10-12. presented the effect of the. competitive interaction of 3-mercapto-1-propane-sulfonic acid (MPSA) with PEG and chloride ions in the copper electrolyte bath on the current voltage polarization as well as on the superconformal deposition of a smooth and “bright” copper deposit. While PEG and chloride ions reduce the deposition rate or provide the inhibition/polarization process, MPSA or some derivative thereof is associated with acceleration/depolarization processes. A surface-enhanced Raman (SERS) study on the polarization effect of PEG during copper deposition indicates that the presence of chloride ions enhance the. adsorption of PEG to the copper electrode surface13. It suggests the formation of PEGCu-Cl complex in which there are only two possible types of oxygen atoms the Cu(I) could bind with (i) an ether O in the CH2-O-CH2 chain and (ii) a hydroxyl oxygen O at the CH2-O-H end. Therefore, Feng et al.13 suggested two structural models involving a Cu atom with two oxygen atoms of PEG and one chloride ligand and (ii) with one ether oxygen and one hydroxyl oxygen atom of PEG and one chloride ligand.. The kinetics of copper electrodeposition from an acidified copper sulphate (0.25M) – sulfuric acid (1.8M) electrolyte containing PEG, bis(3-sulfo-propyl) disulfide (SPS: Na2[SO3(CH2)3S]2) and chloride ions also indicated that there is a competitive interaction between PEG and SPS using EIS8, 14. PEG and chloride ions interact with cuprous ions to form a passivating film inhibiting the metal deposition15.. SPS. accelerates the formation of cuprous complexes near the surface of the electrode such as cuprous thiolate [Cu(I)(S(CH2)3SO3Had] as reported from current-potential curves using a rotating Pt-disk-glassy carbon (GC)-ring electrode15. The effect of glue, thiourea and chloride ions on copper electrodeposition was also studied using EIS at a copper-metal rotating disk electrode (RDE)16,. 17. . It was. concluded that thiourea decreases the charge-transfer resistance that was increased by the presence of glue and chloride ions.. 117.
(4) In summary, the presence of PEG and chloride ions or glue and chloride ions in a sulfuric acid – cupric ion electrolyte polarizes the current-potential relationship. In other words, these additives increase the charge-transfer resistance. The addition to the electrolyte of MPSA, SPS or thiourea, all of which contain the thiol group, depolarizes the electrode thus compensating from the inhibition processes caused by PEG and chloride ions or glue and chloride ions. The formation of PEG-cuprous ion and MPSAor SPS-cuprous ion complexes are proposed for surface coverage purposes8, 14 but the actual adsorption mechanisms of these organic additives have not been discussed in detail. Despite the variety of mechanisms proposed for the smoothening effect of additives18, a consensus exists that adsorption of the additive near the surface of the substrate plays the determining role19, 20.. 5.1.1. Equivalent Circuit for Electrochemical Systems – Copper Deposition An electrochemical cell can be considered as an impedance to the passage of a. small sinusoidal amplitude current at the exact amplitude and phase angle as the source and therefore its performance can be represented by an equivalent circuit of resistors and capacitors in parallel1, 3. The main objective of EIS studies is to find the frequency dependencies of resistances and pseudo-capacitances in the equivalent circuit and to transform these functions into an improved knowledge of the chemical data. Bard et al.1 states that it is highly unlikely the faradaic process can be represented by a simple circuit in series comprising a single resistor, R and a single capacitor, Cd, whose values are independent of frequency, but as a general impedance, Zf. Therefore parallel elements were introduced into the equivalent circuit to account for the total current through the working electrode as the sum of the distinct contributions from the faradaic processes, if, and double layer charging, ic. The doublelayer capacitance, sometimes referred to as constant phase element (CPE), represented in equivalent circuits by Cdl or Cd, is nearly a pure capacitance1 and is generally associated with space charge polarization regions, specific adsorption1, surface coverages21 and electrocrystallization4.. 118.
(5) As the current passes through the electrolyte, a resistance, Rs, is inserted into the equivalent circuit as a series element. In contrast to Rs and Cd, which are nearly ideal circuit elements independent of frequency, the components of the faradaic impedance are non-ideal or dependent on the frequency (ω). As a result, the faradaic impedance consists of a pure resistance, Rct, the charge-transfer resistance, also known as polarization resistance, and the Warburg impedance, ZW, described by Bard et al.1 as “the kind of resistance to mass transfer” or diffusion impedance. The equivalent circuit most often referred to in the literature for electrochemical interfaces is depicted in Figure 5-564, 22-27. This equivalent circuit that consists only of resistors and capacitors is used to describe the two single-electron transfer steps21. This selection appears to be valid for Langmuir isotherms and other similar isotherms such as the Frumkin isotherm. This equivalent circuit was also used for copper deposition in the presence24 and absence25 of organic additives. Diffusion creates impedance in the low frequency range, known as the Warburg impedance. This impedance depends on the frequency of the potential perturbation. At high frequencies, the Warburg impedance drops out because the time scale is so short that diffusion cannot manifest itself as a factor affecting the current. At very high frequencies, the equivalent circuit is represented by Figure 5.56 R1, R2 and C2 only since R2 and C2 lead to a time constant, τD=R2*C2, the dielectric relaxation time of the electrode material. The value of τD gives the smallest time constant of interest in EIS experiments. The condition ωmax*τD«1 is satisfied for the highest angular frequency applied, ωmax; since τD is often so small, e.g., 10-7s. Therefore, the impedance plane curve is not observed. As the peak frequency, ωp conforms in the vicinity of ωp*τD=1 and therefore ωmax*τD»1 it is only then that almost the full curve of the impedance plane can be observed4.. 119.
(6) C2. R1 C3. R2. R3. Figure 5-56: Parameters Definition in LEVM Equivalent Circuit B28 Legend: R1 = P(1), Electrolyte Resistance; R2 = P(4), Charge-Transfer Resistance; C3 = P(5), Double-Layer Capacitance and R3 = P(26) and C3 = P(27) are part of the Diffusion-Related Elements, the Warburg Impedance4. P(i) represents the parameters selected in LEVM.. The results of EIS testwork will be presented in the complex-plane plot, also known the Nyquist plot, where the imaginary and real impedance are depicted as a function of frequency. A plot of ZIm vs. ZRe should give a circular plot centered at ZRe = R1+R2/2 and ZIm=0 having a radius of R2/2 where R2 is the charge-transfer resistance, Rct. The imaginary component to the impedance plotted from Figure 5-56 comes solely from the double-layer capacitance. Figure 5-57 shows the complex-plane plot for an electrochemical system1,. 29. .. The regions of kinetic and mass-transfer control are found at high and low frequencies, respectively. The sine-wave for parallel circuits is described using the complex plane for an electrochemical cell. The total impedance characterizing the linear response of the system as a function of the oscillation frequency is given by3, 14, 29, 30. Z (ω ) = Rs +. 1 1 + jωC dl Z F (ω ). (5-24). 120.
(7) Figure 5-57: Complex-Plane Plot for an Electrochemical System ZRe, real impedance; ZIm, imaginary impedance; RΩ, electrolyte resistance (Rs); Rct, chargetransfer resistance or polarization resistance and ω, frequency.. where Rs (or RΩ in Figure 5-57) represents the ohmic resistance of the electrolyte between the electrode surface and the reference electrode, and Cdl the double-layer capacitance and. Z F (ω ) =. ΔV Δi F. (5-25). represents the complex faradaic impedance and it is often replaced by the charge-transfer resistance, Rct for the high frequency region depicted in Figure 5-57. It is widely known that the current that flows is partly due to charging the double-layer capacity and to the faradaic reaction when the potential of the electrode is varied. The equivalent circuit presented in Figure 5-56 will be used to conduct measurement modelling31-34 of all experimental data in the presence and absence of 121.
(8) Guar and APAM using the commercially available software LEVM28 and ZSimpWin™35,. 36. . LEVM and ZSimpWin™ (Princeton Applied Research) use the. Levenberg-Marquardt algorithm to conduct the minimization procedure to find the set of parameters in the equivalent circuit.. 5.1.2. Measurement Modelling of Electrochemical Impedance Spectroscopy Data. It is often suggested to derive the impedance as a function of the kinetic parameters for a given mechanism, and therefore data analysis should proceed from the measured impedance spectrum directly to the kinetic parameters of the postulated mechanism21, 31. The mechanism for copper deposition was given in Section 2.4. The impedance measurement is valid provided that the criteria of linearity, causality, stability and finiteness are satisfied3, 4: (i). The linearity of the system is defined when sum of individual input signals is equal to the sum of individual responses. Linearization of differential equations determines the impedance since electrochemical systems are usually highly nonlinear.. This criteria holds with the. application of a small AC amplitude such as ΔE< 8/n mV3 peak-to-peak, where n is the number of electrons exchanged in the reaction. (ii). A system is causal if the response of the system is entirely due to the applied perturbation,. (iii). A stable system remains invariant unless it is excited by an external source.. (iv). Finally, the real and imaginary components of the impedance must be finite valued over the entire frequency range 0 < ω < ∞ . Once the data is obtained, a measurement model can be conducted in which a. complex nonlinear least-squares (CNLS) program is used to fit the real and imaginary parts, or the magnitude and phase angle of the experimental data to a given model. In general, the sum of squares is minimized using the following equation:. 122.
(9) N. [. (. S (P ) = ∑ [ wi' Z i' − Z i',calc i =1. ). 2. + wi'' (Z i'' − Z i'',calc ). 2. ]. (5-26). Where Z i' and Z i'' are the real and imaginary parts of the experimental impedances, respectively at frequency ω i ; Z i',calc and Z i'',calc are the values calculated from the given model and wi' and wi'' are the statistical weights of the data. (P) represents the parameters selected in LEVM. The minimization is carried out using the iterative Marquardt-Levenberg algorithm3, 4. Thus the electrochemical impedance data can be directly correlated with an idealized model circuit of discrete electrical components1, 4, 31, 37. The EIS data in this thesis were obtained using a rotating cylinder electrode. However, a small number of tests were also conducted using a RDE to validate the RCE results. The non-uniformity of current distribution for the rotating disk electrode for finite values of the dimensionless exchange current density is widely known as is the uniformity of the current distribution for the rotating cylinder electrode38. Numerical calculations presented by Durbha et al.39 demonstrated that the non-uniform current distribution observed below the mass-transfer-limited current has a significant effect on the impedance response of the rotating disc electrode when the electrode kinetics are fast and therefore the physical parameters obtained by regression models will be incorrect39, 40. The hydrodynamics for the RDE are well understood and hence surface concentration can be computed. The surface concentration of cupric ions on the RCE can also be calculated as described by Newman38 and elsewhere3, 41 and in Equation 211. Since planar electrodes, used in copper electrowinning and electrorefining, also have uniform current distribution38, and since RCE’s also show uniform current distribution, RCE was also used for the work described in this Chapter. The effect of Guar and APAM will be compared in the high frequency loop only since the high frequency loop reflects the kinetic control region of a process1. The commercial software packages LEVM and ZSimpWin™ were used to the EIS modelling. ZSimpWin™ is often also known as the Boukamp software package in 123.
(10) honour of its author35. The statistical analysis presented in this work was conducted using LEVM. However, if poor fitting was obtained with LEVM; ZsimpWin™ was used to obtain the initial parameter values. These initial values were then used in LEVM for further iteration.. ZSimpWin™ was easier to use than LEVM but the. documentation for LEVM appears to be more comprehensive4, 28.. 124.
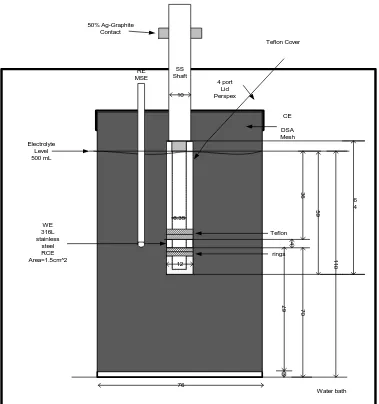
(11) 5.2. Experimental. The electrochemical cell was a 500 mL long-necked glass beaker with a fourport lid made of Perspex depicted in Figure 5-58. A circular retaining wall, made also of Perspex, with an internal diameter similar to the external to the mouth of the beaker diameter was sealed on the bottom face of this four-port lid to immobilize it from any lateral movement.. A PVC bush centred the working electrode within the. electrochemical cell. This bush had an external diameter similar to the central-port diameter and internal diameter similar to the diameter of the shaft. Therefore the beaker was always centralized through the shaft and the distance between the electrodes were always kept constant. 50% Ag-Graphite Contact Teflon Cover. RE MSE. SS Shaft 10. 4 port Lid Perspex. CE DSA Mesh Electrolyte Level 500 mL. 36 59. 6.35 Teflon 4 rings. 110. 12. 70. 67. WE 316L stainless steel RCE Area=1.5cm^2. 6 4. 3. 76 Water bath. Figure 5-58: Rotating Cylinder Electrode Configuration used for CV and EIS. 125.
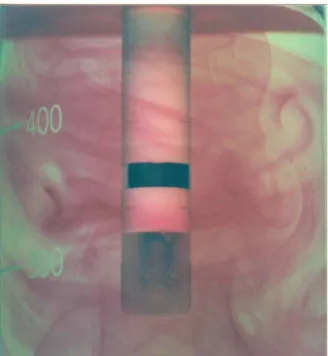
(12) The cell was immersed in a water bath at either 45oC±0.5oC or 65±0.5oC. Evaporation was made up with water at about 1.4mL (45oC) and 7mL (65oC) per hour, respectively. The working electrode (WE) was a 316L stainless steel rotating cylinder electrode (RCE) sourced from Pine Instruments (QC3 series – ACQ012CY316). However, the original WE surface area was reduced to a 2cm2 surface area to conduct CV tests and to 1.5cm2 to conduct EIS tests. The smaller surface area produced less induction at the high frequency end where the frequency count starts. A mercurousmercuric sulfate electrode (MSE, 651 mV vs. NHE) in saturated potassium sulfate from Radiometer Analytical was used as a reference electrode. The counter electrode was prepared from dimensionally stable anode (DSA, a titanium-based substrate coated with ruthenium dioxide or iridium dioxide), sourced from Eltech Systems Corp. DSA is the standard anode for generating chlorine in the chlor-alkali, chlorate and hypochlorite industries where it has very long lifetimes. The DSA surrounded the internal wall of the 500mL long-necked beaker. The working electrode was initially polished with 1µm and 0.25µm diamond paste (Struers). After every test it was polished with the latter only, washed with distilled water and acetone, rinsed in an electrolyte solution and rinsed again with distilled water. Table 5-22 shows the experimental conditions for CV and EIS experiments. The aim of the experimental design was to approximate the diffusion layer thickness of a commercial scale electrowinning plant as suggested in a computational fluid dynamic study by Filzwierser et al.42. The rotation speed of the RCE at 25rpm and at temperatures from 25oC to 65oC gives a Reynolds number (Re=ωd2/2ν) from 48 to 527. At this rpm and temperature range the Taylor (Ta) number varies from 932 to 1804. It is reported that the critical Reynolds number is 200 for the RCE43 and therefore radial and axial motion is superimposed on the tangential flow across the electrolyte38, 44. . This can been seen in Figure 5-59. The Reynolds and Taylor numbers therefore. appear to indicate that the flow regime at 25 rpm and 45oC - 65oC is laminar with vortexes.. Deposition conditions such as electrolyte composition, temperature and. current density also simulate commercial scale conditions.. 126.
(13) Figure 5-59: Fluid Flow Produced by the RCE at 25rpm and 25oC in Water. The critical Reynolds number (Re = ω*d2/2ν) at 25oC is 20043. The Reynolds number for the copper electrolyte at 45oC and 25rpm is 204. The experimental conditions for the CV tests are summarized in Table 5-22. These tests were conducted to determine the polarization behaviour of Guar and APAM on 316L stainless steel and on copper pre-plated onto 316L stainless steel at 10mA/cm2 for 225 seconds. The EIS tests were conducted in potentiostatic mode. The EIS tests were always conducted on pre-plated copper8 formed as follows: chronopotentiometry for 360 seconds at 10mA/cm2 current density to pre-plate copper, followed by automatic stabilization for 15 seconds at the potential to be applied during the EIS experiment followed by the EIS test itself. The EIS tests were run using 6mV AC over the 127.
(14) frequency range from 30kHz to 0.2Hz using the RCE and 50kHz – 0.2Hz using the RDE. Preliminary tests were run using 8mV AC and the impedance data obtained were similar to those observed using 6mV AC. Therefore, it was confirmed that the system was linear3.. Table 5-22: Experimental Conditions for CV and EIS Experiments Copper, g/L 36 Sulfuric acid, g/L 160 Chloride ions, mg/L 25 Guar Preparation Media Water at 25oC APAM Preparation Media 16-fold DE APAM Preparation Media Temperature, oC 50 Electrolyte Volume, mL 500 APAM Concentration in Electrolyte, mg/L 2 RCE rpm 10 and 25 Copper Pre-plating Time for CV and EIS, respectively, sec 225 and 360 Current Density during Pre-plating, mA/cm2 10 o Electrolyte Temperature, C 45 and 65 Sweep rate, mV/sec 1 Diffusion Layer Thickness for CV using RCE, at 10 rpm, µm* 90 (110) Diffusion Layer Thickness for EIS using RCE, at 25rpm, µm* 87 (99) Outer Cylinder Diameter, cm 7.6 Inner (rotating) Cylinder Diameter, cm 1.2 WE (316L Stainless Steel) surface area for CV, cm2 [Set up: 2 Potential 0 = -370 mV, Potentials 1 and 2 = -725mV vs. MSE] WE surface area for EIS using RCE and RDE, respectively, cm2 1.5 and 0.178 o o Schmidt Number (ν/D) for EIS at 45 C and 65 C, respectively 1005 and 435 *Diffusion layer thickness at 45oC and 65oC in brackets. The pre-plating process of copper onto the stainless steel at 10mA/cm2 was done to obtain a smooth deposit and to plateau the surface overpotential. The potential of the working electrode was fixed at -470 mV vs. MSE or 300 A/m2 (30mA/cm2) and 490mV vs. MSE 340 A/m2 (34mA/cm2) current density at steady-state conditions in the absence of APAM and Guar. All tests were replicated at least twice. The reference electrode was located about 1.5cm away from the WE to maintain a uniform velocity of the electrolyte around the electrode. This experimental configuration was similar to that reported by Kelly8.. 128.
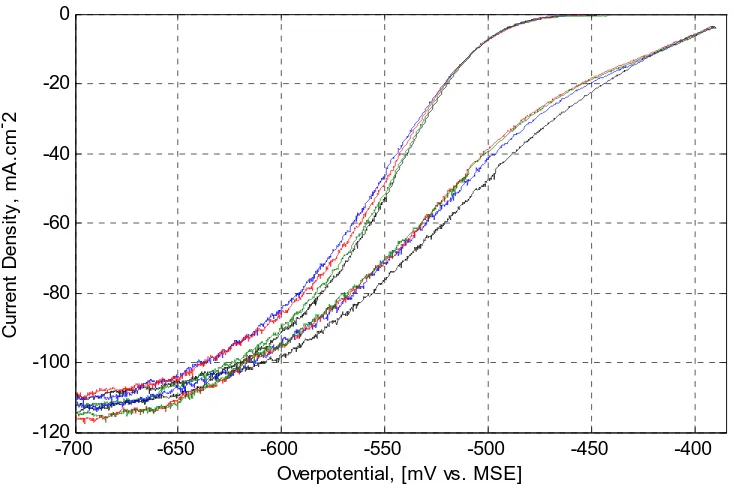
(15) 5.3. Cyclic Voltammetry in the Presence of Guar at 45oC. These tests were conducted to determine the polarization behaviour of Guar during copper electrodeposition on bare 316L stainless steel and on pre-plated copper at 10mA/cm2 for 225 seconds. The pre-plating process achieves a constant overpotential over this period. These tests determined how the polarization behaviour varied when Guar was aged in the electrolyte heated at 45oC over a 5-hour period. The initial cathodic scan of the cyclic voltammetry curves are presented in Figure 5-60. The left and right-sets of curves were obtained on stainless steel (SS) and on pre-plated copper (Cu), respectively. Each curve was sequentially obtained every hour starting with the bare stainless steel electrode after about 20minutes once Guar was dosed and followed with the pre-plated copper electrode and so on up to five hours. Therefore, CVs on stainless steel were conducted at 0.3, 2, and 4-hours and on preplated copper at 1, 3, and 5-hours.. 20. Current Density, mA.cm-2. 0 -20 -40 -60 -80 -100 -120 -750. -700. -650. -600 -550 -500 Overpotential, [mV vs. MSE]. -450. -400. -350. Figure 5-60: Effect of Guar Residence Time on Depolarization at 45oC. Legend: Left-Set of Curves on Stainless Steel and Right-Set of Curves on Pre-plated Copper: Control (without Guar) – Black; 0.3 (SS) and 1Hr (Cu) – Blue; 2 (SS) and 3Hrs (Cu). – Red; and 4 (SS) and 5Hrs (Cu) – Green.. 129.
(16) It can be seen that Guar de-polarized the electrode on both stainless steel and pre-plated-copper. This is based on the observation that the electrode potential in the presence of an additive is less negative than the potential without the additive at a determined current density. It can also be seen that there is a trend in the depolarization behaviour. Polarization increases from the 0.3-1hr to a maximum in 2-3hours and then its depolarizing activity decayed such that within 4-5hours an insignificant effect can be observed on pre-plated copper. The limiting current density remains about constant in the presence and absence of Guar as others have observed in the presence of PEG and chloride ions9, 11. Figure 560 also indicates that less energy is required to plate on fresh copper-metal formed than on the stainless steel substrate. The same preferential deposition was obtained with PEG and chloride ions when the working electrode was made of copper metal9. This preferential deposition is probably due to the reduced activation energy required to nucleate on fresh copper-metal and the growth may also follow the Stranski-Krastanov mode where 3D copper metal islands form on top of the pre-deposited 2D copper overlayers45 described in Chapter 2 – Section 2.5.1. CV and EIS tests were found to be more reproducible on pre-plated stainless steel than on bare-stainless steel. Kelly et al.8 also reported that EIS tests on pre-plated copper metal WE for 3minutes were more reproducible than on unpre-plated WE. This effect is probably due to the crystallographic misfit between 316L stainless steel and the freshly plated copper metal.. This pre-plating process would simulate commercial. electrowinning and electrorefining operations on 316L stainless steel since traces of copper are always left behind after the copper plate is stripped off. Table 5-23 presents the depolarization data at 30mA/cm2 (300Amp/m2) current density extracted from Figure 5-60. Figure 5-61 depicts the extracted data and indicates that a maximum depolarization of approximately 14mV was obtained at 2-3 hours residence time whether on stainless steel or copper metal. The polarization curves in the presence and absence of Guar were also used to calculate the potential at zero current (Ei=0), the (cathodic) Tafel slope (b) and the transfer coefficient (α). These values are shown in Table 5-24 for pre-plated copper 130.
(17) only. It can be seen that the potential at zero current appears to follow the overall polarization pattern of the aging of Guar in the electrolyte. The most important result in Table 5-24 is the transfer coefficient value of 0.50 in the absence of Guar. This agrees with that given by Wu and Barkey46 and Mattson and Bockris47. Table 5-23: De-polarization Behaviour of Guar at 45oC On Stainless Steel On Pre-plated Copper Residence Potential, mV vs. MSE at Residence Potential, mV vs. MSE at Time, Hrs 30 mA/cm2 Current Density, Time, Hrs 30 mA/cm2 Current Density, 0(Nil Guar) -541 0(Nil Guar) -493 0.3 -533 1 -484 2 -527 3 -478 4 -530 5 -491. V-iRs on Preplated Copper and Stainless Steel (mV). -470. -480. -490 Control - without Guar. -500 CV on Stainless Steel CV on Preplated Copper -510. -520. -530. -540. Control - without Guar. -550 0. 1. 2. 3. 4. 5. 6. Residence Time of Guar in Electrolyte at 45oC, Hours. Figure 5-61: Effect of Time on the De-polarization Behaviour of Guar at 45oC at 300A/m2 Current Density.. 131.
(18) Table 5-24: Kinetic Parameters for Copper Deposition in the Presence of Guar at 45oC Residence Time, E(i=0) Tafel Slope, mV Transfer Coefficient Hours mV vs. MSE b α [=2.3R*T/(b*F)] 0 (Nil Guar) -375.3 -127.1 0.50 1 -374.4 -122.6 0.52 3 -373.0 -123.6 0.51 5 -373.2 -125.9 0.50 46 Wu and Barkey -122 0.5 ± 0.05 5.4 Cyclic Voltammetry in the Presence of Activated Polyacrylamide at 45oC. These tests were conducted to determine the polarization behaviour of APAM during copper electrodeposition on bare 316L stainless steel and on pre-plated copper at 10mA/cm2 for 225 seconds. Figure 5-62 shows the results obtained at 45oC in the presence and absence of APAM. It indicates that APAM polarizes or inhibits the working electrode whether it is stainless steel or pre-plated copper. It can also be seen that APAM appears to confer higher adsorption on pre-plated copper electrode than on stainless steel since the polarization values are higher for pre-plated copper than that for the stainless steel electrode. This result contrasts with those of Vereecken and Winand48 who found that polyacrylamide did not polarize the electrode when it was prepared in water and in fullstrength electrolyte. It is therefore concluded that the preparation of APAM, i.e., the formation of block copolymers, confers an increase of the adsorption and therefore the polarization of the working electrode.. 132.
(19) 0. Current Density, mA.cm-2. -20. -40. -60. -80. -100. -120 -700. -650. -600 -550 -500 Overpotential, [mV vs. MSE]. -450. -400. Figure 5-62: Effect APAM Residence Time on Polarization at 45oC. Legend: Left-Set of Curves on Stainless Steel and Right-Set of Curves on Pre-plated Copper: Control (without APAM) – Black; 0.3 (SS) and 1 Hr. (Cu) – Blue; 2 (SS) and 3 Hrs. (Cu) – Red; and 4 (SS) and 5 Hrs. (Cu) – Green.. Table 5-25 shows the data extracted from Figure 5-62 for stainless steel and preplated copper at 300 and 400A/m2. Figure 5-63 depicts the data from Table 5-25 for pre-plated copper only since it closely reflects a commercial application as discussed previously. A maximum polarization of 14mV is observed at 3 hours residence time. Table 5-25: Polarization in the Presence of APAM at 45oC On Stainless Steel On Pre-plated Copper Residence Potential, mV vs. MSE Residence Potential, mV vs. MSE 2 Time, Current Density, mA/cm Time, Current Density, mA/cm2 Hours Hours 30 40 30 40 0 (No APAM) -529 -538 0 (No APAM) -468 -489 0.3 -533 -544 1 -477 -497 2 -532 -543 3 -482 -503 4 -531 -540 5 -481 -502 Figure 5-63 shows that the presence of APAM results in a significant polarization of the electrode over the 5-hour experimental period. These results are consistent with APAM acting as a surfactant/levelling agent and doing so for extended. 133.
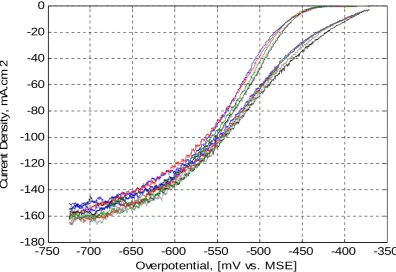
(20) period of time, which is consistent with the results described in Chapters 3 where 1mg/L APAM was dosed once for 6 hours electrowinning time.. -465 Control - without APAM. V-iRs on Preplated Copper (mV) vs MSE. -470. -475. -480. -485 Control - without APAM. -490. 30 mA/cm^2. -495. 40 mA/cm^2. -500. -505 0. 1. 2. 3. 4. 5. 6. APAM Residence Time in Electrolyte at 45C, Hours. Figure 5-63: Effect of APAM Ageing on Polarization on Pre-plated Copper at 45oC. 5.5 Cyclic Voltammetry in the Presence of Activated Polyacrylamide at 65oC. These tests were conducted at the temperature used in copper electrorefining49. Figure 5-64 shows the results in the presence of APAM at 65oC. It can be seen clearly that the polarization behaviour of APAM increases with time giving a maximum polarization in the first hour (blue colour). Table 5-26 shows the potentials at 300 and 400 A/m2 extracted from Figure 5-64. Figure 5-65 depicts these values.. 134.
(21) 0. -40. -. Current Density, mA.cm 2. -20. -60 -80 -100 -120 -140 -160 -180 -750. -700. -650 -600 -550 -500 -450 Overpotential, [mV vs. MSE]. -400. -350. Figure 5-64: Effect of APAM Residence Time on Polarization at 65oC and 10rpm. Legend: Left Set of Curves on Stainless Steel and Right Set of Curves on Pre-plated Copper: Control (without APAM) – Black; 0.3 (SS) and 1 Hr (Cu) – Blue; 2 (SS) and 3 Hrs.(Cu) – Red; 4 (SS) and 5 Hrs.(Cu) – Green; 6 (SS) and 7 Hrs.(Cu) – Grey.. Figure 5-64 shows that the presence of APAM results in a significant polarization of the electrode over a 7-hour period, with the polarization reaching a maximum of 13mV at 1hr residence time at 300A/m2. It can also be noted that APAM appears to confer higher adsorption on pre-plated copper than on stainless steel since the net polarization values are higher for pre-plated copper than for stainless steel. This preferential adsorption on pre-plated copper was also observed at 45oC. Once again, these results indicate that APAM acts as a levelling agent for extended periods of time. The effectiveness of APAM is also dependent on the temperature. It has been shown in Sections 4.3.1 and 4.3.2 that APAM in the temperature range of 45oC- 65oC had the highest significant effect on reducing surface roughness than in the temperature range of 45oC-55oC. This result is also consistent with those described in Chapter 4 where APAM was dosed once for 6 hours electrowinning time and produced smoother copper deposits than Guar.. 135.
(22) Table 5-26: Polarization in the Presence of APAM at 65oC On Stainless Steel On Pre-plated Copper Residence Potential, mV vs. MSE Residence Potential, mV vs. MSE Time, Current Density, mA/cm2 Time, Current Density, mA/cm2 Hours Hours 30 40 30 40 (0) No APAM -484 -493 (0) No APAM -441 -459 0.3 -494 -505 1 -454 -472 2 -492 -501 3 -453 -470 4 -489 -499 5 -452 -470 6 -485 -494 7 -448 -464. -435 -440 V-iRs on Preplated Copper (mV) vs MSE. Control - without APAM -445 -450 -455. 30 mA/cm^2. Control - without APAM. -460. 40 mA/cm^2. -465 -470 -475 0. 1. 2. 3. 4. 5. 6. 7. 8. APAM Residence Time in Electrolyte at 64C, Hours. Figure 5-65: Polarization of APAM on Pre-plated Copper at 65oC. The maximum polarization at 45oC and 65oC is approximately 14mV but the time to attain this maximum value is about 3.5 hours at 45oC and 1.5 hours at 65oC as shown in Figure 5-66.. 136.
(23) -435 -440. V-iRs (mV) vs MSE (K2SO4 sat.). Control - without APAM -445 -450 -455 -460. On Pre-plated Copper at 45C. -465. On Pre-plated Copper at 65C. Control - without APAM -470 -475 -480 -485 0. 1. 2. 3. 4. 5. 6. 7. 8. APAM Residence Time in Electrolyte, Hours. Figure 5-66: Effect of Temperature on APAM Polarization at 300 A/m2 and 45oC and 65oC. 137.
(24) 5.6 Electrochemical Impedance Spectroscopy Results in the Absence of Additives. Preliminary tests were conducted to compare the results of this work with those presented in the literature in the absence of organic additives8. Figure 5-67 shows experimental data at two potentials (-470 and -490mV versus MSE) as open symbols and data fitted to the equivalent circuit shown in Figure 5-56 produced by LEVM as solid lines.. RCE 25rpm - No Organic Additives. 0.8 30 mA/cm2 -Z Im [ohm.cm2]. 0.6. 0.4. 0.2 34.2 mA/cm2. 0. -0.2 0.5. 0.75. 1. 1.25. 1.5. 1.75. 2. 2. Z Real [ohm.cm ]. Figure 5-67: Complex-Plane Plot of Experimental and Simulated EIS data at -470 (30mA/cm2 red) and -490mV (34.2mA/cm2 - blue) vs. MSE and 45oC in the Absence of Organic Additives.. Charge-Transfer Resistance, Rct in the High Frequency loop, at 25 rpm and 30mA/cm2 = 1.45ohm.cm2 and at 25rpm and 34.2mA.cm2 = 1.4ohm.cm2.. It can be seen that the data can be reasonably interpreted in terms of an equivalent circuit as shown in Figure 5-56 which results in the prediction of two loops. The predicted two loops are the results of resistors and capacitors in parallel.. 138.
(25) The results shown in Figure 5-67 are in agreement with studies of adsorbed species undergoing a single electron transfer step. Such reaction have been shown to have equivalent circuits that consist only of capacitors and resistors and exclude inductive behaviour21.. This conclusion is valid for the Langmuir isotherm21 and. possibly for the Frumkin isotherm. The capacitor is often known as the constant phase element (CPE) to describe different electrochemical phenomena such as double-layer capacitance, adsorption and surface coverage21. The adsorption of polyacrylamide in acid solutions follows the Frumkin isotherm slightly better than the Langmuir isotherm according to Grchev et al.50. Figure 5-67 correlates with the experimental work in the published literature8, 14, 17, 51-53. where RDEs were used in terms of the electrolyte resistance and the charge-. transfer resistance, Rct, in the high frequency loop. However, measurement modelling or regression analysis was absent from the above published literature, except from the work of Fabricus et al.17and Chassaing et al.52. It has been recently stated that the inherent non-uniform primary current distribution of the rotating disc electrode precludes measurement modelling40. The results presented in Figure 5-67 will be compared with those in the literature to confirm the validity of EIS spectra recorded with the RCE. However, since there are no RCE data in the literature except the data from Nava et al.25 who used 15.7mM cupric ions in 1M H2SO4; this comparison will be made with data recorded with RDE’s in the literature. It can be seen in Figure 5-67 that the electrolyte (0.567M CuSO4, 1.6M H2SO4 and 25mg/L chloride ions at 45oC) resistance is about 0.6ohm.cm2 where the curve crosses the imaginary impedance (See Figure 5-57). This result correlates well with that of Kelly et al.8 who reported 0.5ohm.cm2 for 0.25M CuSO4, 1.8M H2SO4 and 50mg/L chloride ions using a RDE at 25oC. Figure 5-67 indicates that at 45oC the Rct from the simulated data at 25 rpm and 30mA/cm2 is equal to 1.45ohm.cm2 and at 25rpm and 34.2mA/cm2 is equal to 1.4ohm.cm2. It would be expected that the Rct would decrease at the higher current density, as is observed. 139.
(26) The charge-transfer resistance, Rct, for the high frequency loop can also be obtained from the studies of Kelly et al.8 and Gabrielli et al.14 Kelly et al.8 obtained Rct values of about 1.97ohm.cm2 at 400rpm and 36mA/cm2 and 1.47ohm.cm2 at 2500 rpm and 43mA/cm2. These values do not exactly correlate with the data produced by Gabrielli et al.14 who obtained 1.7ohm.cm2 at 100 rpm and 25mA/cm2 using also a RDE at 25oC for the same cupric ions and sulfuric acid concentrations as used by Kelly et al.8 but with a concentration of chloride ions of 35mg/L. The Rct results presented in this section with the RCE broadly correlate with the Rct data reported in the preceding paragraph where RDEs were used. The RCE results at 25rpm (laminar flow with 2-3 vortexes)54 and with 0.567M CuS04 in 1.6M H2SO4 at 45oC gave faster copper deposition kinetics (lower Rct value) than the RDE (laminar flow) data obtained from 0.25M CuSO4 in 1.8M H2SO4 at 25oC as would be expected given the lower concentration of cupric ions and temperature in the latter study. The low frequency loop is more complex and less understood in terms of the number and nature of the parameter values. It depends on the surface preparation of the substrate, growth mode55 of the deposit including its crystallographic orientation, hydrodynamic conditions and current density56. The cylindrical diffusion produced by the rotating cylinder electrode results in the relatively constant imaginary impedance component3, 41 and therefore the RCE appears highly sensitive to surface roughness in the low frequency range as will be shown in the next Sections.. It is stated by. Macdonald4 that the roughness of an electrode may lead to a frequency dispersion of the interface, the lines of electric force do not converge evenly on that surface and therefore the double-layer will be charged unevenly. The simulated data of the low frequency range in Figure 5-67 also shows the difference between the diffusion of cupric ions across the concentration boundary layer: more cupric ions at 30mA/cm2 yields a reduced amount of charge-transfer resistance than that at 34.2 mA/cm2. This observation is similar to that presented by Kelly8. It is therefore concluded that EIS data presented in this thesis using the RCE are valid. The results are in agreement with mechanistic studies for single electron transfer 140.
(27) steps that have equivalent circuits that consist only of capacitors and resistors and exclude an inductive loop. The charge-transfer resistance values for the high frequency loop are consistent with the rate of copper deposition at different current densities. The noise level predominantly observed in the low frequency region in the present study appears be inherent to deposition processes since the nucleation and growth of the deposit is different in the presence and absence of organic additives. This hypothesis will be shown in the following Sections where the presence and absence of both Guar and APAM are evaluated.. 5.7 Electrochemical Impedance Spectroscopy Results in the Presence of Activated Polyacrylamide at -470mV vs. MSE and 45oC. These tests were conducted to determine the effect of APAM ageing on the kinetics of copper deposition. The EIS tests on freshly plated copper were carried out every hour for 7-hours. Figure 5-68 presents the EIS response over the 7-hour period and shows a sequential increase of the charge-transfer resistance in the high frequency ranges. The monotonic increase in the high frequency range is possibly due to the ageing process of APAM in the cupric ion-sulfuric acid electrolyte at 45oC, i.e., additional hydrolysis of the block copolymer backbone and reduction of its molecular weight. Grchev et al.50 found the surface coverage at 2-3ppm polyacrylamide concentration decreased from about 0.52, 0.3, 0.2 to 0.02 as the polyacrylamide molecular weight increased from 5x10³, 2.2x10⁴, 2.25x10⁵ and 1.5x10⁶, respectively.. (see also Section 2.6.3 –. Polyacrylamide Adsorption Mechanism). It was also found by Radeva et al.57 that the adsorbed layer thickness of 4% and 12% hydrolysed polyacrylamide has a flatter conformation than that of nonionic or neutral polyacrylamide.. 141.
(28) 1.6 1.4 -Z Im [ohm .c m2 ]. 1.2 1 0.8 0.6 0.4 0.2 0 0. 0.2 0.4 0.6 0.8. 1. 1.2 1.4 1.6 1.8. 2. 2.2 2.4 2.6 2.8. 3. Z Re [ohm.cm2] Figure 5-68: Complex-Plane Plots of Experimental EIS in the Presence and Absence of APAM at -470mV vs. MSE and 45oC. Legend: o - Black – Control – without APAM; o blue, 0.5 Hrs; o red, 1Hr; o green, 2Hrs; ♦ blue, 3Hrs; ♦ red, 5 Hrs; ♦ green, 6 Hrs and □ blue, 7 Hrs Residence Time of APAM in Electrolyte at 45oC. Overpotential: 93mV vs. SHE. 142.
(29) Figure 5-68 also shows that in the low frequency range, ZIm is approximately This is consistent with the work of Lasia3 and. constant or changes very slowly.. Jacobsen41 who solved the cylindrical diffusion equations and concluded that cylindrical diffusion gives an almost constant imaginary impedance component in the low frequency range. Figure 5-69 shows a subset of the experimental data (dots) from Figure 5-69 and simulated data (line) at -470mV versus SME (93mV vs. SHE) which corresponds to about 30mA/cm2 in the absence of APAM. Two data sets are presented; one in the absence of APAM and the other is for the experiment after 2 hours residence time of APAM in the electrolyte.. 1.6 RCE 25rpm, -470mV vs MSE and 2mg/L APAM 1.4. -Z Im [ohm.cm2]. 1.2 1 0.8 APAM - 2Hrs R. Time 0.6 0.4 0.2 0 -0.2 0.5. Control - without APAM 0.75. 1. 1.25. 1.5. 1.75. 2. 2.25. 2.5. 2.75. 3. 2. Z Real [ohm.cm ]. Figure 5-69: Complex-Plane Plot of Experimental and Simulated Impedance Spectra in the Presence and Absence of APAM at -470mV versus MSE and 45oC. Overpotential: 93mV vs. SHE.. Table 5-27 shows the variation of the calculated charge-transfer resistance, double-layer capacitance and current density in the presence and absence of APAM for 143.
(30) periods up to seven hours residence time of APAM in the electrolyte. Table 5-27 also shows that the current density decreased in the presence of APAM. Figures 5-70 and 571 depict the effect of time on the value of these parameters. LEVM28, ZSipmWin™36 and Voltamaster458 give approximately the same parameter values for the high frequency loop. The low frequency loop is more complex and less understood since the fitting process fails to simulate the cylindrical diffusion produced by the rotating cylinder electrode.. However the difference between the presence and absence of. APAM can be assessed qualitatively in the low frequency loop: APAM also increases diffusion impedance, “the kind of resistance to mass transfer”1. Table 5-27: Results for APAM at 45oC and -470mV CD versus MSE Charge-Transfer Resistance (P4) Double-Layer Capacitance (P5) C. Density Hours Ohm.cm2 Std. Dev. μF/cm2 Std. Dev. mA/cm2 0(Nil) 0.89 1.43E-02 1.04E-04 3.80E-07 30 0.5 0.96 1.98E-02 1.01E-04 5.23E-07 27 1 1.16 1.47E-02 9.57E-05 3.87E-07 27 2 1.20 1.46E-02 9.57E-05 3.84E-07 25 3 1.20 1.39E-02 8.98E-05 3.64E-07 26 5 1.26 1.41E-02 9.52E-05 3.74E-07 25 6 1.27 1.44E-02 9.37E-05 3.80E-07 25 7 1.31 1.35E-02 9.51E-05 3.56E-07 25 The main elementary phenomena which take place at the electrode interface are the heterogeneous kinetics of the two one-electron steps reactions, mass transport and above all diffusion. It is not clear whether species adsorbed on the surface including APAM are located on macroscopic areas where the reactant species diffuse through the Nernst layer or that the species including APAM are adsorbed on active sites, i.e., the protruding sites.. 144.
(31) 1.40. Charge-Transfer Resistance, Ohm.cm^2. 1.20. 1.00. 0.80 Control - Without APAM 0.60. 0.40. 0.20. 0.00 0. 0.5. 1. 1.5. 2. 2.5. 3. 3.5. 4. 4.5. 5. 5.5. 6. 6.5. 7. APAM Residence Time in Electrolyte at 45C, Hours. Figure 5-70: Effect of Time on Simulated Charge-Transfer Resistance (P4) in the Presence of APAM at -470mV DC versus MSE at 45oC. 1.20E-04. Control - Without APAM. Double-Layer Capacitance, uF/cm^2. 1.10E-04. 1.00E-04. 9.00E-05. 8.00E-05. 7.00E-05 0. 0.5. 1. 1.5 2 2.5 3 3.5 4 4.5 5 5.5 APAM Residence Time in Electrolyte at 45C, Hours. 6. 6.5. 7. Figure 5-71: Effect of Time on the Simulated Double-Layer Capacitance (P5) in the Presence of APAM at -470mV DC vs. MSE and 45oC. 145.
(32) The ageing trend clearly indicates that APAM increased charge-transfer resistance and decreased the double-layer capacitance and that this effect persisted over 7 hours at 45oC. This result is consistent with electrowinning results where 1mg/L APAM was dosed once for 6 and 12 hours at 45oC where smoother deposits were obtained with APAM than with Guar (Chapter 4). The results presented above with APAM will be compared with similar studies recently published in the literature.. These studies often refer to the effect of. polyethylene glycol (PEG), an inhibitor/surfactant, on copper deposition for the damascene process. Gabrielli et al.14 studied the effect of PEG and chloride ions on the deposition of copper using a RDE and obtained about 1.7ohm.cm2 as the charge-transfer resistance in the high frequency loop at 100rpm, at a current density of 25mA/cm2 at 25oC using 0.25M CuSO4, 1.8M H2SO4 and 60mg/L chloride ions in the absence of PEG. When 300mg/L PEG was added to the system, this charge-transfer resistance decreased from 1.7 to about 1.2ohm.cm2. These EIS results are inconsistent with Cyclic Voltammetry tests that indicate that PEG polarizes the elecrode10-12, 24, 59, 60 and hence the reduction of the Rct. In contrast, Figure 5-68 shows the increase in the charge-transfer resistance in the high frequency loop on addition of 2mg/L APAM. It is widely known that the high frequency loop represents the region of kinetic control1 and PEG did not show this inhibition/levelling behaviour in this loop. It is thought that EIS tests with PEG at an RDE should also indicate an increase in the charge-transfer resistance in the high frequency loop. The effect of PEG and APAM on the low frequency loop is similar. The chargetransfer resistance may also be deduced from the low frequency loops (2 loops) as described qualitatively by Gabrielli et al.14. Their induction loop14 is not considered since theoretical studies of two single-electron transfer steps do not include its presence21. Gabrielli et al.14 showed that the charge-transfer resistance increased from about 1.2ohm.cm2 in the absence of PEG to 2ohm.cm2 in its presence. This increase of the charge-transfer resistance in the low frequency loops is consistent with the results for APAM described above. 146.
(33) 5.8 Electrochemical Impedance Spectroscopy Results in the Presence of Guar at -490mV vs. MSE and 45oC. In this Section, the effect of the ageing process of Guar in the electrolyte at 45oC on the parameter values of the equivalent circuit is presented. Appendix C shows all the experimental data and measurement models for the ageing process of Guar in the electrolyte determined every hour for up to 5hours. Figure 5-72 shows the complexplane plot after 2-hours residence time of Guar in the electrolyte and in its absence.. RCE 25rpm, -490mV vs. MSE and 2mg/L Guar. -Z Im [ohm.cm2]. 0.8. 0.6 Control - without Guar. 0.4. 0.2 Guar - 2 Hrs R Time. 0. -0.2 0.5. 0.75. 1. 1.25. 1.5. 1.75. 2. 2. Z Real [ohm.cm ]. Figure 5-72: Complex-Plane Plot of Experimental and Simulated Impedance Spectra at 45oC in the Presence and Absence of Guar. Overpotential: 113mV vs. SHE. Table 5-28 shows the charge-transfer resistance (P4) and double-layer capacitance (P5) values and their relative standard deviation for the high frequency loop only calculated by LEVM28. The EIS experiments were measured potentiostatically and therefore the current density varied slightly between tests. Table 5-28 also shows that the current density (34mA/cm2) obtained in the absence of Guar slightly increased in its presence. The 147.
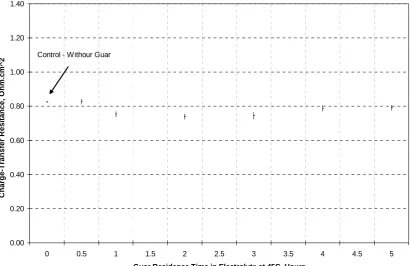
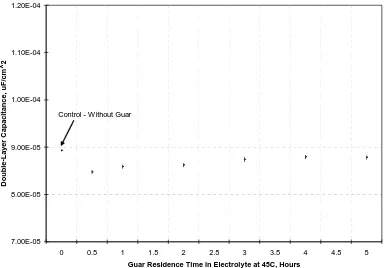
(34) mechanism for this increase is not understood but it indicates that Guar does not behave as a levelling agent since a levelling agent polarizes the electrode and therefore at constant potential should decrease the current density. This result is consistent with the de-polarization behaviour of Guar observed from Cyclic Voltammetry tests. Figures 5-73, 5-74 and Table 5-28 summarize the effect of the ageing process of Guar in the electrolyte in terms of its change on charge-transfer resistance and doublelayer capacitance over 5-hours. Table 5-28: Simulation Results for Guar at 45oC and -490 mV DC versus MSE Charge-Transfer Resistance (P4)Double-Layer Capacitance (P5) C. Density Hours Ohm.cm2 Std. Dev μF/cm2 Std. Dev. mA/cm2 Nil 0.83 0.50E-02 8.93E-05 2.05E-07 34 0.5 0.83 1.59E-02 8.47E-05 4.21E-07 35 1 0.75 1.67E-02 8.59E-05 4.34E-07 39 2 0.74 1.66E-02 8.62E-05 4.35E-07 40 3 0.75 2.03E-02 8.74E-05 5.36E-07 40 4 0.79 1.67E-02 8.79E-05 4.41E-07 38 5 0.79 1.66E-02 8.78E-05 4.38E-07 38 Figure 5-73 shows that the effect of Guar on charge-transfer resistance is relatively small, but a reduction in charge-transfer resistance is apparent after 1-hour. Therefore Guar confers little or no effect on the charge-transfer resistance. The scale used for the charge-transfer resistance shown in Figure 5-73 is the same as used for APAM to allow a direct comparison. Figure 5-74 shows that Guar reduces the double-layer capacitance. As the residence time increases, this effect becomes progressively less pronounced.. The. reduction of the double-layer capacitance in the presence of additives is consistent with the literature61, 62.. 148.
(35) 1.40. Charge-Transfer Resitance, Ohm.cm^2. 1.20 Control - Withour Guar 1.00. 0.80. 0.60. 0.40. 0.20. 0.00 0. 0.5. 1. 1.5. 2. 2.5. 3. 3.5. 4. 4.5. 5. Guar Residence Time in Electrolyte at 45C, Hours. Figure 5-73: Effect of Time on Charge-Transfer Resistance in the Presence of Guar at 45oC. It has been shown from CV tests (Section 5.3) that Guar depolarizes the electrode and from EIS tests it slightly decreases the charge-transfer resistance or polarization resistance. This result will be discussed by comparison with the effect of chloride ions on copper deposition. Sulfate ions, SO42- rather than bisulfate ions, HSO4are adsorbed on copper even though the latter is the predominant species in a cupric ionsulfuric acid electrolyte63, 64. However, chloride ions are more strongly adsorbed on the surface of the cathode than sulfate ions causing the reduction of Cu+ to Cu to become the rate limiting step instead of Cu2+ to Cu+46, 56 and therefore sulfate ions are displaced by chloride ions63. Gabrielli et al.53 in a very recent study also indicated that chloride ion is a depolarizer. It is then concluded from the literature that chloride ions depolarize the electrode.. 149.
(36) 1.20E-04. Double-Layer Capacitance, uF/cm^2. 1.10E-04. 1.00E-04 Control - Without Guar. 9.00E-05. 8.00E-05. 7.00E-05 0. 0.5. 1. 1.5. 2. 2.5. 3. 3.5. 4. 4.5. 5. Guar Residence Time in Electrolyte at 45C, Hours. Figure 5-74: Effect of Time on the Double-Layer Capacitance in the Presence of Guar. It was shown in Chapter 4 that Guar increases surface roughness and Ilgar and O’Keefe65 also have shown that chloride ions also increases surface roughness. It is widely known that the competition between nucleation and growth controls the smoothness of the deposit: the higher the nucleation rate; the finer the crystal size45. It can be therefore concluded that the presence of Guar and chloride ions increase the growth rate of copper rather the nucleation rate. In contrast, the form of the growing crystals determines the physical appearance and structure: for a higher growth rate of the crystal size normal to the substrate, a more fibrous structure is obtained. It will be shown in Chapter 6 that the cross-section of a copper deposit produced with Guar possesses a porous structure. The experimental Cyclic Voltammetry and EIS results correlate and indicate that Guar further depolarizes the electrode beyond that caused by chloride ions.. 5.9 Electrochemical Impedance Spectroscopy Results in the Presence of Activated Polyacrylamide at -490mV vs. MSE and 45oC. These tests were conducted to determine the effect of APAM on the kinetics of copper deposition at potentials more cathodic than -470mV versus MSE (93mV vs. 150.
(37) SHE). This testwork at -490mV vs. MSE was conducted to compare APAM with Guar under the same experimental conditions. Separate EIS testwork was also conducted using a rotating disc electrode (RDE) to determine the behaviour of the charge-transfer resistance in the high frequency loop. Figure 5-75 shows the complex-plane plot at -490mV versus MSE (113mV vs. SHE) which corresponds to about 34mA/cm2 with and without APAM using the RCE. The EIS results obtained every hour are shown in Appendix B. Figure 5-75 also shows a constant imaginary impedance component at low frequencies as described in Section 5.7. The gap observed in the low frequency range was attributed to 50Hz mains power noise. Table 5-29 presents the values of the charge-transfer resistance and the doublelayer capacitance up to four hours. Figures 6-76 and 6-77 depict the effect of time on the value of these parameters.. Table 5-29: Results for APAM at -490mV CD versus MSE and 45oC Charge-Transfer Resistance (P4)Double-Layer Capacitance (P5) C. Density Hours Ohm.cm2 Std. Dev. Hours μF/cm2 mA/cm2 0(Nil) 0.79 1.64E-02 1.046E-04 4.35E-07 34 0.5 0.96 1.98E-02 1.01E-04 5.23E-06 31 1 0.96 1.92E-02 9.78E-05 5.09E-07 30 2 0.99 1.76E-02 9.55E-05 4.66E-07 30 3 1.02 1.62E-02 9.30E-05 4.29E-07 29 4 1.01 1.63E-02 9.29E-05 4.28E-07 29. 151.
(38) 1.5 RCE 25rpm and -490mV DC vs MSE 1.25 2 mg/L APAM. -Z Im [ohm.cm2]. 1. APAM - 2Hrs. R.Time. 0.75 0.5 0.25 0. Control - without APAM. -0.2. 0. 0.25. 0.5. 0.75. 1. 1.25. 1.5. 1.75. 2. 2.25. 2.5. 2. Z Real [ohm.cm ]. Figure 5-75: Complex-Plane Plot of Experimental and CNLS Simulated Impedance Spectra in the Presence and Absence of APAM at -490mV versus MSE and 45oC. Overpotential: 113 vs. SHE.. 1.40. Charge-Transfer Resistance, Ohm.cm^2. 1.20. 1.00. 0.80. 0.60 Control - without APAM 0.40. 0.20. 0.00 0. 0.5. 1. 1.5. 2. 2.5. 3. 3.5. 4. APAM Residence Time in Electrolyte at 45C, Hours. Figure 5-76: Effect of Time on the Simulated Charge-Transfer Resistance in the Presence of APAM at -490mV DC versus MSE and 45oC.. 152.
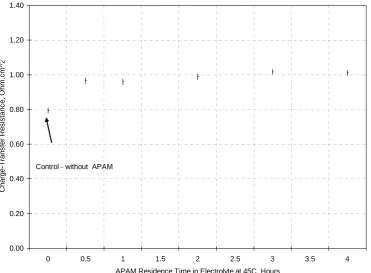
(39) 1.20E-04 Control - without APAM. Double-Layer Capacitance, uF/cm^2. 1.10E-04. 1.00E-04. 9.00E-05. 8.00E-05. 7.00E-05 0. 0.5. 1. 1.5. 2. 2.5. 3. 3.5. 4. APAM Residence Time in Electrolyte at 45C, Hours. Figure 5-77: Simulated Double-Layer Capacitance versus Time in the Presence of APAM at 490mV DC versus MSE and 45oC.. The increase in the charge-transfer resistance in the high frequency range is possibly due to the ageing process of APAM in the cupric ion-sulfuric acid electrolyte at 45oC through additional hydrolysis of the block copolymer backbone and reduction of its molecular weight. Figure 5-77 indicates also that the double-layer capacitance steadily decreases up to 3 hours then it levels off at about 4 hours. This trend was also observed at -470mV vs. MSE overpotential where tests where conducted up to 7 hours and fully described in Section 5-7.. Figure 5-78 compares the complex-plane plots for 2-hours aged APAM and 2hours aged Guar, and Nil additives at -490 mV vs. MSE at 45oC using the RCE. It can be seen that the charge-transfer resistance is greatest in the presence of APAM and least in the presence of Guar.. 153.
(40) 1.5 RCE 25rpm, -490 mV DC vs MSE, 2mg/L Additives. -Z Im [ohm.cm2]. 1.25. 1 Nil Additives (black) 0.75 APAM - 2Hrs Residence Time (red) 0.5. 0.25. 0 -0.2 0.5. Guar - 2Hours Residence Time (blue) 0.75. 1. 1.25. 1.5. 1.75. 2. 2.25. 2.5. 2.75. 2. Z Real [ohm.cm ]. Figure 5-78: Comparison of Complex-Plane Plot of Experimental and Simulated Impedance Spectra in the Presence of both APAM and Guar at -490mV DC and at 45oC. Legend: Black – 340A/m2 CD in the Absence of APAM and Guar. APAM (red dots and line) increases the charge-transfer resistance and Guar (blue dots and line) decreases the chargetransfer resistance.. A short set of EIS experiments were undertaken on an RDE to compare with the results on a RCE. The rationale for doing this was the fact that no published EIS data have been collected on both electrodes. Figure 5-79 shows the EIS results using the rotating disc electrode (RDE). The EIS testwork with the RDE started at 50kHz as in the experiments conducted by Kelly et al.8 and with the RCE at 30kHz. Figure 5-79 shows the ageing of APAM in the electrolyte also increases the charge-transfer resistance in the high frequency loop up to six hours.. The other. important findings from Figure 5-79 are: (i) the electrolyte resistance, Rs, is constant with and without the presence of APAM and (ii) The Rs value with the RDE is about one-half of that obtained with the RCE (Figure 5-76). The reasons for this difference are unclear but the electrolyte/electrode interface must be at steady-state during the 154.
(41) presence and absence of additive. Therefore, a difference can be expected in the presence and presence of additives due to inhibition (surface coverage). However, there is a clear difference for the RDE with APAM at 45oC and with PEG at 25oC. The presence of PEG at 25oC reduced the charge-transfer resistance as discussed in Section 5.7 but the presence of APAM at 45oC increased the charge-transfer resistance at the RDE and RCE.. 0.7 0.6. -Z Im [ohm.cm2]. 0.5 0.4 0.3 0.2 0.1 0 0.2. 0.4. 0.6. 0.8. 1. 1.2. 1.4. 1.6. 2. Z Real [ohm.cm ]. Figure 5-79: Complex-Plane Plot using RDE at -490mV vs. MSE, 25rpm and 45oC (503Hz0.2Hz). Legend: Black – Control without APAM, Blue – 1 Hrs, Red – 3Hrs. and Green – 6Hrs.. The EIS response presented in Figure 5-79 cannot be simulated using the equivalent circuit presented in Figure 5-56 possibly due to convection and low stirring affecting the diffusion in the low frequency range. Moreover, the non-uniform current distribution inherent to the RDE may also influence the formation of the inductive type EIS data in the low frequency loop. The Ohmic resistance in solution determines the primary current distribution, which then becomes a unique function of cell geometry38. It has been also observed in Sections 5.4 and 5.5 that the electrode kinetics of copper electrodeposition is faster on pre-plated copper than on bare stainless steel. Therefore, the problem of the non-uniform primary current distribution inherent to the RDE may have become more serious due to the faster reaction, large current density and large disc (0.178cm2)38. In contrast, the motivation to use the RCE was to achieve a uniform 155.
(42) metal distribution during the electrodeposition process. Nevertheless, it has been shown that APAM increased the charge-transfer resistance in the high frequency loop whether RCE or RDE was used.. 5.10 Electrochemical Impedance Spectroscopy Results in the Presence of Activated Polyacrylamide at -445mV vs. MSE at 65oC. These EIS tests were run using RCE and RDE at 65oC, the copper electrorefining electrolyte temperature. The RCE was used for nil APAM and at 0.5, 2 and 5hours APAM residence time in the electrolyte. The RDE was used for nil APAM and at 1, 3 and 6hours APAM residence time in the electrolyte. The speed of rotation of both electrodes were 25rpm. These runs were carried out by simply replacing the RCE shown in Figure 5-59 by an RDE of the same height. Figure 5-80 shows the complexplane plot at -445mV vs. SME which corresponds to about 50mA/cm2 in the absence of APAM at 65oC for the RCE. The EIS spectra obtained for 0.5 and 5 hours are also presented in Appendix B.. 0.9 0.8. RCE 25rpm, - 445mV DC vs. MSE and 2mg/L APAM. -Z Im [ohm.cm2]. 0.7 0.6. APAM - 2Hrs R. Time. 0.5 0.4 0.3 0.2 0.1 0 -0.1 0.4. Control - without APAM 0.6. 0.8. 1. 1.2. 1.4. 1.6. 1.8. 2. Z Real [ohm.cm ]. Figure 5-80: Complex-Plane Plot of Experimental and CNLS Simulated Impedance Spectra in the Presence and Absence of APAM at -445mV versus MSE and 65oC. Overpotential: 90mV vs. SHE.. 156.
(43) Figure 5-80 clearly shows that the presence of APAM at 2-hours residence time in the electrolyte increases the charge-transfer resistance in the high frequency loop as also found in Sections 5.7 and 5.9. Table 5-30 presents the charge-transfer resistance and double-layer capacitance for this testwork. Figures 5-81 and 5-82 depict the data presented in Table 5-30.. Table 5-30: Results for APAM at 65oC and -445mV CD versus MSE Hours Nil APAM 0.5 2 5. Charge-Transfer Resistance (P4)Double-Layer Capacitance (P5)C. Density Ohm.cm2 Std. Dev. μF/cm2 Std. Dev. mA/cm2 0.39 2.91E-02 1.84E-04 7.76E-06 50 0.73 2.08E-02 1.16E-04 5.53E-06 34 0.74 2.02E-02 1.13E-04 5.32E-06 33 0.69 2.12E-02 1.16E-04 5.60E-06 34. 1.40. Charge-Transfer Resistance, Ohm.cm^2. 1.20. 1.00. 0.80. 0.60. 0.40. 0.20 Control - without APAM 0.00 0. 0.5. 1. 1.5. 2. 2.5. 3. 3.5. 4. 4.5. 5. APAM Residence Time in Electrolyte at 65C, Hours. Figure 5-81: Effect of Time on the Simulated Charge-Transfer Resistance (P4) in the Presence of 2mg/L APAM at 65oC and -445mV DC vs. MSE. 157.
(44) 2.10E-04. Control - without APAM. Double-Layer Capacitance, uF/cm^2. 1.90E-04. 1.70E-04. 1.50E-04. 1.30E-04. 1.10E-04. 9.00E-05. 7.00E-05. 5.00E-05 0. 0.5. 1. 1.5. 2. 2.5. 3. 3.5. 4. 4.5. 5. APAM Residence Time in Electrolyte at 65C, Hours. Figure 5-82: Effect of Time of the Simulated Double-Layer Capacitance (P5) in the Presence of 2mg/L APAM at 65oC and -445mV DC vs. MSE.. The noise in the low frequency loop is not clearly understood. It may be due to non-steady state conditions of the electrochemical crystal growth process and surface topography45 and to the fluid flow of the system. Different impedance features can be observed on single crystals with and without screw dislocations45. It will be recalled (Sections 3.2.3 and 3.2.4) that at Reynolds number of approximately 200, a transition from laminar to laminar with vortexes occurs. Accordingly, since Reynolds number increases from 204 at 45oC to 293 at 65oC, a significant change in the fluid flow is likely which may account for the increased noise at 65oC due to the unstable and superimposed Taylor vortices.. Figure 5-83 shows the EIS results using the rotating disc electrode (RDE). It can be seen than the ageing of APAM in the electrolyte occurs more rapidly and increased the charge-transfer resistance in the high frequency loop from the first hour to 3-4hours and then decreases at 6-hours residence time. This trend of APAM was also observed from the CV results at 65oC, Figure 5-65 and the EIS results using the RCE at 65oC, Figure 5-81.. However, these curves also cannot be simulated using the. equivalent circuit presented in Figure 5-56. However, Figure 5-83 shows that APAM 158.
(45) increases the charge-transfer resistance in the high frequency loop whether RCE or RDE is used at 45oC and 65oC and the electrolyte resistance, Rs is constant with and without APAM.. 0.7 0.6. -Z Im [ohm.cm2]. 0.5 0.4 0.3 0.2 0.1 0 0.2. 0.4. 0.6. 0.8. 1. 1.2. 1.4. 1.6. 2. Z Real [ohm.cm ]. Figure 5-83: Complex-Plane Plot using RDE at -445mV vs. MSE, 25 rpm and 65oC (503 Hz0.2Hz). Black – Control without APAM, Blue – 1 Hrs, Red – 3Hrs. and Green – 6Hrs.. 5.11. Discussion and Conclusions. It was seen by Cyclic Voltammetry that Guar de-polarized the electrode on both stainless steel and pre-plated-copper (Section 6-3). It was also seen that there was a trend in depolarization behaviour as measured by Cyclic Voltammetry. It increases from 0.3-1hour to a maximum at 2-3hours and then its depolarizing activity decayed such that within 4-5hours an insignificant effect was observed on pre-plated copper. The transfer coefficient value of 0.50 in the absence of Guar agrees with that given by Wu and Barkey46 and Mattson and Bockris47. The charge-transfer resistance determined by EIS for Guar also follows the overall trend of the depolarization behaviour of Guar from Cyclic Voltammetry tests.. 159.
(46) In contrast, cyclic voltammetry tests indicate that APAM polarizes the electrode. The maximum polarization at 45oC and 65oC was approximately 14mV but the time to attain this maximum value was about 3.5 hours at 45oC and 1.5 hours at 65oC as shown in Figure 5-66. These results correlate with the fractional factorial experimental results in which it was demonstrated that APAM had a more significant effect on reducing surface roughness at 65oC than at 45oC (See Chapter 4). These results indicate that APAM at 45oC requires about 3.5 hours ageing to produce the smoothest deposit while at 65oC it requires about 1hour. APAM also appeared to confer higher adsorption on pre-plated copper than on stainless steel since the net polarization values are higher for pre-plated copper than for stainless steel at 45o and 65oC. These results are consistent with both APAM acting as a surfactant/levelling agent and doing so for extended periods of time, which is consistent with the results described in Chapter 3 where APAM was dosed once for 6 hours electrowinning time. The complex-plane plots presented in this thesis using a RCE agree with the theoretical work for single-electron step reactions requiring only the presence of resistors and capacitors in the equivalent circuit21. It also agrees with experimental work in the published literature8,. 14, 17, 51-53. where RDEs were used in terms of the. electrolyte resistance and the charge-transfer resistance, Rct, in the high frequency loop. However, measurement modelling or regression analysis were absent from the above published literature, except from the work of Fabricius et al.17and Chassaing et al.52. It has been recently stated that the inherent non-uniform primary current distribution of the rotating disc electrode precludes measurement modelling40. In contrast, the uniform current distribution produced by the RCE is widely documented38. The low frequency loop is more complex and less understood in terms of the number and nature of the parameter values. It depends on the surface preparation of the substrate, growth mode55 of the deposit including its crystallographic orientation, hydrodynamic conditions and current density56. The cylindrical diffusion produced by the rotating cylinder electrode results in the relatively constant imaginary impedance component3, 41. Comparison of Figures 5-69 (-470mV vs. MSE, 30mA/cm2 and 45oC), 5-75 (-490mV, 34mA/cm2, 45oC) and 5-80 (-445mV, 50mA/cm2, 65oC) show that the 160.
(47) noise level in the low frequency loop increases as the current density increases. This indicates that the RCE is highly sensitive to surface roughness in the low frequency range. It is known that the roughness of an electrode may lead to a frequency dispersion of the interfacial impedance4 and the lines of electric force do not converge evenly on the surface. The double layer will therefore be charged unevenly4. This behaviour was more apparent in the presence and absence of Guar than in the presence of APAM. Table 5-31 summarizes the maximum change in the charge-transfer resistance and double-layer capacitance produced by APAM and Guar at 45oC and 65oC. APAM increased the charge-transfer resistance throughout the testwork while Guar reduced it. APAM reduced the double-layer capacitance more than Guar at 45oC. This reduction of the double-layer capacitance increased when the temperature was increased from 45oC to 65oC. These results indicate that APAM is more specifically adsorbed than Guar.. Table 5-31: Maximum Change in Charge-Transfer Resistance and Double-Layer Capacitance Relative to the Presence and Absence of Guar and APAM Additive Guar APAM APAM APAM. mV vs. MSE -490mV and 45oC -470 mV and 45oC -490mV and 45oC -445mV and 65oC. Max. Change in C-T Resistance, Rct, ohm.cm2 -0.086 +0.42 +0.23 +0.34. Max. Change in D-L Capacitance, x 10-5, Cdl, µF/cm2 -0.46 -1.2 -1.2 -6.8. Guar/APAM Residence Time in Electrolyte, Hrs.* 2-3 3-5 3-5 2. *Maximum change determined at these residence times. It was also shown that the effect of temperature on the ageing sequence is consistent with reaction kinetics for polyacrylamide hydrolysis and cleavage, i.e., it is faster at 65oC than at 45oC as would be expected. The EIS data at 65oC and 45oC are consistent with the CV data whether the RCE or RDE was used but the EIS data with the RDE was not amenable to be modelled using the equivalent circuit presented in Figure 5-56. The CV results at 45oC area consistent with the EIS results at 45oC in that Guar depolarizes the electrode or decreases the charge-transfer resistance. In other terms Guar increases the rate of growth rather than the rate of nucleation. In contrast, APAM polarizes the electrode or increases the charge-transfer resistence, promotes nucleation 161.
(48) rate rather than growth rate. These results for APAM were replicated at 65oC. Overall electrowinning tests, crystallite size measurements, Cyclic Voltammetry and Electrochemical Impedance Spectroscopy indicated that Guar depolarises the electrode and, in contrast, APAM polarizes the electrode. Therefore, APAM behaves as a true levelling agent and does so for extended periods of time, which is consistent with the results described in Chapter 3 where APAM was dosed 1mg/L once for 6 hours electrowinning time.. 5.12. References. 1.. Bard AJ, Faulkner L. Electrochemical Methods, Fundamentals and Applications. Second ed. Brisbane: John Wiley & Sons, Inc.; 2001.. 2.. Calvo EJ. The Current-Potential Relationship. In: Bard AJ, Stratmann M, editors. Encyclopedia of Electrochemistry, Volume 2: Interfacial Kinetics and Mass Transport: Wiley-VCH; 2003. p. 3-30.. 3.. Lasia A. Electrochemical Impedance Spectroscopy and Its Applications. In: Conway B, Bockris J, White R, editors. Modern Aspects of Electrochemistry: Kluwer Academic / Plenum; 1999. p. 143-245.. 4.. Macdonald JR, editor. Impedance Spectroscopy Emphasizing Solid Materials and Systems. Brisbane: John Wiley & Sons; 1987.. 5.. Conway B, Bockris J, White R, editors. Electrochemical Impedance Spectroscopy and Its Applications in Modern Aspects of Electrochemistry: Kluwer Academic / Plenum; 1999.. 6.. Macdonald D. Transient Techniques in Electrochemistry: Plenum Press; 1977.. 7.. Grafov BM, Damaskin BB. Theory of Electrochemical Faradaic Impedance for Mixed Electrolyte Solutions. Electrochimica Acta 1996;41(17):2707-2714.. 8.. Kelly J. Copper Deposition in the Presence of Mixed Surfactants [PhD]: Columbia University; 1999.. 9.. Bonou L, Eyraud M, Denoyel R, Massiani Y. Influence of Additives on Cu Electrodeposition Mechanisms in Acid Solution: Direct Current Study 162.
(49) Supported by Non-Electrochemical Measurements. Electrochimica Acta 2002;47(26):4139-4148. 10.. Moffat T, Bonevich J, Huber W, Stanishevsky A, Kelly D, Stafford G, Josell D. Superconformal Electrodeposition of Copper in 500-90 Nm Features. J. Electrochem. Soc. 2000;147(12):4524-4535.. 11.. Moffat TP, Wheeler D, Josell D. Electrodeposition of Copper in the Sps-Peg-Cl Additive System. Journal of the Electrochemical Society 2004;151(4):C262C271.. 12.. Moffat T, Baker B, Wheeler D, Josell D. Accelerator Aging Effects During Copper Electrodeposition. Electrochemical and Solid-State Letters 2003;6(4):C59-C62.. 13.. Feng ZV, Li X, Gewirth A. Inhibition Due to the Interaction of Polyethylene Glycol , Chloride and Copper in Plating Baths: A Surface-Enhanced Raman Study. J. Phys. Chem. B 2003;107:9415-9423.. 14.. Gabrielli C, Kittel J, Mocoteguy P, Perrot H, Zdunek A, Bouard P, Haddix M, Doyen L, Clech MC. A Model of Copper Deposition for the Damascene Process. Proceedings - Electrochemical Society 2003;2003-13(Thin Film Materials, Processes, and Reliability):100-109.. 15.. Vereecken PM, Binstead RA, Deligianni H, Andricacos PC. The Chemistry of Additives in Damascene Copper Plating. IBM Journal of Research and Development 2005;49(1):3-19.. 16.. Fabricius G, Sundholm G. The Effect of Additives on the Electrodeposition of Copper Studied by the Impedance Technique. Journal of Applied Electrochemistry 1984;14:797-801.. 17.. Fabricius G. The Electrochemistry of Copper in Sulfuric Acid in the Presence of Additives [Doctor of Technology Thesis]. Espoo: Helsinki University of Technology; 1995.. 18.. Onicio L, Muresan L. Some Fundamental Aspects of Levelling and Brightening in Metal Electrodeposition. Journal of Applied Electrochemistry 1991;21:565574.. 19.. Jordan K, Tobias C. The Effect of Inhibitor Transport on Leveling in Electrodeposition. J. Electrochem. Soc. 1991;138(5):1251-1259. 163.
(50) 20.. Chung D. Localized Adsorption of Organic Additives During Copper Electrodeposition [Ph.D.]. Urbana-Champaign: University of Illinois; 1996.. 21.. Harrington DA, van den Driessche P. Equivalent Circuits for Some Surface Electrochemical Mechanisms. Journal of Electroanalytical Chemistry 2004;567(2):153-166.. 22.. Franceschetti DR, Macdonald JR. Diffusion of Neutral and Charged Species under Small-Signal A.C. Conditions. J. Electroanal. Chem. 1979;101:307-316.. 23.. Mansfeld F, Shih H, Greene H, Tsai C. Analysis of Eis Data for Common Corrosion Processes. In: Scully JR, Silverman DC, Kending MW, editors. Electrochemical Impedance: Analysis and Interpretation; 1993; 1993. p. 37-53.. 24.. Jovic VD, Jovic BM. Copper Electrodepositon from Copper Acid Baths in the Presence of Polyethylene Glycol and Sodium Chloride. J. Serb. Chem. Soc. 2001;66(11-12):935-952.. 25.. Nava de Oca J, Sosa E, Ponce de Leon C, Oropeza M. Effectiveness Factors in an Electrochemical Reactor with Rotating Cylinder Electrode for the AcidCupric/Copper Cathode Interface Process. Chemical Engineering Science 2001;56(8):2695-2702.. 26.. Diard JP, Montella C. Diffusion-Trapping Impedance under Restricted Linear Diffusion Conditions. Journal of Electroanalytical Chemistry 2003;557:19-36.. 27.. Brett CMA, Brett AMO. Electrochemistry, Principles, Methods and Applications. New York; 1993.. 28.. Macdonald J. Levm Manual - Complex Nonlinear Least Squares (Cnls). In. 8.0 ed; 2003.. 29.. Gabrielli C. Electrochemcial Impedance Spectroscopy: Principles, Instrumentation and Applications. In: Rubinstein I, editor. Physical Electrochemistry. New York: Marcel Dekker, Inc; 1995. p. 243-292.. 30.. Madore C, Agarwal P, Landolt D. Blocking Inhibitors in Cathodic Leveling Iii. Electrochemical Impedance Spectroscopy Study. J. Electrochem. Soc. 1998;145(5):1561-1565. 164.
Figure


+7

Related documents
Using a closed- and open-ended administered questionnaire, data was then collected on motivation packages available to public primary and secondary teachers;
3 Department of Orthodontics, RRDCH, Bangalore, India. During the usual course of daily living the host may be invaded by microbes possessing various harmful qualities, or the host
Therapy at Three Points in Tuberculosis (SAPIT), Cambodian Early versus Late Introduction of Antiretrovirals (CAMELIA), and The AIDS Clinical Trial Group (ACTG) Study
With ageing in humans there is a decline in the number of naïve cells, an increase in the ratio of memory to naïve cells [4], the number of memory T cells [19,20], and the ratio of
This article focuses on electrodeposition of CIS polycrystalline thin film on ITO glass (indium- tin oxide) substrates by pulse electrochemical deposition technique from
Ewing sarcoma: Effect of area (compared to Inner London) on mortality at 1 year post diagnosis, adjusted for age and sex and Townsend score, unemployment or non-car ownership
The formerly reported lutetium potentiometric electrodes [5-7] in terms of selectivity, dynamic linearity range, detection limit, response time, and pH range were compared in Table
Platinum Nanoparticles (PtNPs ) With Poly (Tyramine) - Choline Oxidase (ChOx) Film for the Electrocatalysis Of Choline.. Ying Li, Jia-Xuan Wei , Shen-Ming
