Geographical variation in the growth rate of the hermatypic coral Porites in the Great Barrier Reef Province, Australia
173
0
0
Full text
(2) GEOGRAPHiC/\L VARI.i\TIOtl IN THE GROWTH RATE OF THE f!ERj·!l'ITYPIC CORAL PORITES ! N THE GEE/H BARR! ER REEF PROV I NCE, AUSTRALI A. Thesis submitted by. Peter James ISDALE BA(Hons). in December 1981. for the Degree of Doctor of Philosophy in the Department of Geography at ,James Cook Un i vers i ty of North Queens 1and.
(3) STATEMENT OF ACCESS. I, the undersigned author of this work, understand that James Cook University will make this thesis available for use within the University Library and, via Australian Research Online, for use elsewhere.. I understand that, as an unpublished work, a thesis has significant protection under the Copyright Act and;. I do not wish to place any further restriction on access to this work Or. I wish this work to be embargoed until. Or I wish the following restrictions to be placed on this work:. _______________________________. _____________________________. Name (please print). Signature. ___________________ Date.
(4) DECLARATION. I declare that this thesis is my own work and has not been submitted in any form for another degree or diploma at any other university or institute of tertiary education.. Information. derived from the publ ished or unpubl ished work of others has been acknowledged in the text and a list of references is given.. P.J. ISDALE 22 December 1981.
(5) ABSTRACT This thesis examines the growth rate of 452 colonies of the massive reef-building coral Porites from the Great Barrier Reef Province,. Au~tralia.. The corals were collected from thirty-four. different reefs, and from different zones within those reefs. Five species of the genus were used in the project, each being a massive, hemispherical form, with a relatively smooth surface, small corall ites, and a readily-identifiable point of origin of colonial growth. The mean annual growth rate for each colony was measured using X-radiography of coral sections, and densitometry on the X-ray plates. The density variations found within the coral skeleton were used to identify periods of lunar and seasonal. extension.. Growth was. measured radially, along maximum colony diameter. The time of deposition of maximum density skeleton was found to differ with latitude, occurring In October/November in the south of the Province, but later, In April, north of Cooktown. Colony growth rate was found to vary by a factor of two on a year to year basis, and that of simi lar colonies. varied, even under !'uniform'! conditions. Despite this, broader patterns of growth rate variation were found within the Province.. Colony growth varied. according to location on reef platforms, with maximum rates on the leeward reef flat and slowest growth on the more exposed central reef flat and windward crest areas.. Growth was faster and more variable on. the fringing reefs of the inner continental shelf than at the outer barrier, where rates were depressed and stable.. Annual growth also. varied with depth and according to species. Examination of the spatial patterns of growth variability at each of the scales employed provides a background to the discussion.
(6) of the relationships between scleractinian skeletogenesis and environmental and genetic factors.. These findings are discussed in. the context of modern reef investigations, in the light of their contribution to the study of reef development within the Province..
(7) ACKNOWLEDGEMENTS To the many people \<Jho helped \<Jith the product(on of this thesis, from the fieldwork to the finished article, grateful thanks are extended.. Thanks are especially due to:. Associate Professor D. Hopley, under whose supervision this thesis was completed. Professor J. 01 iver and the staff of the Geography Department, James Cook University, my colleagues. Dr N. Harvey, Mr T. Shearn,. ~\r. C.. Grant, and Mr D. Backshall,. \<Jhose help in the field and the laboratory \<Jas freely given, and much appreciated. Dr A. Hurphy , Dr E. Johnson, and Mr D. Wynn, It/hose tillIe, faci 1 ities and radiographic expertise were indispensable to th i s resea rch. Mr J. Hudson, from DuPont Corporation, for endless suppl ies of X-ray film. Mr D. Duncan,. t~aster. of the R.V. James Kirby, and crew members. of that sturdy vessel, for their friendship, versatil ity, and sterling seamanship. The reef scientists of the North Queensland institutions, James Cook University, A.I .M.S. and G.B.R.M.P.A., who \<Jere ever ready with advice and support.. Among others, Drs D.. Barnes, J. Veron, 1-1. Pichon, D. 'vlllliams, J. Collins, P. Arnold, and A. Spain, and Messrs Len Zell, W. Ellery, A. Birtles, T. Walker and G. Bull deserve special mention..
(8) Mr G.T. Duce and Mr K. Adams, of the Computer Centre, James Cook University, upon whose programming skills I was dependent; and not least My. wife Robby, and our parents, It/ho have put up with so much. for so long, and have been so supportive..
(9) CONTENTS. ABSTRACT ACKNOWLEDGEMENTS LIST OF FIGURES LI ST OF TABLES CHAPTER ONE. INTRODUCTION TO CORAL GROWTH RATE STUDIES Definitions. 3. History of Growth Rate Measurement. 4. Biology of Hermatypic Corals. 7. Influences on Coral Grm'lth Rate. 9. - Temperature. CH,l\PTER nJO. 9. - Sa 1 in i ty. 11. - Depth. 12. - Other Controls. 14. Systematic Controls on Coral Growth. 15. Aims of the St udy. 16. t-1ETHODOLOGY. 20. Introduction. 20. Fieldwork. 20. Taxonomy. 24. Specimen Cutting. 27. X-Radiography. 28. Den s i tome try. 28. Interpretation of Measurements Staining Experiments Statistical Analysis. 41.
(10) CHAPTER THREE. GROWTH RATE VARIATIONS IN A UNIFORM ENV I RON~1ENT. CHAPTE R FOUR. GROWTH RATE VARIATIONS ON A SINGLE REEF. 55. Wheeler Reef and Its Environment. 57. Zonation vs Growth Rate: Hypothesis. 65. Analysis and Results: \vheeler Reef Zonation Study. 68. Discussion. 70. VAR! ATI ON IN GRo\HH RATES BEnvEEN REEFS. 72. SECTION l: Growth Rates on Different Reef Types. 72. CHAPTER FIVE. - Barnett Patches. 73. -Three Isles. 79. - An a 1y sis and Re suI t s. 85. - Discussion. 91. SECTION 2: Variation in Growth Rates Across the Continental Shelf. 92. - Analysis and Results. 94. - Discussion. 96. SECTION 3: Cross-shelf Variation Among Different Reef Types. 99. - Analysis and Results. 100. - DisclJssion. 102. SECTION 4: Cross-shelf Variation on a Provincial Scale~ Terrigenous vs Oceanic Influences. 102. - Analysis and Results. 103. - Discussion. 104. SECTION 5: Other Provincial Scale Variations. 104. - Analysis and Results. 105. - Discussion. 10E.
(11) SECTION 6: Provincial Scale Variation in Month of Mid-Point of HD Band Deposition - In troduct ion. 107. - Analysis and Results. 107. - Discussion. 107. SECTION 7: Latitudinal Variation Among Species. CHAPTER SIX. 107. III. - Analysis and Results. 114. - Discussion. 116. CONCLUSIONS. 116. PATTERNS OF CORAL GROWTH RATES. 118. Introduction. 118. X-Radiography and Density Banding in POY'ite s. I I8. Growth in a Uniform Environment. 123. Growth on Single Reefs. 125. Growth Rates on Contrasting Reef Morphologies. 127. Growth Rates Across the Continental Shelf. 131. Multivariate Relationships: Coral Growth, Genetic and Environmental Controls. 133. REFERENCES. 135. APPEND!X A. COLLECTION SITE DATA. APPENDIX 8. GROWTH DATA DISTRIBUTION. APPENDIX C. COLONY DESCRIPTORS.
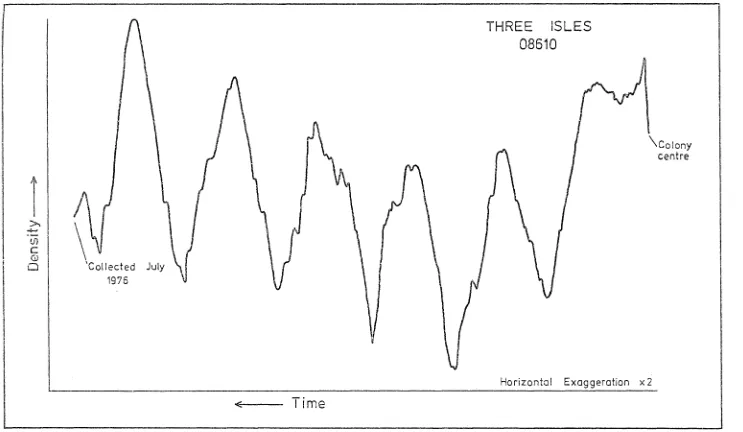
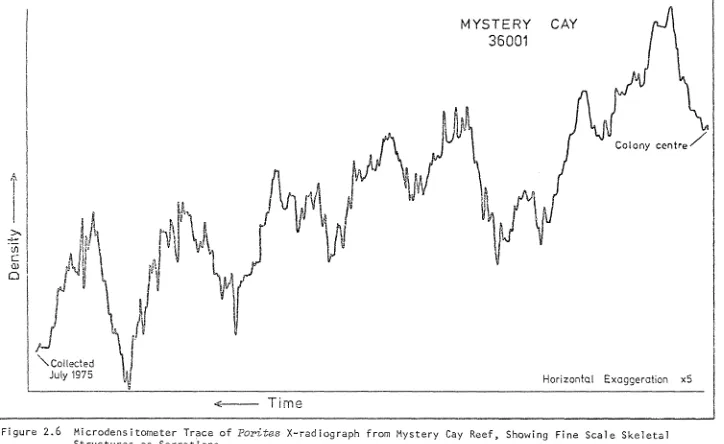
(12) LIST OF FIGURES. £.i gu re 2. 1. 2.2 2.3 2.4(a) 2.4(b) 2.4(c) 2.5(a) 2.5(b) 2.6. 2.7 2.8. 2.9. Locat i on ~\ap~Co 11 ect ion Sites from the Great Barrier Reef Province. 22. SCUBA Collection of Massive Pori-tes from Reef Top. 23. ~1ach. X-raying Coral Sections with Medical Radiography i ne. 23. X-radiographic Positive of Pori-tes Section from Viper Reef Showing Annual Density Banding (X 0.8). 29. X-radiographic Positive of Pori-tes Section from Leopard Reef (X 0.6). 29. X-radiographic Positive of Pori-tes Section from Lark Pass Reef (X 0.6). 30. Microdensitometer Trace of Porites X-radioqraph from Three Isles. 32. r1i crodens i tometer Trace of Pori-I;es X-rad i ograph from Wheeler Reef. 33. Microdensitometer Trace of Pori-tes X-radiograph from Mystery Cay Reef, Showing Fine Scale Skeletal Structures as Serrations. 35. X-radiographic Positive of Poorly Banded Pori-tes Section from Parker Reef. (x 0.6). 30. Wedges from P. Zu-tea Colony, Geoffrey Bay, Magnetic Island, Shmving Skeletal Incl~ement During One Year Following Al izarin Staining. 38. X-radiographic Positive of Pori-tes Section from Moated Reef Flat, Holbourne Island, Showing Sub-Annual, Fine HD Bands (X 0.5). 38. 0. 3. 1. Fairey Reef (19 35'S, 148°52 I E)--Zonation and Morphology.. 47. 3.2. Age-Growth Rate Plot for 28 Colonies of P. Zoba-ta fro~ Small Pool on Fairey Reef.. 49. 3.3. Colony Growth Increment (% of Previous Year) from 28 Colonies of P. Zobata from Fairey Reef vs Year of Growth. 51. Hypothetical Platform Reef--Main Physiographic Zones.. 56. 4.1.
(13) Fi gu re. 4.2. \~hee. 4.3. ler Reef-Morphology and Surface Zonat ion Collection Zdhes Numbered 1-4.. 58. Spatial Scheme of Major Indo-Pacific Shallow Water Coral Associations (Frdm Rosen, 1975).. 67. 4.4. Mean Annua 1 Grov-Ith Rate for \o/hee 1er Reef Colonies, by Zone (95% Confidence Limits).. 5.1. Ba rn ett Pa tches-I-lorpho logy and Su rface Zonat i on. Collection Site~ Numbered 1-4.. 78. 5.2. Three Isles·-110rphology and Surface Zonation. Collection Sites Numbered 1-3.. 84. 5.3(a). Barnett Patches-Zone Growth. 5.3(b). Three lsI es-Zone Growth t-leans.. 88. 5.4. Wheeler Reef, Barnett Patches, Three Isles-Zone Growth Means and Interaction Effects.. 90. 5.5(a). Cross-shelf Variation-Leeward Zone Heans Plot (V i per, It'hee 1er, and Rat t 1esna ke/t-lagnet i c) -All Years.. 95. 5.5 (b)-. (0. ~1eans.. Cross-shelf Variation-LeevJard Zone Heans Plot (Viper', Wheeler, and Rattlesnake/Magnetic)-. 1975-1971. 5.6 5.7 5.8 5.9 5.10 6.1. 87. 95. Cross-shelf Variation-Contrasting Reef Types·Zonal Heans Plot.. 101. HD Band Mid-Point Deposition Time vs Latitude.. 108. Isotherm Movements, Surface Waters of Province. vs Latitude. 110. Best Fit of HD Band Timing to Surface Isotherm Movement. 112. Mean Annual GrO\vth Rate of Five Species of. Porites (95% Confidence Limits). 115. Reef Classification Scheme (Hopley 1982).. 130.
(14) LIST OF TABLES. Tab le 2.1. Results of Staining--Magnetic Island Coral. 4. 1. Cape Cleveland--Wind Data.. 60. 4.2. Cape Cleveland-Temperature and Rainfall Data. 62. Wheeler Reef-One-Way Analysis of Variance-. Effect of Habi'tat/Zonation on Growth. 68. 5.1. Cardwell--Wind Data. 75. 5.2. Cape Cleveland, Cardwell, Cooktown--Temperature and Rainfall Data. 76. 5.3. Cooktown--Wind Data. 81. 5.4. Cape Cleveland, Cardwell, Cooktown--Temperature and Rainfall Data·. 82. 5.5. Barnett Patches, Three Isles--One-Way Analysis of Var i ance-Effect of Hab i tat/Zonat ron on Growth Rate.. 86. 5.6. Wheeler Reef, Barnett Patches, Three Isles--OneWay Analysis of Variance--Effect of Zonation on' Growth Rate. 5.7. Wheeler Reef, Barnett Patches, Three Isles--TwoWay Analysis.of Variance-Effect of Zonation and Reef Morpho logy on Gro\A/th" 'Rate.. 5.8. 89. 91. Cross -She 1 f Reefs (Townsv ill e Transect) -One-~/ay. Analysis of Variance--Effect of Shelf Location on Growth Rates of Leeward Zone.. 5.9. Cross-shelf Reefs, Contrasting Types--Two-Way Ana1ys"is of Variance-Effect of Zonatron and Reef. 5.11. 5.12. Morphology on Growth "Rate. 102. Correlation Between Growth Rate and Distance to Land/Ocean.. 103. Classification Results--Discriminant Analysis, Groups Def i ned by Depth"". 105. Summary Table-Discrinlinant Analysis, Groups Def i ned by Depth. 106.
(15) Table. 5.13. 5.14 6. 1. One-Way Analysis of Variance--Test of Differences Between Species Growth Means.. 114. Spearman Rank Correlation Coefficients: Species Mean Growth VB Latitude.. 114. Multiple Regression: Selected Variances with Mean Annual Growth Rate.. 134.
(16) CHAPTER ONE I NTRODUCTJ ON TO CORAL GRO\{TH RATE STUD I ES The marine ecosystems known as coral reefs have fascinated natural ists and scientists for centuries.. Inquiry into the structures,. the largest biogenic features of the earth's surface, have centred around three principal questions:. Where do they exist, what is their. physical/chemical/biological makeup, and how do they grow and decay? The early geological work of scientists such as Darwin (1842) and later Daly (1910 onwards) concentrated on the historical sequence of reef development, treating the origins and growth of reefs as exercises in deduction based on limited data.. Biological studies on the growth. and form of individual corals were based more on the intrinsic curiosity of the systematists.. The rapid expansion of coral reef. studies since the 1928-29 Great Barrier Reef Expedition has. ~een. the. I ife histories of individual colonies become more important in general reef studies.. Corals are seen in the context of their relative. contribution to the growth of coral reefs with each of the other major taxa of the calcareous organisms. The importaoce of the study of the growth of individual colonies at present I ies in t '.-JO areas: contribution to the development of individual reefs, ltlhich in turn form the basis of reef complexes, and the ecological significance of differences or patterns of growth rates, in time and space. Earl ier ideas about the dominance of the role of coral colonies have been somewhat modified.. The present broad model for coral reef. development, as hypothesised by Chave et al. (1972) shows a single coral reef as being a function of the net production of calcium.
(17) 2. carbonate at that location over a period of time.. The relative. contributions of corals and other major calcareous taxa in given locations within the reef area determine what kind of reef is built and retained over time.. Coral growth rate values are essential in. determining the calcium carbonate contributions for each location. Buddemeier and Kinzie (1976) point out, however, that reef development studies at present require little, if any, additional information from coral growth studies for the following reasons.. Physical events. such as storms can destroy centuries of structured coral growth. Other processes such as sea level changes, coral mortal ity or overcrowding may intervene.. Furthermore, the present state of the art of. growth measurement, being so relatively precise compared with methods used In determining the growth rates of other contributing organisms, I~. perhaps too refined to use in conjunction with them. The major need in studies of coral growth r<:ltes (and growth. forms) certainly lies with the biological, ecological and environmental questions which are and will be posed in the reef studies.. frame~~rk. of coral. The variability of growth rate and form which has been. demonstrated remains of more than passing interest to the biologist. While the greatest diversity of growth form I ies· in species difference, the variability in rate can be accounted for by a combination of factors, both endogenous and exogenous, with the major influence probably lying with the latter.. These exogenous factors are them-. selves spatially and temporally variable, thus posing the question of correl at ion between observed env i ronments and. gro~Jth. rates.. The. historical correlation of growth rate parameters such as density band patterns may provide information on past environments, though as Buddemeier and Kinzie (1976) have pointed out, inorganic chemical models alone do not equate skeletal chemistry with conditions at the.
(18) 3. time of growth, but rath.er a'l.1ai.'t the refi-nement of bIochemical. techn i'ques and f i'nd ings to des-cr i'be the camp 1ete effect of env i ronment on gro\4tfi.. Thfs thesis contributes to the body of data on growth and skeletal characteristics of a widely distributed genus of coral from the Great Barrier Reef Province.. It analyses geographic patterns in. rates of growth, and suggests some models of environmental causation. in these distributions. Definitions The discussion of the history of coral growth rate measurement must be prefaced by some discussion of the definition of growth, and of the 1 imitations of the types of corals under discussion.. The first definition, that of growth, is based on the form of the colony, and the processes involved in creating that form.. For. example, the growth of the plate-l ike corals is suited to measurement on a horizontal expansion basis.. The growth of the corymbose or. antler-type species may be measured in terms of tip extension, or weight increment converted to volumetric parameters if necessary.. Growth in scleractinians is a function of skeletal framework extension.. Calcificati·on j's the rate of deposition of s·keleton,. irrespective of extension rate.. The relatibnship of calcification. to extension rate is thus a Ineasure of skeletal density. Since this study is based on the use of. X-radiograph~. it uses. only those corals which are suited to the method, nanlely the fine-. grained massive, spheroidal types, and derives measures of 1 inear radial expansion. in em/year.. Hany other methods of gro\vth rate. measurement have been employed in the past, ranging from direct.
(19) 4. sequential field measurement of di.menstonal increment, such as that of Mayer (1918), Edmondson (1929), and Shinn (1966), to the radioisotopic uptake methods of Goreau (1959).. These have, of necessity,. been expressed in differing units in many cases.. The consequences. of this lack of conformity have been discussed by Buddemeier and Kin z i e .( I 976) . The definition of a scleractinian coral, for the purposes of t his stu d y, i s t hat. 0. f a t rue. II. r e e f bu i Ide r ,". 0. r her a t y pic co r a 1 .. History of Growth Rate Measurement This subject has been very comprehensively reviewed by Buddemeier and Kinzie (1976). growth. were made by direct measurement of the colony over an. rate~. established period of time. colonies of. The earliest estimates of colony. SyrrrphyUia~. In 1913, Mayer remeasured several large. Porites and Goniastrea lying off Vivien Point,. Thursday Island, and derived growth rates for the colonies for the interval since the colonies were photographed and measured by SavilleKent in 1890.. Previous to this, such workers as Gardiner (~1aldives).. Guppy (Cocos-Keeling). Sluiter (Krakatoa) and Wood-Jones (CocosKeeling) had all published dimensional gro'tJth ihcrements for individually measured coral colonies.. Vaughan (1915) measured a. large number of corals in terms of colony height and diameter on Dry Tortugas in the Caribbean, finding variability in grm..;th rate both intraspecifical ly and over time.. He noted, along with later. researchers (Mayor 1924; Edmondson 1929; Stephenson and Stephenson 1933), the differences in growth rates between the faster-growing branching forms and the heavier, more robust massive types.. Of the. more recent direct I inear colony measurement workers, Shinn (1966) measu red Acropora extens i on rates in an a ttempt to cor re Ja te grm"th.
(20) 5. with environmental condtttons, whfle Woodhead (1971) establ ished the annual growth increment for 1968-69 of 171 colonies representing more than a dozen species of corals from the Heron Island reef area, by r'neasuring weight i"ncrease. and height increase, as well as two. different diametric dimensions for each colony.. The ultimate. refinement of the 1 inear extension measurement method is probably that of Barnes and Crossland (1980), who used high resolution photographic methods in conjunction with an Sntervalometer to record slxhourl y grmvth increments in the tips of Acropora acuminata (Ver i J 1) taken from the Great Barrier Reef.. Most of the more recent weight-. type growth measurement methodology has been used In conjunction with investigations of changing environmental conditions in laboratory studies on colony growth, e.g. Jokiel and Coles (1977) and Coles and Jokiel (1978). Barnes (1972) showed the applicability of vital staining of the coral skeleton to growth studies.. He used alizarin sodium sulphonate. (Alizarin Red S) to stain a time marker in the living colony, allowing growth after this event to be measured at a later date. Jell (197 1.f) app) led this method to investigations of the microstructure of several species of coral from Heron Island (Great Barrier Reef).. This method was also used by Dustan (l97.5). in field. studies of grol(Jth characteristics inNontasi71:,ea annuZa:('-is in Jamaica. G1ynn (1977) derived the growth rates of colonies of pocilZopora. damicorais in the Gulf of Panama and the Gulf of Chiriqui using Alizarin staining.. Jokiel (1978) noted the effect of Hater motion. on growth of three species of Halr/aiian corals using the method to assess groHth parameters..
(21) 6. Two methods of coral growth meas,urement which have been appl ied tn a large numBer of recent tnvesttgations are the radiometric method of calcification measurement and the X-radiographic technique of density band analysis within the skeletal structure of colonies. The first method involves the estimation of calcification rates as an index of skeletal accretion.. This is usually done either by. direct measurement of calcium carbonate deposition or by using a "tracer" chemical which mimics the activity of the skeletal material being deposited.. The measurement of isotopic ratios which are found. naturally in the skeleton also form part of this approach.. The many. workers in this field have been reviewed at some length by Buddemeier and Kinzie (1976).. Perhaps the principal value of these approaches. is in the field of tissue/skeleton interaction, in conjunction with the algal symbionts present in hermatypic corals, with the ramification for coral grm;'th studies in the growth rate sense being largely a by-product of the research.. Certainly, they have led to a. greater understanding of the interactive effect of environmental parameters with individual corall ite chemistry. The appl ication of annual density band analysis in certain hermatypic corals by Knutson et al.. (1972) has led to a widespread. usage of X-radiography of coral skeletal structure as a tool for investigating coral growth rates.. The density band·patterns form a. record of colonial growth in each coral, a1 lowing historical assessments of. gro~~h. response to environmental change, both in tenns of. 1 inear extension variation and density fluctuation (daily, lunar, or seasonal).. A summary of the applications of this technique to the. field of coral growth rate studies Is provided by Buddemeier and Kinzie (1976) who conclude:.
(22) 7. The development of the radiographtc technique has rendered almost trtvial the prevIously unsolved problem of measurtng long-term growth rates and growth hfstortes retrospectively . . . • The standard reference to the procedure may be that of Buddemeier (1978). Biology of Hermatypic Corals The hermatypic or reef-building corals are characterised by the presence of large numbers of unicellular dinoflagellate algae in their endodermal tissues.. These algae perform special functions. relating to the skeletogenesis in the coral colony, and in return derive some special benefits themselves from the metabolic activities of the cora 1 po 1yps (see Goreau et aZ. 1979). The initial stage in the development of a sessile hermatypic colony is the settl ing of the planula, or fertil ised ovum on a suitable, hard substrate.. This planula then secretes a basaJ. calcareous disc, upon which it builds a column of aragonite, or thecal wall.. Finally, it secretes the internal skeletal elements. distinctive to the species (septa, synapticulae, pall, dissepiments, etc.), and the colony grows by polypal repl ieation either through fntra- or extra-tentracular budding. The simpl Istie model of growth above does not explain the chemico-physical nature of tissue growth and skeletal development· in its campI icated detail.. While much is known about the algal/. animal and tissue/skeleton relationships, the complete story is as yet unavailable.. In simple terms, the tissue lays down aragonite. at the sites of calcification as a result of the creation of a suitable chemical Ilcl imate" by both the polypal tissues and their algal symbionts.. The dependence of skeleton formation on the. zooxanthellae is the principal focus of interest in coral.
(23) 8. calcfficatfon, and is weI I reviewed by Johnston (1981).. The. relevance of thfs relationshfp to skeletal growth studies lies in the response of the alga to varying environmental conditions.. In. partfcular, the photosynthetic requirements of the zooxanthellae are light dependent, making that variable a controlling factor on the growth of the coral symbiont. This study concentrates on Porites, a wide,'-ranging genus found in both the Atlantic and Indo-Pacific regions.. It should be noted. that no species of POl-,{tes is common to both areas.. In the Great. Barrier Reef Province it is found from the Solitary Islands in the south to the northern I imit of the area, while on the west coast of Australia it Is found as far south as Abrolhos Island (Veron et aZ.. 1974).. The colonies found at the extreme southern limits of the. range are not as rounded or hemispherical as those further to the north, but tend to assume a flattened, encrusting layer on the substrate.. As a genus, it shows two predominant growth forms,. massive and branching (ramose), if the encrusting form is taken to be' an aberration of the massive form.. It possesses very small. coral lites (max. 2mm diam.), which divide extra-tentacularly. Highsmith (1980) also reports that heads of P. Zutea may disperse and resettle on ne", substrates as a result of dislocation due to storms, etc.. G-Iynn (I 971.t) noted the existence of mobile Porites in. the Gulf of Panama.. (A few of these were collected from Heron. Island for the purposes of this research.). WeI Is (1956) described. P01.>ites as one of the most important hermatypic coral genera, being. second on I y to ilc:t'Opol'a..
(24) 9. Infl uences on Coral GrovJth Rate. Coral growth rates can be said to be dependent on two broad. groups of influences, environmental (exogenous) and systematic (endogenous).. The first group includes such variables as depth,. temperature, salinity, nutrient supply and other sedimentation and turbidity.. 'r/ater. qualities,. The second group encompasses species,. size, colony age, and entrained biological rhythms. It is the first group, the exogenous controls on growth, which. determine the limits of the geographical range of the corals, and within these 1 imits it is both the internal :nd external influences which determine growth rates.. True scleractinian corals do not grow. outside these environmentally imposed thresholds.. Environmental controls over coral growth have been well documented, and are summarised by Wells Buddemeier and Kinzie (1976).. (1957), Stoddart (1969),. and. The appl ication of the consequences. of these factors to this study lies not so much in the environmental limits \-,ithin YJhich corals ?JiZZ grow, but ho"" they respond to change. 't'ithin those limits.. will be discussed:. In this context the follov.'ing physical factors. temperature, depth, water. chemistry~. emersion,. light availability, turbulence and sedimentation.. The lOvier limit of temperature that hermatypic corals can survive for long periods is about 9°C (Macintyre and Pilkey 1969), \vi th the upper 1 imi t at over 37°C (Orr and t..toorhouse 1933).. The. 1 imits vary with the species involved, some being more responsive to extremes than others.. The mechanics of temperature control over. coral growth are reviewed by Stoddart (1969) as being perhaps more concerned with control of reproductive ability rather than feeding.
(25) 10. or physiological death. Early v.'Ork sno'ded that corals lost their aDil ity to feed at certain upper and lower temperatures (Mayer 1915 and Edmondson 1929, respectively).. The relattve tmportance of each of these mechanisms. (reproductive or feeding innibition, or physical damage) is of less o. 0. interest beb/een the temperatures of 25 C and 29 C, the range of optimum growth conditions.. In this range, the proportional effect. of temperature on growth rate values is important.. Weber and White. o (1974) found a growth/temperature coefficient of 0.9mm/yr/ C for Platygy:~. from various Indo-Pacific regions, using radiographic. techniques.. Weber et al. (1975) found that greater skeletal density. was associated with lower 18 0. content in annual coral bands, thus. relating higher water temperature to an increase In calcification rate.. An earl ier paper by Weber on the incorporation of strontium. into reef coral skeletal carbonate discussed the relationship between "growth" in the calcification sense and temperature, finding that, 0. 0. withi.n the range of 20 C-30 C, calcification rates Increased with temperature (Weber 1973).. However, Clausen and Roth (1975a) showed 0. that calcification in PociUopora peaks at 27°C, and again at 31 C. Highsmith (1979) reviewed this point in relation to his own findings on Enewetak. corals, and postulated that the preferred optimal temperature of zooxantnellar photosynthesis I ies at about 27°C-28°C, and the rate decreases progressively at higher temperatures, with consequent results for coral growth.. This may explain high density. band formation in warmer water, an event he states is simultaneous ~"ith. a 10\." groNth period in corals. Many of the problems that have occurred in the investigation of. cora 1 gro'dth rates and It/ater temperature have ari sen from the fact that all large-scc::le ecological studies encounter the dilemma of.
(26) 11. whfch temperature tndlcator to use. water temperatures, when used. ~gainst. For example, average annual measured growth rates, may not. sufficiently account for varfabf1 rty and seasonal ity, nor even extreme temperature effects, to make val id conclusions.. Some mention. should be made of the different responses of unlike species to changes tn temperature.. Mayor (1924) subjected several different. species of reef flat corals from Murray Island and Aua Reef to artificially produced high temperatures for various time intervals, and concluded that some corals were more resistant than others to upper temperature extremes.. Among the more pertinent of his findings. for this thesis was his conclusion that the larger massive Porites ("aff. lutea ll ) were the most resistant Samoan coral to asphyxiation, dilution by fresh water and temperature rises of an extreme order. Sa 1vat et al.. (1977) reported tha t the only sc 1eract i n i an extant in. the isolated lagoon in Taiaro Atoll, Tuamotus, in fairly extreme physical and chemical conditions was Porites lobata. Sa 1 in i ty Many studies have investigated the effects of high and low sal inities on coral survival, but few workers have tried to determine the effect of altering sal inities on the growth rate of coral colonies.. The literature to date has estab1 ished that most. hermatypic corals survive between 25 and 48 parts per thousand (extreme values). Lowered salinities due to extremely heavy rain falling on wide sha1 low reefal areas has been documented many times physiological effects on corals.. ~s. having severe. Mayor (1924) te11s of the large. areas of coral kil led in Pago Pago harbour in June 1920, following heavy rains, aithollgh he makes no distinction as to the contributory.
(27) 12. effect of increased sedtmentation.. tn the Great Barrier Reef area,. Hedley (1925) reported the destruction of the Stone Island frinqing reef near Bowen, Queensland, tn a cyclontc episode in 1918, when almost 1400mm of rain fell in three days in t1ackay, just to the south of the area.. The tremendous dflution of the reef flat waters proved. fatal to almost all the corals present.. The results of this dovJn-. pour are still to be seen today in the form of dead, high-standing mlcroatoll formations on Holbourne Island, just to the north of Bowen (Hopley and Isdale 1977).. Peel Island, in Moreton Bay, near Brisbane,. was the scene of extensive coral damage when the bay was inundated with fresh water following heavy rainfall in 1956 (Slack-Smith 1960). Banner (1968) reported a similar event in Hawaii at Kaneohe May 1965.. Lowered salinities and sedimentation. ~."ere. Bay. in. blamed for coral. morta 1 i ty. Upper sal inity 1 imtts are discussed by Kinsman (1964) from the Persian Gulf.. He records that Porites can tolerate sal inity levels. in lagoonal areas along the Trucial Coast of up to 48 parts per thousand.. Coles and Jokiel (1978) examined the effect of altered. sal inity on grovrth in Montipom in conjunction vlith temperature variation.. They showed that the temperature to~erance of the coral. is lowered as salinity drops, and postulated that the reverse is true, since Kinsman (1964) described Persian Gulf corals 1 iving in temperatures of 49°C at up to 48 parts per thousand sal inities. These findings do not, however, show the relativity of sal inity alone to growth rate, and this relationship remains obscure.. The physical parameter of depth is a compound variable, representing the effects of light penetration, water movement, food.
(28) 13. availabflfty and other factors.. The lower limits at which hermatypic. corals grow and survive are generally agreed to be those at which the avaiiability of light does not attain the threshold requirements of the symbiotic zooxanthellae for photosynthesis.. The variabil ity. of growth rate and form in the surface layers of the ocean (down to 15m) is thought to be fnfluenced by variables other than light levels. Below this depth, most corals show a decrease in grovlth \'iith depth. Wells (1957) gives the maximum survival depth of hermatypic corals as about 90m, with most corals growing above 50m, and the most luxuriant growth being above 20 metres. While most of the early work on the relationship of coral growth to depth was concerned with the variation in form of the corals, later efforts have concentrated on determining the relativity of depth to such factors as Jfnear growth, calcification rate, density within the coral skeleton, and rates of photosynthesis.. va~iations. Within the. context of this thesis, which is mainly concerned with skeletal extension rate, the results of various workers have shown that grm"th is species dependent or dependerit on local environmental factors above about 15 metres (Buddemeier and Kinzie 1976).. Hare specifically,. Buddemeier et al.. (1974) suggested that the grovlth rate of P. l.utea from Enewetak Atoll was Jess than half the rate at 30 metres than it was at 4 metres.. At depth 18m, they found that the same species. grew almost twice as slowly as it did at 7 metres.. Baker and Weber. (1975) reported that the rapid fal I-off in growth rate at 18m of M. a:nnul.aY'is in the Virgin Islands was accompanied by a significant. reduction in growth rate variance.. Other researchers have found. that some species do not show a significant decline in grovJth rate below any specified depth.. Weber and White (1977) showed that. M. cavernosa does not respond to depth increase, \'Ihile lv!. armul.aris,.
(29) Buddenleler et aZ.. which is a faster grovJlng spectes, does.. (1971~). reported that Fa~,ia speciosa from Enewetak showed no systen1a tic variatlon V-Ji"th depth.. Hlghs:mi.'tn (1979) suggested the reason that. different speci'es- are affected di"fferently by depth may be a function of the corals possesslng different zooxanthellar strains, which have. unlike responses to the depth-dependent decrease in light levels.. Other Controls Water turbulence is considered to be an important influence on coral growth.. Rapid movement at the air-water interface. result~. in. oxygenation of surface waters, such an effect being demonstrated by the higher oxygen supply avai'lab'le in surf zones.. in some species,. however, heavy turbulence may have an inhibiting effect on growth through disruption of feeding activlty.. The corals most affected. \VOuld be those with snlal1 corall i tes, such as PoriteB.. Turbulence. was considered by Mill iman (1974) to prevent siltation, a function which aids the deeper-poly'ped corals such as the Favids.. The. distribution of the Porites biotype in Rosenls (1975) model for fndo-. Pacific corals seems to support this suggestion. Turbidity affects coral growth rate principally through. reduction of available 1 ight to the algal Dodge. et al. (1974) and AJler and Dodge. sym~ionts. of the coral.. (197L~) found an invet-se. correlation betv/een gro'tJth rate of Mdnt::zstrea an1~uZ.ariF3 from Discovery. Bay and the resuspension of bottom sediments. species-dependent effect on growth.. Heavy siltation has a. Some genera (e"g. Porites and. Fwzgia) have very effective sediment removal capacities, \tJhile others. such as. PociZ~opora. do not.. The death of the latter species on. Middle Reef in Cleveland Bay (North Queensland) due to the effects of sedimentation from the dumping of dredge spoil to windward of the.
(30) 15. reef, and the cant i nu i ng vita Ii ty of Porn:tes microato 115 ina similarly affected area on Magnettc Island bears this out. Many of the above environmental controls act synergistically, with consequent problems for the researcher interested in assigning levels of responsibility for growth rate influence to each.. For. example, avai lable 1 ight may be a function of depth and turbidity, while turbidity in turn may be related to water turbulence.. The. breakdown of environmental causation is thus often difficult to ascertain with accuracy. Systematic Controls on Coral Growth Endogenous (internal) controls on growth rate have not been studied extensively to date.. Among the earl iest references to the. subject of determinacy in coral growth, Wood-Jones (1910) regarded growth as being Indeterminate, while Vaughan (1915) and Mayor (1924) thought that corals reached growth limits.. More recent workers have. postulated that certain species exhibit genetic 1 imitations on colony size (Gareau and Gareau 1960; Maragos 1972).. Size-growth relation-. ships have been noted (Motoda 1940) In terms of Dolyp mUltipl ication rate, and geometric constraints (Barnes 1973), while Grigg and Maragos (197 11) noted determinate growth in PociUopora.. Buddemeier. and Kinzie (1976) summarise the topic, pointing out that the new· retrospective methods of growth rate analysis (such as X-radiography) show that there is no decrease in rate with age in the massive corals. They illustrate the difficulty of verifying the existence of sizef growth rate relationships by noting that conventional laws of growth based on volumetric reasoning do not apply to corals, whose growth vector, the coral tissue, is largely tv..'O-dimensional, being a flattened. ~ayer. of material arranged on a skeletal surface.. Thus.
(31) 16. they state: . . corals may exhibit determi'nate growth, but it fs unlikely to be predictable or rational izable on the basis of conventional grovlth la\""5. Secondly, the problems of inherent variability and environmental effects on coral grm·,th greatly compl icate observations and interpretations. Aims of The. Study. This study examines the geographical distribution of the mean annual grovlth rates of 452 coral colonies from the Great Barrier Reef Province.. It seeks to answer questions on the distribution of those. rates at a number of scales: provincial, regional, single reef scale, and microhabitat within the single reef area.. It also attempts to. use year-to-year variances in growth rate in conjunction with historical environmental data to investigate external controls on grovlth. The importance of the problem of scale is emphasised.. The. variability of annual skeletal extension rata is analysed, from the smallest to the largest scale, since this statistic usefully del ineates geographical/ecological boundaries within the ecosystem. The thesis examines the growth rates of colonies from the entire length of the Great Barrier Reef Province. accrue from having such a large sampl ing area.. Several benefits. One of these is that. the Province covers a large l<'ltitudinal range, from the Torres Strait, at about laOS, to the Capricorn-Bunker Group, around 24°s.. This. range encompasses several different climatic types and is within the amLlt of movement of several discrete bodies of water from oceanic sources.. "fhese factors provide a range of environments within \'ihich. to examine the response of coral growth rates to changing external influences..
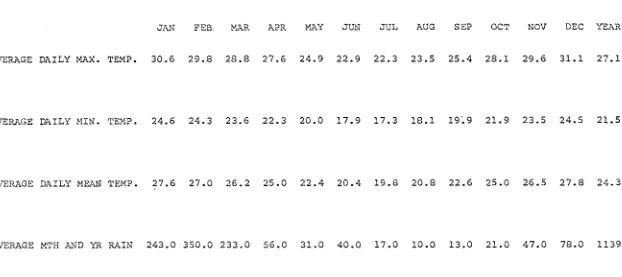
(32) 17. Another feature of the Great Barrier Reef Province which makes it ideal for an extensive geographtcal/ecological sampl ing programme is the varying width of the continental shelf along the north-south axis.. Thus, the effects of such factors as distance from landward. influences and oceanic waters may be weighed in relation to each other, as well as in absolute terms.. Sincethe shelf width ranges. from about 24 kilometres in the north, at its minimum extent, near Cape Melville (14°l0'S), to 200 kilometres wide, east of Mackay, in o. the region of 22 S, the degree of influence of each factor can be judged with relative ease. The range of cl imatic variables, and water qual ity and properties over the whole extent of the Province is quite large. For example, the northern region around Cape York has a monsoonal wet-dry (Koppen1s AY/g,Av/,Am) cl imate, whi Ie the the CapricornBunker Group in the south has a subtropical (I<oppen type Cw) cl imate. The range of monthly mean minimum temperatures is more than SoC 0. for the Province, that of monthly mean maxima more than 12 C (see Pickard 1977, Figure 6).. ~1ean. annual rainfall is between 600-l800mm/yr. in the Cape York area ( 100S), peaks at about 4000mm/yr on the 0. lnnisfail coast ( l71 S), and drops to around 1000mm/yr at the southern extremity of the Province (Pickard 1977, from Figure 7). o. 0. Sea surface temperatures of 29 C-30 C occur around Cape York in January, dropping to just above Z4°C in August (ten year average temperature field for each month-CSIRO 1979), while the same figures o 0 for the Heron Island area are Z7 C-2S C in January and ZloC in September (CSIRO 1979).. The ten year average sal inity fields for. Cape York show a range of from 35. 6. part~;. per thousand (October-. November) to 33.6 parts per thousand (Herch-April). The equivalent.
(33) 18. figures for the Capricorn-Bunker Group are 35.5 parts per thousand (August-September) and 35.2 parts per thousand (April, October) (CS I RO 1979). This vJide range of environments allows systematic conclusions to be made from correlative studies between growth and growing conditions.. The problem of comparing growth data from global scale. differences in location (e.g. high rainfall period in Florida with the monsoon season in the Indian Ocean) is avoided, since the environmental "zones" of the Great Barrier Reef Province are contiguous. The colonies used in this research were all of the genus. Porites Link, 1807.. Of this genus only eight species were collected,. those which formed hemispherical, massive colonies.. The genus is. widespread throughout the Province, and this allowed comparisons to be made between grO\'lth rate values of colonies in the certain knowledge that the conditions for growth are well within the environmental range for the whole genus.. Pontes is a finely structured, relatively porous coral in its massive gro'dth form.. It is also fairly slow growing v/hen compared. \."ith the branching forms, such as ACl'opora, although its growth rate (linear extension) is greater than some of the Favid corals, \-,lhich are denser.. It is the fine structure of the genus vJhich makes. Pontes ideal for X·-radiographic studies, since the analysis of the X-ray plates is not confused by the intrusion of skeletal element images, as would be the case. with some of the larger-structured. Favid corals. The regular hemispherical or semi-hemispherical shape of the selected species proved a definite asset in colony preparation for X-radiography.. The objective of X-raying the colonies was to.
(34) 19. determine the full spectrum of annual density bands (see Chapter Two, Densitometry).. Cutting of each colony required that the. finished slab contain all the density bands, from origin to edge. this was facil itated by the rounded, symmetrical shape of the coral la, clearly identifying the point of origin of growth. Irregularly shaped colonies VJere not used, nor "'Jere those that had been severel y bored by b ioeroders (see Chapter TltJo). In summary, the genus Porites was used exclusively in the programme because of its ubiquity, structure, and suitabil ity of shape for dissection and X-raying..
(35) 20. CHAPTER TV/O. METHODOLOGY Introduction In this study, the methods of investigation employed comprised three main components.. These were:. (a ). fie 1dwo r k ;. (b). laboratory analyses; and. (c). statistical analysis.. The relative timespans allocated to each of the above were dictated by the irnmensity of the study area, and its inaccessibility, and. reflect the large period of time needed to assemble the corals, and the handl ing of the colonies in sectioning and screening them.. high cost of. tr~nsport. The. to the areas of collection required that a. certain degree of opportunism appear in the sampl ing procedure,. entailing the avail ing of ship-time on the expeditions of other scientists.. Fieldwork The study of geographical variation in growth rates of corals necessitated the sampling of colonies over as wide an area as possible, in order to be able to investigate patterns in as large a range of differing environments as was essential to show up the main. external factors influencing that growth.. Therefore, at various. scales of intensity, sampling was undertaken over the complete. latitudinal extent of the Great Barrier Reef Province, from Port ~\oresby in the north to Heron Island in the south (see Location ~\ap,.
(36) 21. Figure 2.1).. Several colonies were kindly suppl jed from Noumea. (see Acknowledgements), enabl ing growth pattern comparisons from a different seasonal regime to be made with Great Barrier Reef corals. At the next smaller scale of sampl ing, the study required comprehensive sampl ings along lines or transects across the Province in an east-west orientation, over the continental shelf.. This was. intended to ascertain the relative effects of distance from oceanic and terrestrial influences on growth patterns.. On a smaller scale,. collections were made from single reef units on an intensive basis, with the reefs chosen to represent the greatest diversity of geomorphological types.. Three reefs in this category were sampled,. these being Three Isles (a low, wooded island reef), Wheeler Reef (a small platform reef), and Barnett Patches (a dispersed pattern of resorbed reefs).. The intention of the examination of these reefs. was to find if colony growth was in any measure affected by the type of reef on which it grew.. Different reef types in both plan and. profile cause different micro-environments to occur within their boundaries, as exampled by the fact that the height of a reef flat relative to mean sea level (MSL) influences the direction and intensity of the current regimes about it.. At the smal lest scale of. all, collections were made from a small (15m diameter) reef crest pool on Fairey Reef, all of the same species.. The rationale behind. this activity was the investigation of the assumption that similar corals in a uniform environment should show similar patterns of growth in time, having negated the effect of space. In each location, colonies were taken by hand using scuba or shallow diving, or '<<Jere collected at 1m-v tide (Figure 2.2).. "'lith the. exception of the collection on Fairey Reef, samp! ing was generally.
(37) 22. I. 0. 154. Island Reef Reef Low V\'ooded Island. ::\::'::\\:::::::>:'::::::::::<:) ::::\:::::::::"'>:"".'1. l. i-_- f;. -i-- i-i-:2;~2O:I:8",.'-.t.G:~. Three Is18$ Lark Pass Long Reef Reef. ......' ',','.', " "'J' ,'. ,~. I»}}::»-:<::::-,:.:::::\:~"V\.)~KI L." 'l'i. ::;: .::: :":,:::. 5. ~ Cairns Reef ,~---. _ _ East '-fope Reef. ::-::::}",,;'. Pickersgill Reef. .~~~. . . AR?,,'1. U It:. Poi nt Reef Reef Patches Island Island Reef Reef. Island Reef J...br:notj ..... Island. '-=.t.;:.->~~-==L€;:P;;. . . -~r-::::i~~~. Reef. Reef. Bu ,de~ Reef Reef ''-'''-'VU. ,-:.:-;. Island. ' ..... ReAf Reel. _Mnl;i. ',,'.. ). Pf'lrk:::d(\(\. Reef. 4. A _",,:0' C.. ':>. '::. t=--N. ';. :/ :'::::. .'::. :::: ::::. .:.:. ,:::,:. - ~. l ::-:'. :::: ::-::. ~:;:(.l. ,-:::. .'.,. ,~.~Heron. '-;,'. ",'. -:::::. .::. :-:-:-:':. '-::-:::':. ~,. ::::. :-: ',':-. >.. Island. ... ::'.":'. ::::. Figure 2.1. '.d'q,8. t. ~ )2- ·-:ml!. :14 ;fJ':\::::::;::::::,:} {:\>:::::»"11" i )1((t,::":>:::::,:<:::::«>:::.::.::':::}··-.'-.1._'-. Location Map-Collection Sites from the Great Barrier Reef Pray i nee".
(38) 23. Figure 2.2. SCUBA Collection of Massive Porites from Reef Top.. Figure 2.3. X-raying Coral Sections with Medical Radiography Machine.
(39)
(40) 24. confined to areas of about 50 square metres.. The selection of. individual colonies was opportunistic since no field identification of. Porites could be done at the specific level (see Taxonomy section). TGe main limitation on taking a colony was that of size and shape. Colonies more than about 35cm In diameter were too big to section using the available equipment, while colonies which were exceedingly asymme~rlcal. provided growth interpretation problems.. point is discussed in detail below.. This latter. Initially, some Favid corals. were taken, but this practice was discontinued as it became obvious that the skeletal "grain" of the family was too coarse for the densitometric technique.. This was because of the minute size of. the maximum beam width obtainable on the machine, it being several mill imetres smaller in diameter than that of the corall ites in the Favid family.. The finer structure of the Poritidae proved superior. in resolving the density banding patterns under X-radiographic examination. Descriptions of every field site sampled, along with relevant details, are given in Appendix A:. Taxonomy The history of scleractinian taxonomy has been attended by debate and revision throughout its course.. This has been principally due. to the nature of the scleractinian skeleton, which shows an extraordinary degree of structural variation.. It is the range of this. variation that creates difficulty for the taxonomist, since the specific Ilboundaries" are often hard to define due to the overlapping of principal skeletal characteristics.. Veron and Pichon (1976) have. reviewed the history of the species problem, and Veron (1981) the present state of thinking on variation within species boundaries..
(41) 25. Their use of the lIecomorph" approach to taxonomic differentiation has led to the divisions used in the present study.. Although the. genus was first described as such by Link in 1807, the first references to the group 'may have been those of Pallas (1766), in which an assortment of corals from a now lost collection were called. Madl'epora porites.. Li n k desc r i bed two spec i es, Porites polymorphus. and Porites damicornis (the latter is now known to be a Pocillopora) , but since then over 100 nominal. spe~ies. have been added to the 1 ist.. Bernard (1905) provided the first world-wide comprehensive study of the genus, but was unable to distinguish. species, and abandoned. the' binomial system of classification in favour of a numerical one based on geographical location.. The difficulty of classification of. the genus is well described by him: So great, indeed, is its apparent complexity, showing so many subtle differences which baffle all attempts to define or describe them, that the student stands long before the task in despair. Vaughan (1918) reverted to the binomial system in his revision of the genus, and his published work remained the best of its kind for many decades.. The last revision of the tax6nomy of the genus. has been that by Veron and Pichon (in press) .. The results of this. revision show that in Eastern Austral ia there are four groups within the genus, based on the structural similarities of their corall Itas and their colonial formations.. Within the Great Barrier. Reef Province there are 13 species of the subgenus Pori'/;es.. Of these. six form massive, generally hemispherical colonies of large dimensions, four form small hemispherical colonies, two are branching species, and two form flat plates or columns.. These are widely. distributed in the Province in the northern and central regions, but.
(42) 26. the number of species represented falls off south of the Great Barrier Reef, so that Moreton Bay has two species and Sol itary Island and Lord Howe Island (both in New South Wales) have only one each. For this study, eight species were used.. P. lobata. Dana 1846. P. australiensis P. lutea P. mayeri P. densa. They were:. Vaughan 1918. Edwards & Haim~ 1860 Vaughan 1918 Vaughan 1918. P. murrayensis. Vaughan 1918. P. solida. (Forska I 1775). P. lichen. Dana 1846. Porites lobata is massive, hemispherical and generally forms large colonies.. It has a very porous theca and each corall ite possesses. three discrete pal iform lobes per trident or triplet.. Porites australiensis is another massive species, similar to P. lobata, although the colonies may be "ribbed" or angular in a jelly-mould formation.. It has angular calices and thin razor-edged. theca, with deep, fused triplets and a single paliform lobe.. The. columella points to the trident and the directive.. Porites lutea is another large hemispherical species with a much denser theca than the above.. It has one high pal iform lobe. per triplet (which is fully fused), and a deep conspicuous synapticular ring.. It lacks a columella.. POl'ites mayeri iss imi I ar to P. australiensis except that it has smaller cojumellae, thicker thecae and larger paliform lobes.. Porites densa usuaily forms smaller hemispherical colonies and possesses very thick thecal walls, with small, rounded corall ites..
(43) 27. POl'ites mu:r'rayensis is another small massive species, with deep, hollow calices, inconspicuous columellae and very tall pali.. POl"ites sol-ida is one of the larger mass i ve spec i es of the genus, and is distinguished by its large cora11 ites, absence of pal iform lobes, and free-ended triplets.. Porites lichen is a massive, sub-. massive or encrusting species.. It is also distinguishable from the. other massive species by its coral 1 ites sometimes being arranged In rows or valleys. There were several colonies collected which did not fit any of the above descriptions, and these were not used in the study. Corals were not collected in order to define the range of any particular species, but collections were opportunistic, with only those species noted above being used.. The identity of these species. was determined using the criteria estab1 ished by Veron and Pichon . . One of the major difficulties encountered in identifying each colony \oJas the fact that all colonies had to be examined under a stereo-microscope.. Owing to the small size of the corall ites. (O.5-2.0mm), no field method of identification was found to be sufficiently re1 iable.. Specimen Cutting. Using a very large diamond saw (SOcm diameter), each coral colony was sectioned so that a vertical slab about 10mm thick remained, from the centre of the colony.. The slab was taken from. the vertical axis of greatest dimension, and incorporated the nodal po I nt of growth on the unders i de of the co 1ony.. I t was then. presumed to contain every radial growth feature in the 1 ife history of the corallum.. In cases where the exact origin of growth on the. colony could not be identified due to bo.-ing or encrusting organisms,.
(44) 28. the base of each colony was carefully shaved away until the concentric circles of banding (algal and depositional) could be identified.. After the sections were cut, they were rinsed and. scrubbed in fresh water to remove the fine products of abrasion during cutting, and allowed to dry.. X-Rad i og raphy X-radiographic images of the specimens were made on a Konrad 600, 3-phase, 6 valve, medical radiography machine (Figure 2.3). Following experimentation to establ ish the optimum technique which shO\~ed. the skeletal banding and fine structure at its best, the. exposures were made with fine focal spot, with the beam coned to object size, at an object-to-filament distance of 100cm.. This large. distance allowed the incident beams to be as parallel as practicable on striking the film. l-1ammography film.. The film type used was DuPont Cronex "LoDose ll. Exposures were made at S2KvP/1SOmAs.. The films. were then developed at 3S"C in a Kodak MN6, 90 second automatic developer.. The resultant plates were thus in negative format, and. showed regions of high density as 1 ight bands, and low density areas as dark bands (Figures 2.4a, b, c).. Densitometry Since the aim of the study was to measure only the annual growth increments of each colony, it was not considered necessary to undertake quantitative density measurements on each band of each colony.. These would have been desirable in calcification. determinations, rather than I inear growth measurements.. The density. of a particular band is essentially a function of calcification and.
(45) 29. Figure 2.4(a). X-radiographic Positive of Porites Section from Viper Reef Showing Annual Density Banding.. (X 0.8). Figure 2.4(b). X-radiographic Positive of Porites Section from Leopard Reef. (X 0.6).
(46)
(47) 30. Figure 2.4(c). Figure 2.7. X-radiographic Positive of Porites Section from La r k Pas s Re e f . (X o. 6). X-radiographic Positive of Poorly Banded Porites from Parker Reef. (X 0.6).
(48)
(49) 31. and skeletal extension, although it must be real ised that high density is not only the product of rapid calcification and low extension rate.. It can readily occur where calcification is carried. out at particular sites In the skeletal matrix (as in the case of very dense crystal packing) at normal rates of deposition and extension.. This phenomenon is examined in greater detail later in. this chapter. The dimensions of each annual increment were measured using only qual itative density pattern analysis.. To do this, each. X-radiograph was scanned with a Joyce-Loebl MK 111 CS double-beam recording microdensitometer.. On this machine the beam sl it-width. The greatest possible movement ratio. was set at 2.0-3.0mm.. between the beam and the recording carriage was used, so that while 1 inear exaggeration was usually X2, a ratio of X5 was sometimes. possible with smaller specimens.. Each plate was scanned along the. axis of maximal growth, from the outer surface of the corallum to the point of origin of growth.. It was felt that the use of several. scan 1 ines per colony was unnecessary. as the parameter of most importance to the exercise was maximum growth poss1ble for the colony in any year.. To avoid the problem of. spu~iously. high growth. rates being taken as representative of colony growth as a whole due to exaggerated asymmetry, those colonies with extremely elongated profiles were not used.. In all cases then, the maximum growth axis. remained relatively similar in dimension to the "average" growth axis.. Where extreme lenticular development was found on the surface. of a colony, the axis of maximum extension was taken to finish at a point on an estimated smoothed surface, and this fact noted on the graph output from the densitometer.. Most densitometer traces showed. a series of distinct peaks and troughs (Figures 2.5a, b).. Some.
(50) THREE. ISLES. 08610. \Colony centre. i. -CI U1. c(i). \. 'Collected. 0. July. 1976. t. _. Horizontal .L. Figure 2.5(a). Time. MicrodeQsitometer Trace of Porites X-radiograph from Three Isles. Exaggeration. x2 W N.
(51) WHEELER REEF 20151. co{on y /. centre·. A. >--.. ..q..J. tf). c. --- Collected June 1975. (1). o. -E--Time. Horizontal. Exaggeration x2 w w. Fi gLi re 2.5 (b). Mi crodens i tometer' Trace of. Porites X-rad i ograph from Whee 1er Reef.
(52) showed small scale serrations corresponding to fine structural features of the skeleton (Figure 2.6).. These were in no case large. enough to mask the large density variations in the skeleton indicated by the traces... Minimisation of the prominence of these. small Irregularities was facilitated by using the maximum slit-width possible on the densitometer, in order to average the scan path over several coral lite diameters.. Some traces did not show readily. recognisable sequences of high and low density banding, reflecting a lack of density contrast in the original corals (Figure 2.7). reasons for this lack of contrast could not be determined.. The. These. corals were of no use to the study and were discarded.. The traces. were unreliable at the very edge of the specimen image.. When the. slabs were X-rayed, the outer growth surface of the sl Ices was seldom parallel with the Incident X-ray beam.. Thus, only where the beam. passed through the full thickness of the slice was the image truly representative of skeletal density.. This error was compounded during. densitometry, as the entire beam had to pass through the image at a point representative of the full thickness of the coral 51 ice before a valid reading was obtained.. The absolute dating of the density. features within the skeleton depended on the date of collection. represented by the growth surface at the edge cif the colony.. Thus,. although for most of its length each trace gave sharp indication of the points of maximum and minimum skeletal density, it was often difficult to relate directly those features to the beginning of the t. ra ce.. lntereretation.of Measurements In all the X-radiographs, the last obvious feature before the growth surface was related to the recorded date of collection.. From.
(53) MYSTERY. CAY. 36001. I~. ~. ~. U). c. (1). o. I " Collected July 1975. Horizontal ~---. Exaggeration. x5. Time W \.l1. Figure 2~6. Microdensitometer Trace of Porites X-radiograph from Mystery Cay Reef) Showing Fine Scale Skeletal St ructures ,as Serrat ions.
(54) 36. interpolated analyses, all led with results obtained from vital staining experiments, it was found that in almost every case the density peaks occurred in the later summer months, and the lows in late winter.. Some minor. departures were noted, arising perhaps from. an inability to read the exact nature of the density band at the colony growth surface.. A gradual shift in the time of deposition of. density bands was also noticed as the latitude from which the coral was collected changed.. This feature is discussed in Chapter Five.. All the traces were analysed using the last detected low density (LD) band as a marker to represent the winter months prior to collection. In this fashion, all the skeletal features of the colonies could be dated. Annual growth increments were determined by measuring the real distance between the LD extremes (winter minima).. It will be. remembered that the densitometry techniques employed ensured that these values represented the optimal annual radial extension rate of the colonies.. Staining Experiments When the investigation was started in 1975, it was felt that some verification of seasonality in density banding was necessary. Accordingly, fol lowing the method used by Barnes (1972), several large colonies of Porites z.utea in a large shallo""l pool at Geoffrey Bay, Magnetic Island, were selected for staining.. The prograrrme. entailed 24-hour Al izarin incubation periods at the extreme spring tide range during the months of April, August, and December in each year of a. three~year. period.. Unfortunately the stains could only be. laid in April 1975, April 1976, August 1976, December 1976, and April 1977.. This spread of dates was sufficient, however, to 311m'l.
(55) 37. the correlation of density band types with time of year.. The. results of the experiment are shown in Table 2.1 (including real growth Increments for the largest colony). The technique used in the Alizarin experiment is described in Barnes (1971, 1972) and in Lamberts (1974).. Al izarin is a substance. (sodium al izarin sulphonate) which can be incorporated into the coral's skeleton during calcification.. It is deposited at the site. of calcification and is an accurate measure of calcification activity In the skeleton (Lamberts 1974).. The present use of the. Alizarin dye method was not to measure calcification, but to insert skeletal time markers In the coral la, to correlate afterwards with X-radiographically determined density bands.. The intertidal colonies. of Porites were bagged in situ at 10'.'1 ItJater spring tide, and about 5 grams of Al izarin powder introduced into each bag (estimated volume. = 4- 5m 3), and well mixed by agitation.. The bags were left. on the colonies through two full tidal cycles, then removed. The colonies. ~vere. sectioned and X-rayed in April 1979, and. showed five very distinct red bands in their skeletons. shm'ls band after one year from a colony.. Figure 2.8. Two staining periods showed. as very heavy red bands, while the remaining three were lighter in colour.. No reasons could be given for this difference.. The finest. line (April 1976) was less than O.5mm in vlidth, while the heaviest (April 1975) was more than lmm wide.. The correlation between the. position of these red bands and the type of density band in proximity to each of them allowed accurate determination of the month of density band deposition. ~uring. The mean annual growth rate of this colony. the experiment was .83cm!yr.. The experiment at Magnetic Island confirmed the seasonal nature of dens i ty band i ng in the cora 1s.. High dens i ty (HD) bands \,!ere.
(56) Figure 2.8. Wedges from P. Zutea Colony, Geoffrey Bay, Magnetic Island, Showing Skeletal Increment During One Year Following Alizarin Staining.. Figure 2.9. X-radiographic Positive of Porites Section' from Moated Reef Flat, Holbourne Island, Showing SubAnnual Fine HD Bands. (X 0.5).
(57) ;() f. '). {{(WUUU.
(58) 39 formed between October and March, while low density (LD) bands were laid down from April to September. discussed in later chapters.. The importance of this is. It is essential here to differentiate. betltleen growth (volumetric and 1 inear), and gross calcium carbonate deposition.. In almost every colony used in this investigation, the. LD band occupied the major proportion of the width of each density pair-band.. A very few colonies excepted to this rule, and these. showed extremely slow and consistent growth overall.. The average. proportion of HD to LD skeleton in the colonies was 1 :3.. This would. seem to indicate that the greater part of the annual 1 inear expansion of a colony took place in the winter half of the year, but it says 1 ittle about the seasonal ity of calcification, since the relationship between the two variables is not clearly understood. It proved possible, however, to make some statements on this problem, based on observations made on some intertidal Porites microatolls From Holbourne Island, north of Bowen, in North Queensland. These colonies have been described in the I iterature in relation to their function as indicators of changes in reef flat morphology (Hopley and !sdale 197j).. When sectioned and X-rayed, these showed. very fine pair bands within the larger annual scheme of density pair-bands (Figure 2.9).. There are 13 or so fine pair bands in. every annual pair-band, indicating a lunar periodicity.. These fine. bands may approximate the periodicity reported by Buddemeier and Kinzie. (1975), although they found that fine structure variation. was closely associated with fine LD bands, in a 1una r cycle. Interpolation of the s pac i ng of these fine bands reveals that only about one' third of the total 1 i near g roltlth in a year is comprised of the major HD band, this being laid down from OctoberNovember to about March.. The remaining months of the year show LD.
(59) TABLE 2.1:. RES ULTS OF STA I NI NG--MAGNET I C I SL/\ND CORAL. Date of Staining. Gro~"th. Increment. Density Characteristics. April 1975. slightly before minimum density. April 1976. almost at minimum density 1.5mm. August 1976. between maximum and. mininlum density. 2.5mm December 1976. at maximum density. 5mm Apr i 1 1977. between maximum and minimum density. 7mm Ap r i 1 1978 (colony surface). difficult to read, but close to minimum density.
(60) 41. banding.. Since the relative HD-LD absolute density figures were. not measured, it was not possible to ascertain the period during the year when the highest gross amount of skeletal material is laid cfown.. However, results from elseltJhere (Highsmith 1979) suggest. about equal deposition of calcium carbonate in each period. In summary, the staining experiments reI ied on existing techniques to verify the seasonal ity of density banding.. These. methods were quite suitable for time marker inclusions several months apart in the field, but would not have suited monthly stainings in fieldwork, chiefly due to the width of the Al izarin 1 ine deposited in the skeleton.. The util isation of the fine lunar pair-. bands found in intertidal colonies effectively solves the latter problem.. Statistical Analysis Of the more than 1000 colonies collected, the majority were rejected for study, for reasons described earl ier. colonies vJere deemed suitable for analysis.. In all, only 452. Statistical investig-. ations of the growth data were performed on the James Cook University of North Queens land 1 s DEC-System 10 computer.. The grmvth data. recorded on the microdensitometer traces were coded onto cards and read to disk. data:. The fol lowing identifiers were placed with each colony. reef code; latitude; shelf zone; reef zone; depth; date of. collection; species. The reef code developed for the analysis consisted of a numerical code containing the elements of both a north-south sequence for each reef, and an identifier for each colony.. Latitude was represented as a decimal value (i.e. 17°30 1 S became.
(61) 42 17.5 5), so that the variable was able to be used in inter~al level 0. calculations. The relative position of the collection areas on the continental shelf to the shorel ine and the open ocean was coded initially into three units; representing three equal divisions of shelf width in each location.. The zone closest to shore received the highest value,. and the most ocean-ward the lowest.. Later, this scheme was found to. lack sensitivity, and the real values from shorel ine and outer barrier in nautical miles were substituted.. This variable was called. shelf zone. Reef zone was coded as an ordinal variable from one to five units, in an order which represented the decreasing degree of energy in terms of water motion (windward crest to leeward edge).. It was. recognised that this ranking was based on assumed conditions rather than on any measurements made In the field, but follows the conventions described in the 1 iterature (see Stoddart 1969).. Depth measurements were combined into three classes, those above one metre deep, corals between one and five metres deep, and those deeper than five metres.. In the final analysis, it was found. that, for the purposes of this study, the latter. two groups could be combined to represent "deeper" corals, as distinct from "surface" corals, without affecting the results of the statistical analysis. The date of collection was recorded to provide a time marker for the density band at the colony surface, in month/year format. The species of each colony was recorded in nominal form only, each species being assigned a numeral from one to eight.. This level of. measurement allowed for certain classificatory statistics only. Specially written computer programmes were used to calculate the following variables:.
(62) 43. mean annual growth rate for each colony; age of the colony; total diameter; standard deviation of annual growth rate; coefficient of variation of annual growth rate. The values of the mean growth rate for all colonies were tested for normality (approximation to the normal distribution) and the decision was made to use non-parametric statistics in the Investigation of relationships between variables.. All these analyses were. performed using the SPSS system package. The methodology used In the study ensured that for each colony there existed a complete record of Its growth for each year of its life, along with as detailed an array of the environmental factors associated with its location as it was possible to obtain..
(63) CHAPTER THREE GROWTH RATE VARIATIONS IN A UNIFORM ENVIRONMENT The multi-scale analysis of growth rate patterns In the Great Barrier Reef Province was initially based on the hypothesis that colonies of the same species from a uniform environment should show a simi lar response to changes vJithin that envi ronment.. In the. present case, the delineation of an environmentally uniform area represented no small problem, but it was assumed that the external controls on growth would be similar for al I colonies in a small isolated pool on a reef flat set some distance back from the reef crest.. Such a srT'.all pool \,Ias found on Fairey Reef, located in the. •. •. central part of the Province at 19 35'S, 148 521E.. The pool was 15. metres in diameter, having a flat sandy substrate, which remained submerged to about 0.5 metres at 11.L.H.S. represented by. POY'-ites, vJ i. The area was well. th some 80 sma 11 co Ion i es bet\"Jeen 3.95. and JBcm in diameter residing in the pool.. The 28 colonies used in. the analysis were taken from this popUlation in October 1976. t1any biological experiments which investigate the reactions of organisms to enyironmental change employ the principle of using control organisms against which to compare those reactions in the subjects of the experiments.. The control organisms must be of the. same species as the subject organisms in order to make any val id comparisons. this exercise.. The problem of species definition is fundamental to Linnaeus bel ieved that the species was a unit that. could be defined on a morphological basis.. Since his time, a radical. change has occurred in the species concept.. Today, most taxonomists.
Figure


+7


Related documents
نیا هک اجنآ زا تتسا رکذ لباق همانتشتسرپ نایوجتشناد یور نر م هدتش یندومزآ یور رب همانشسرپ یارجا زا لبق ،دوب ،شهوژپ یاه همانشتسرپ ققحم دروآرب روونم هب ار یونعم شوه ی رابتعا
Therefore, the relationship between shocks to consumer sentiment, economic policy uncertainty and the S&P500 Index (i.e. mood) are accounted for when interpreting evidence
It is of importance to note that the regulations apply only in respect of a tax debt owed by a debtor where the liability to pay tax debt is not disputed by the debtor.. PRE 13
treatment with Wilhelmi growth hormone... Ratio of cortisol production rate to urinary 17-OHCS excretion in older infants and children with various pathological conditions including
adultos con este smndrome, los cuatro niflos de que se ha informado hasta ahora tenlan retardo mental. Ambos pacientes estaban cianOticos, let#{225}rgicos y con insuficiencia
Those studies have suggested that neuropsychological test performances may vary in different subtypes of depression (such as with and without psychotic symptoms), and cortisol
Fifty-one IHMs samples were containing 16 dangerous adulterants which are dominated by pain relievers, slimming, aphrodisiac HMs; acetaminophen (ACE), mefenamic acid (MEFA),
The high level of coastal litter in the study region adds to the findings of the Report on the State of the Mediterranean Marine and Coastal Environment, which
