Risk factors for overweight and obesity among
urban women aged 30 to 40years, Vellore,
Tamilnadu
A dissertation submitted in partial fulfillment of the requirement
of
The Tamil Nadu Dr. M. G. R. Medical University
For the M. D. Branch XV (Community Medicine)
iii
Originality
iv
Acknowledgements
I am grateful to the Almighty God for his everlasting love and holding my hand and leading me through out.
I would like to thank and praying for all participants who were most important people for my dissertation ,for sparing their time with me to teach me.
I express my sincere thanks to my mentor and guide Dr. Shantidani, and Co.guide Dr Anu Alexander-My TEACHERS without whose help and efforts I wouldn`t have been able to complete this work. I thank them for their patience with me , for their sacrifices and taking all the efforts to teach me and make me good student
I thank Dr. Kurien George,my co.guide who helped me in reaching to the unreached areas in search of the subjects.
I express my thanks and regards to Dr Jasmine Helan , for her gentle approach , efforts and timely help when I really wanted to walk towards my aim.
I thank Dr.Venkata Raghava, Dr.Vinod Abraham and for their valuable suggestions.
I express my gratitude and thank Dr.Divya Muliyil and my foster sister Dr Dualri for their timely help, suggestions and efforts for the betterment of the study.
I thank my parents, wife, brother ,relatives and my good friends who were constant companion in all my hardships ,constant prayers and encouragement
v
Acronyms
BMI- BODY MASS INDEX
CAD- CORONARY ARTERY DISEASE CHD- CORONARY HEART DISEASE CMD- COMMON MENTAL DISORDER GHQ- GENERAL HEALTH QUESTIONNAIRE
GPAQ_GENERAL PHYSICAL ACTIVITYQUESTIONNAIRE ICMR- INDIAN COUNCIL OF MEDICAL RESEARCH
IPAQ- INTERNATIONAL PHYSICAL ACTIVITY QUESTIONNAIRE
IPAQ-SF INTERNATIONAL PHYSICAL ACTIVITY QUESTIONNAIRE- SHORT FORM
JHW- JAIPUR HEART WATCH STUDY
LSCS- LOWER SEGMENT CAESAREAN SECTION NFHS- NATIONAL FAMILY HEALTH SURVEY OR-ODDS RATIO
vi
[image:5.612.101.524.86.554.2]LIST OF TABLES
Table 3:1 Showing comparison of WHO International and Asia Pacific classification Table 5.1a Socio-demographic characteristics of study population
Table 5.1b Socio-demographic characteristics of study population Table 5-2a Medical history of cases and controls:
Table 5:2b Other Co-morbidity among study participants
Table5.3 Mean calorie and protein intake between cases andcontrols: Table 5-4 Calorie, Protein, Fat intake in study participants
Table 5.5 Physical activity classification based on IPAQ scale
Table 5.6 ‘Symptoms suggestive of common mental disorder’ among cases and controls.
Table 5.7 Comparison of obstetric risk factors in cases and controls. Table 5:8 Nutritional status of cases according to WHO classification Table 5.9 socio demographic factors and overweight/obesity
Table 5: 10 Socioeconomic status of family and overweight/obesity Table 5:11 Personal history (BMI >=25)
Table 5:12 Dietary risk factors and overweight/obesity Table 5:13 Physical activity and overweight/obesity
Table 5:14 Common mental disorders and overweight/obesity Table 5:15 Age of menarche, parityand overweight/obesity Table 5:16 Multivariate analysis for BMI>25
Table 5.17 Dose response analysis –Fat intake and overweight/obesity
[image:5.612.88.529.91.556.2]vii
[image:6.612.87.523.103.427.2]LIST OF FIGURES
Figure 1:1 Energy balance equation
Figure 5.1 Distribution of Religion among cases and controls. Figure 5.2 Distribution of marital status among cases and controls Figure 5.3 SES status among cases and controls
Figure 5.4 literacy status among cases and controls
Figure 5. 6 Scatter Plot diagram showing relation between calorie intake and BMI Figure 5. 6 Scatter Plot diagram showing relation between protein intake and BMI Figure 5. 7 Scatter Plot diagram showing relation between fat intake and BMI
Figure 5. 8 Scatter Plot diagram showing relation between carbohydrate intake and BMI Figure 5. 9 Physical activity among cases and controls
Figure 5.10 Parity among cases and controls
LIST OF CONTENTS
1. INTRODUCTION ...2
2. OBJECTIVES ...6
3. LITERATURE REVIEW: ...7
4. METHODOLOGY ...30
5. RESULTS ...45
6. DISCUSSION ...70
7. SUMMARY AND CONCLUSION...76
8. LIMITATIONS:...77
9. RECOMMENDATIONS...78
ABSTRACT
TITLE OF THE STUDY:. Risk factors for overweight and obesity among urban women aged 30 to 40years, Vellore,Tamilnadu.
DEPARTMENT: Community Health And Development
NAME OF THE CANDIDATE: Dr.Beeson Thomas
DEGREE AND SUBJECT: MD; Community Medicine
NAME OF THE GUIDE: Dr.Shantidani,
CO-GUIDE: Dr.Anu Oommen
Background:
Overweight and obesity are increasing all over the world and women in India are affected
more than men. Risk factors for obesity among young women need to be identified so that the
epidemic can be halted.
Objectives:
1) To study the association of socioeconomic status with overweight (BMI >= 25 kg/m2)
among urban women aged 30 to 40 years in Vellore.
2) To study the association of other risk factors such as diet, activity and obstetric factors
with overweight status among urban women aged 30 to 40 years.
Methods:
The study was an unmatched case-control study in Vellore Corporation. Cases and
controls were obtained by simple random sampling from a list of individuals examined
be taken as women with current BMI >= 25 kg/m2 while controls were women with BMI < 25
kg/m2.. A questionnaire which assessed socio-demographic factors, exercise, depression, diet and
reproductive factors were administered by the investigator. Unadjusted and adjusted odds ratios
were calculated between overweight/obesity and risk factors.
Results with conclusions:
The number of cases studied was 112 (BMI >= 25 kg/m2 ) and 58 were controls (BMI <
25 kg/m2). The unadjusted odds ratio of developing obesity or overweight among women who
belonged to the upper/upper middle class (modified Kuppusamy scale) was 2.74 times higher
than women who belonged to other lower socioeconomic classes ( 95% CI :1.09-7.63).
After adjusting with age and SES, Parity <=2,(p value .004,adjusted OR- 4.99 CI:
1.68-14.83) intake of more than recommended protein (p value .002, OR-3.67 CI:(1.604-8.39), and
history of hyperlipidemia ( p value-.023,adjusted OR-3.95.CI:1.2-12.902) were found to be
statistically associated with overweight .
This study brings out the importance of public health action against obesity which will
further lead to many metabolic complication that can be prevented. Housewives are important
group in family and society, has to be screened educated and treated for obesity and its related
problems.
1. INTRODUCTION
Obesity and overweight are described as a global epidemic by the World Health Organization (WHO)(1)WHO describes obesity as the most neglected public health problem affecting every region of the globe. The disease burden due to obesity and over-weight is very high and is the fifth leading risk of death globally.(2)
WHO defines overweight and obesity using Body Mass Index (BMI) of>=25 as (3)overweight and BMI >=30 as obese.(1).However there is a recommendation for using lower cut-off for Asian Indians of BMI 23.0 - 24.9 as overweight and >= 25 as obese. These are based on morbidity related to BMI(4). WHO estimates about 1.9 billion people worldwide as being overweight, with 300 million meeting the criteria for obesity. (3) Globally, slightly higher proportions of women are overweight (40% women against 38% men) and obese (15% women against 10% men). However, in South-East Asia region prevalence of obesity among women is roughly double of men (2.) Unlike many devel-oped countries, in India prevalence of obesity is higher in urban population and in urban slums it is rising (5)
genetic ,exercise, sex, age, socioeconomic status, endocrine, smoking, diet, pregnancy and physiological changes(6)
Obesity is also associated with high morbidity. Diseases like hypertension, diabetes, in-fertility, dyslipidemia, depression and ischemic heart diseases are some. Some studies have found that an obese woman has 3.8 fold increased risk of dyslipidemia compared to their healthy weight counterparts.(6,7)
Combating obesity is of great public health concern for the future social well-being of populations. High prevalence and the consequences of obesity have made it an easy business, deceiving the public by advertisements of medicines, instruments, belts, special exercises etc to reduce obesity. People are not aware of ideal diet, exercise suit-able for them and appropriate treatment for the related health conditions. They also need to know factors predisposing to obesity and preventive measures. Health communication with behaviour change remains the best for achieving this.
1.2 JUSTIFICATION
Overweight and obesity are significant public health problem that are associated with many chronic health conditions and with higher premature mortality
.
WHO 2014 esti-mates identify 39% of overweight and additional 13% obese adults in this group (2). In South-Asia region women have roughly double the obesity prevalence of men (4), mak-ing it an important study for gender and health.Unlike the developed countries, the prevalence of overweight and obesity in de-veloping countries such as India is higher in urban population. A major concern in India is the rapid urbanisation (30% population) ((7) Changing economy and livelihood options are driving urbanisation which is also increasing in the slums in India. Transiting from rural to urban changes the whole lifestyle to a more sedentary type with marked change in diet. This is probably the reason for a rising prevalence of obesity among the urban slum population ((8))
finan-cially dependent on their husbands. The cause for concern is that persons who are over-weight and obese tend to remain so through their life time (7). In terms of specific mor-bidity, the studies show that an obese woman has 3.8 fold increased risk of dyslipidemia compared to their healthy weight counterparts in future. (6)
This study being conducted among women in the age group of 30-40 is particularly relevant because they comprise 20% of population worldwide. They are also the back-bone of a family responsible for health, nutrition and care giving. Their health determines the health and survival of the rest of the family and they are the key persons influencing
behaviours related to diet and lifestyle choices. Therefore, it is important to intervene and reduce the burden of overweight and obesity when they are younger and tackle causes at the earliest. There are many risk factors known to cause obesity such as diet, physical activity, and family history of obesity, mental health, socio-economic factors and obstetrical factors. There are studies done on prevalence of obesity in women but there are not many community based studies on the risk factors of overweight and obesity particularly in women in India.
2. OBJECTIVES
1) To study the association of socioeconomic status with overweight and obesity among urban women aged 30 to 40 years in Vellore town.
2) To study the association of risk factors such as diet, activity and obstetric factors with overweight and obesity among urban women
3. LITERATURE REVIEW:
3.1 Obesity –a lifestyle disease
Globalization has brought a lot of changes in food habits because of availability, im-proved purchasing power and accessibility of fast foods even in rural areas. Data from National Nutrition Monitoring Bureau (NNMB) surveys showed increase in obesity in last two decades (10)Though a good proportion of Indian people are below poverty line, there has been a definite improvement in economic status of people above the poverty line. This has made more money available for food which coupled with the availability of energy rich food items is resulting in increased energy consumption. (10) India is cur-rently facing the double burden of under nutrition and increasing obesity.(11)
With increasing access to piped water supply, cooking gas, transport, modern tech-nologies and electricity have been useful as well as reduces labour. So there has been substantial reduction in physical activity pattern among high SES people. (10)
3.2 Economic cost of obesity
incurs $2741 more in medical costs annually compared with a non-obese person. The annual cost of lost productivity due to obesity is around $73.1 billion, (13)and people spent almost $121 billion annually on weight-loss services and products. In addition to the direct costs of obesity in terms of the individual's ill health and weight management, there are costs due to reduced quality of life (intangible costs), and societal costs in terms of loss of productivity due to sick-leave and premature pensions (indirect costs).(13)The indirect cost can extend to poor employability.
Recent studies from united states showed that percentage of people getting rejected
due to obesity alone was 18% in army recruitment .(14)This is serious since the National
centre for health statistics reported that 23% of young adults were obese(15)
3.3Definition of overweight and obesity:
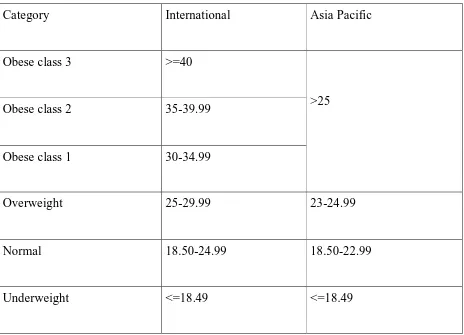
WHO defines obesity as the "abnormal or excessive fat accumulation that presents a risk to health."(16).However, it is generally understood as a measure of the Body Mass Index (BMI). According to WHO guidelines a person with BMI >= 25 is considered overweight and a BMI of >=30 is considered to be obese. The recommended Indian cut off are lower with BMI of 23.0 to 24.9 defined as overweight and >= 25 as obese. (4)
3.4 Assessment of nutritional status in adults
the body fat plays an important role in making a person obese, measurement of body fat gives more detailed and specific information. Regional distribution of excess body fat is linked to the morbidity and mortality associated with obesity. Excessive abdominal fat (‘central obesity’) has the highest risk. (17) Populations (e.g. Asian) who tend to have relatively low BMIs but with excessive abdominal fat are prone to diabetes, coronary heart disease (CHD) and hypertension.(17) A Study done by Gopalan et al showed that almost 20% of adults who neither overweight nor obese had central obesity and were at higher risk of developing the associated diseases.(17). Most widely used criteria are for measurement of body fat are the following-
1) Waist circumference and waist-hip ratio (WHR)
Waist circumference and waist-hip ratio (WHR) are the approximate indices of intra abdominal fat mass and total body fat. A woman with a waist circumference >=88cm has increased risk of metabolic complication. It has been widely accepted that WHR more than 0.85 in women indicates abdominal fat accumulation.(18)
2) Skin fold thickness.
3 )
Indicators to assess extra fat
Ponderal index,Brocca index,Lorentz formula and corpulence index are used to assess obesity.(20).BMI and Broccas index are more widely used for prevalence of obesity in a community(12).Other indicators like measurement of total body water and total body po-tassium are relatively complex and not used in routine studies(21)
3.5 Classification of nutritional status using Body Mass Index
:Table 3:1 Showing comparison of WHO International and Asia Pacific classification (1,4)
Category International Asia Pacific
Obese class 3 >=40
Obese class 2 35-39.99
Obese class 1 30-34.99
>25
Overweight 25-29.99 23-24.99
Normal 18.50-24.99 18.50-22.99
Underweight <=18.49 <=18.49
3.6AETIOLOGY
The etiology of obesity is far more complex than simply an imbalance between energy intake and output although this concept allows easy understanding of the various mechanisms involved in development of obesity.
This mechanism is presented in figure 1.1 (22)on next page
Other Possible factors in the development of obesity (22)include the following:
• Genetic, Metabolic and endocrine factors • Race, sex, and age factors
• Socioeconomic status and cultural factors
• Dietary habits and physical activity • Smoking cessation
• Psychological factors
•
[image:21.595.99.525.120.708.2]0 kcal/24hrs
3.6.2 Pathophysiology of obesity:
Hypertrophic versus hypercellular obesity
According to cellular basis for obesity, adipocytes maybe increased in size or number in obese people. Android abdominal obesity is an example of hypertrophic obe-sity caused by enlarged fat cells. Hypercellular obeobe-sity is more variable than hypertrophic obesity. Hypercelular obesity occurs commonly in childhood or adolescence obesity, but it is also found in severely obese persons.(22, 23)
Hypertrophic obesity usually starts in adulthood. This type is associated with in-creased cardiovascular risk and other metabolic complications. Hypertrophic obesity re-sponds quickly to weight reduction measures like physical activity whereas hypercellular obesity does not respond to nonsurgical interventions.(22, 23)
3.6.3 Epidemiology:
According to National family Health Survey-3(NFHS-3) in India, overweight and obesity are three times higher in urban areas than in rural areas and more common among women. (15) There is also a rising prevalence of obesity among the slum popula-tion.(25)In an urban slum of Chennai the prevalence of overweight/obesity was highest (42.7%) in the age group between 30-39 years.(26)An ICMR study conducted to measure prevalence of risk factors for non-communicable diseases in residents of urban and rural areas of Vellore in 2012{unpublished, in press}(9)has shown that prevalence of Body mass Index ≥25 kg/m2in urban women in the age group of 30-40 was 55.8% while in ru-ral women of same age group it was 41.2%.Another multi centric cross sectional study in 2000 involving seven urban cities in India (Chennai, Bangalore, Hyderabad, Mumbai, Culcutta and New Delhi) showed prevalence of obesity was 31% in 20-40 years of age group (sample size: 5288 men; 5928 women).(27)
The Jaipur Heart Watch (JHW) was a combination of many cross-sectional epi-demiologic studies. This study was conducted in India in multiple rural and urban loca-tions covering both men and women aged 20-59 years . Age-adjusted prevalence (%) of obesity in various cohorts of rural JHW, urban JHW-1, urban JHW-2, urban JHW-3 and JHW-4 respectively were 8.9, 15.7, 45.1, 61.5, and 57.7(r2 =0.88, P=0.018) among women and 9.4, 21.1, 35.6, 54.0, and 50.9 (r2 =0.92, P=0.009) among men. (28)
in women.(29) In contrast, a cross sectional study done by Pradeep et al inurban Calicut, Kerala showed prevalence of overweight and obesity in women as 17% and 6.45% respectively. The same study reported 38.26% women with central obesity.(30)
Trends in Prevalence of obesity:
Gupta R from Jaipur carried out three epidemiological studies in the years 1994,2001 and 2003. These studies showed rising trend in obesity with prevalence of 20%, 36%, and 62% respectively.(28) Similar findings were reported from studies done in urban Chennai showing increasing prevalence of overweight/obesity at 23% in the year 1995 , 30% in 2000 and 42% in 2012.(26,27)
3.7
Risk Factors for Obesity and Overweight
3.7.1
Age:
Obesity can occur any age and incidence of obesity increases with Age. Misra et al showed an increasing trend with advancing age the study done in north India (chi-square for trends=14.1, P<0.001). (5)About 33% of obese adults have been so since childhood.(31)Pradeep et al, Anuradha et al and many other studies have also demon-strated significant increase in obesity with advancing age.(9,17,26.28-30)Body fat in-creases with ageand as people grow older their basal metabolic rate falls and energy ex-penditure decreases. If caloric intake remains constant or increases the older peoplewill gain weight. (6)
3.7.2
Sex:
obesity is more prevalent in women (15.6%; 95% CI 10.7-22.3) as compared to men (13.3%; 95% CI 8.5-19.5) Men have a higher resting metabolic rate than women and so they require more calories to maintain body-weight. In postmenopausal women, de-creased metabolic rate and alterations in ovarian hormones accelerate the age-related in-crease in obesity and dein-crease energy expenditure. This explains why more women are obese especially after the age of 50 years.(33)
3.7.3 Genetic factors
It has been proved that 30–70% of the variance in BMI in humans can be explained by genetic factors.(34) More than 300 genes, chromosomal regions and markers
have been found to be associated with obesity phenotypes.(35) The discovery of the leptin gene has explained the role adipose tissue plays in the regulation of energy bal-ance and appetite.(36).Leptin acts within the arcuate nucleus of the hypothalamus. It de-creases the expression of orexigenic signals and inde-creases anorexigenic signals, thus re-ducing appetite and food intake.(37)These genemutation mechanisms explain only a very small proportion of cases of obesity.
mass and obesity associated) gene has been confirmed in a number of large population studies.(38)
3.7.4 Education and literacy
:
The level of education is inversely associated with obesity particularly in women. (39,40)A national obesity survey in South Africa demonstrated that women with greater than 12 years of education had higher BMIs than women with lesser than 12 education(p < 0.0001) by multivariate regression analysis. Women in the latter group tend to perform manual labour more than the educated women. This may explain inverse association of obesity and education. Similar finding was shown in a study done in Chennai, South India with overweight/obesity among 42.2% of women with a higher secondary level or higher
educa-tion as compared to 29.3% illiterate women.(26)
education compared to his or her peers, the lower is the probability of the individual be-ing obese. The latter effect may be because of different levels of perceived stress experi-enced by individuals and by different coping mechanisms.(41)
3.7.5 Socioeconomic status (SES)
SES is a complex, multidimensional concept and is typically represented using one or all of the “triad”of indicators; education, income and occupation. Beyond the many studies that use these three SES measures, socioeconomic status (SES) has long been known to affect health, with better SES being associated with benefits to health)(41,42).SES-based disparities have been shown across a range of health outcomes in adults, including obesity. Previous studies have shown that influence of SES on health begins early in life with lasting influences on their adult years (43)
obe-sity from the rich to the poor within countries may happen at a higher level of economic development .(44)
Mclaren, in his review “socioeconomic status and obesity “updated Sobal and Stunkard's exhaustive review of the literature on the relation between socioeconomic status (SES) and obesity.(45) The overall pattern of results, showed an increasing pro-portion of positive associations between SES and obesity as one moved from countries with high levels of socioeconomic development to countries with medium and low levels of development. This finding was irrespective of gender.
He has concluded this from 333 published studies. Findings varied by SES indicator. The negative associations (lower SES associated with obesity ) for women in developed countries were most common with education and occupation as compared to positive as-sociations for women in medium- and low-development countries were due to income and material possessions. This finding is interpreted in light of trends related to globaliza-tion.(45)
Subramanian et al found in their study that the risk of over-nutrition at the indi-vidual level tended to be especially high in states with high income inequality. This find-ing was statistically significant after adjustfind-ing for various individual covariates as well as state economic development(Odds ratio -1.19 (95% CI 1.03 to 1.37).(46)
Although Sobel(39)and Mclaren from their extensive studies showed positive association with obesity and SES studies; the studies done in India showed that women who belongs to high SES group had higher risk of developing obesity as compared to women who belongs to low SES. Anuradha et al and Pradeep et al demonstrated that same findings in their study.(26,30)
3.7.6 Duration of sleep.
Physiologic studies suggest that less duration of sleep has metabolic effects that
predispose to obesity. Patel et al demonstrated the association between self-reported
sleep duration and subsequent weight gain by studying 68,183 women who reported
their usual sleep duration in 1986 and were followed for 16 years. Multivariate analysis
after adjusting for physical activity and dietary intake showed that women sleeping 5
hours or less gained 1.14 kg (95% confidence interval (CI): 0.49, 1.79) more than did
those sleeping 7 hours over 16 years and women sleeping 6 hours gained 0.71 kg (95%
CI: 0.41, 1.00) more.
The relative risk of a 15-kg weight gain was 1.12 (95% CI: 1.06, 1.19) for those
1.11). (48)Robert et al found that reduced amounts of sleep was associated with
over-weight and obese status.(49).An inverse relationship between short sleep duration and
central obesity was found in women after adjusting for confounders in a study done by
jenny et al.(50) Chaput et aldemonstrated that Short(5hours )and
long-duration(>9hours ) sleepers were 35% and 25% more likely to experience a 5-kg weight
gain respectively, as compared with average-duration(6-8hours) sleepers in a
prospec-tive study done for 6 years.(51)
3.7.7 Diet:
There are strong cultural influences on the types of food consumed .There are communi-ties abstaining from particular types of food. Method of cooking is also important. A high fat diet enriched with saturated fatty acids is common in high SES families and de-veloped countries. In contrast, majority of people get their calories from a vegetarian diet in developing countries.(52, 53)
The modern diet contains more fat and less fiber than the recommended levels. Studies have demonstrated that food containing saturated fat results in obesity as com-pared to food containing unsaturated fatty acids.(56–58). Fatty acids promote
adipogenesis, and expansion of adipose tissue depots.(59) Studies have confirmed the positive association between a high-fat diet and obesity.((60,61)
Protein intake is positively associated with obesity (62,63)High protein and low carbohydrate food are proven intervention for reducing weight for obese people. (63)(Short-term high protein diets had beneficial effects on obesity and overweight and CAD risk. (64) But in contrary, one study has shown that 20% higher protein intake re-sulted in a 50% lower body weight regain (65)Regained weight consisted of fat-free mass only, and was related to increased satiety and decreased energy efficiency.
3.7.8 Physical activity:
3.7. 8 a Tool for measuring Physical Activity
IPAQ (International physical activity questionnaire) short form is an instrument used primarily for population surveillance. It has been developed and tested for use in adults for assessing physical activity (age range of 15-69 years). (72)
2 studies done in Vietnam and Asian population showed Criterion validity for the IPAQ
(ρ = 0.21) accepted but lower validity. The SP2PAQ showed good validity and repr o-ducibility for vigorous activity, but performed less well for moderate activity particularly in Indians. This questionnaires overestimated energy expenditure from physical activity to a greater extent at higher levels of physical activity than at lower levels of physical ac-tivity.(73,74)
Paul H lee et all in his review he has found that correlation between the total physical activity level measured by the IPAQ-SF. It’s objective standards ranged from 0.09 to 0.39;None of the study in his reviews reached the minimal acceptable standard in the lit-erature (0.50 for objective activity measuring devices, 0.40 for fitness measures).. Most of studies the IPAQ-SF overestimated physical activity level by 36 to 173 percent while one study alone underestimated by 28 percent.(69)
But one study done in North India by Ravi Prakash Upadhyay shown that IPAQ validity, spearman correlation coefficient ranged from 0.42 to 0.43 .IPAQ short form can be used to measure PA in community settings.(75)
IPAQ has validated in Punjab for Punjabi version and recommended for Indian popula-tion. The Spearman coefficient (ρ= 0.994) to (ρ= 1.00), indicating good validity.(76)
3.7.9 Depression
There are some common mental disorders associated with obesity. Depression, person-ality disorder and anxiety are some of them.(6).There was a statistically significant and positive relationship between depression and BMI (r = .201, p< .01) in a study done among women.(77).Many studies have been done and have confirmed positive associa-tion of obesity with depression. The associaassocia-tion works bidirecassocia-tionally. Obesity is a risk factor for depression and depression is a risk factor for obesity .(78)
One study found that being overweight has 1.27 times increased risk of developing depression. (79) Another study found that the prevalence of depression was 6.5% in overweight women and 25.9% in women with BMI >35.(80).
study conducted on 323 young adult females by Pin Lin et al showed depression has
positive association with obesity ( odds ratio = 1.17, 95% CI = [1.11, 1.23], p < .001).(81)
3.7.10 Obstetrical risk factors:
A longitudinal growth study demonstrated that prevalence of obesity in women who reached menarche before the age of 11 was 15% while it was 4% in those who reached menarche after 15 years of age.(82) Fat accumulation during childhood increases the chances of early menarche. Longer period of positive energy balance has been noticed in girls with early sexual maturation .(83–85)
A number of studies have shown that a positive relationship exists be-tween gestational weight gain and obesity. Fraser found that women who gained more than the recommended weight during pregnancy (by 2009 Institute of Medicine guide-lines) had three times higher risk of becoming overweight or obese .(86) Failure to lose weight and excess weight gain after pregnancy are important and identifiable predictors of long-term obesity.(87)
0.75; 95% CI, 0.64-0.88 ) than nulliparous or multiparous women. Multiparous women had more visceral obesity than other parity groups(89)Gouda et al in his review shown that obesity has positive association with increasing parity.(8)
There is an association between mode of delivery and obesity and this association works bidirectionally.There are not enough studies with mode of de-livery as a risk factors for obesity. Maternal obesity is associated with higher rates of cesarean section (90)
Maternal obesity is also associated with a decreased intention, initiation and duration
of breastfeeding.(91)One study done by Brenda et al proved that Women who breast-fed had significantly lower weight gains.(87)
3.8 Medical conditions associated with obesity:
Obesity negatively impacts the health of women in many ways. Women who are obese have higher risk of developing diabetes and coronary artery disease.(92– 94)Clinical and epidemiological studies have shown that obesity is commonly associated with hyperlipidemia. But Batisa et al showed that after adjusting for age, association be-tween hyperlipidemia and obesity became weak.(95–97) Obesity is an independent risk factor for the development of coronary artery disease (CAD) in women. It is an
United States, women with a BMI 35 had an odds ratio (OR) of 2.7 for CAD and an OR
of 5.4 for hypertension.(99)
Abdominal obesity was more harmful in women than BMI or weight.
Both.normal weight women and overweight women , waist circumference is an
inde-pendent risk factor for developing CAD.(98)The Inter heart global study of 6787 women from 52 countries found that abdominal fat was more predictive ofmyocardial
infarc-tion than BMI. (100)
Being obese or overweight increase the relative risk of low back pain and knee osteoarthritis. (101–104).Obesity has been implicated in the development or progression of low back pain and knee osteoarthritis (OA) in women. The mechanism by which
obe-sity causes lumbar back pain is poorly understood, but the contribution of both
mechani-cal and system factors is likely.(102)
4. METHODOLOGY
4.1 Study setting
4.2 Study design:
Unmatched case control study
4.3 Sample size
The study was powered to detect 2.5times greater odds of overweight (BMI ≥25 kg/m2) among those with high SES as compared to those with lower socioeconomic status. Assuming that P0 (prevalence of risk factor among controls) =25%, and R (odds ratio of 2.5, based on the results from the previous ICMR study relating overweight and educa-tion
), the
prevalence of risk factor among cases is given by P1P1=45.5%
Sample size n was calculated as:
N=85 in each arm, cases and controls.
4.4 Definition of cases and controls:
Definition of cases:
Any woman (aged 30-40) in urban Vellore, with current BMI ≥25 kg/m2 from the se-lected wards, who participated in the previous study
Definition of controls:
Any woman (aged 30-40 years) in urban Vellore with current BMI< 25 kg/m2from the selected wards and who participated in previous study
Total number of women with BMI ≥25 kg/m2in 2012 study was 264 who were consid-ered potential cases for the current study. Potential controls from the previous study par-ticipants with BMI < 25 kg/m2 were 209.
Inclusion Criteria and Exclusion Criteria
Exclusion criteria: All pregnant women.
4.6 Selection of cases and controls
Detailed diagrammatic algorithm of the study
Cases: any women aged (30-40 years)in urban Vellore with current BMI>25Kg/m2 who participated in previous study
Contols: any women aged (30-40 years)in urban Vellore with current BMI<25Kg/m2 who participated in previous
study
Eligible participants selected by simple random sampling from the list
Meeting the eligible participant at House
Informed consent and including into the study
Interview using structured and semi-structured questionnaire
4.8 Data collection:
Data collection was done by direct interview by principal investigator by question-naire, extraction of information from patient retained records and actual measurement of height and weight.
4.9 Study tools
: Study tool had 4 components.Structured questionnaires to identify socio demographic factors, medical his-tory and dietary intake
Validated questionnaire for assessing risk factors like Depression/common mental disorders (GHQ-12) and physical activity (IPAQ)
Antenatal records for gestational weight gain Assessments of height and weight
Structured questionnaire to identify socio demographic factors, medical history and dietary intake
After obtaining valid informed consent from participants a direct interview was done us-ing a structured, pre-tested, interviewer administered questionnaires. Socio demographic characteristics, socioeconomic status using the modified Kuppusamy scale,history of dia-betes, hypertension, hyperlipidemia and Coronary Artery Disease (CAD) were also ob-tained.
All women with at least one child were asked about the history of breast feeding and mode of delivery for the last child.
Dietary intake was assessed by a single 24 hour recall. Standard cups, glasses, and spoons were used to assess the amount (weight/volume) of food consumed by the partici-pants. If the previous 24 hours included festivals or fasting, the day before was taken into account. Nutrients like calories, protein, fat and carbohydrate present in the food were calculated using the database of “Nutritive Value of Indian Foods‟developed by the Na-tional Institute of Nutrition (NIN)(114). The nutrients from the ready-made foods like biscuits and other packaged food items were calculated from the information given by the manufacturers.
b. Validated questionnaire for assessing common metal disorders:
been validated in different languages and cultures. The optimal threshold for the GHQ-12 was 2/3. This threshold had sensitivity 87.4% and a specificity of 79.2%.(115) Three fac-tors were extracted with Eigen values of 5.0 (depression-anxiety), 1.7 (social perform-ance) and 1.1 (self-esteem) which explained 42.0%, 13.9% and 9.2% of the variance. The split half-reliability was 0.83 while the Cronbach′s alpha was 0.86. The sensitivity(87.4%) and specificity (79.2%)of the Tamil version of the GHQ-12 is high. The factor structure is similar to that reported in other populations. The instrument can be employed as a screening instrument in this population.
This questionnaire has twelve questions with four multiple choice answers codeda, b, c, and d. Participants can choose only one answer from the choices.
They werescored 0—0—1—1 for a, b, c, d respectively. All scores from each question were added up to get a final score (minimum-0, maximum-12). Participants who scored >=3 were considered to have a common mental health disorder needing further evalua-tion
Validated questionnaire for assessing physical activity:
The IPAQ short form asks about three specific types of activity undertaken in the four domains mentioned above as walking, moderate-intensity and vigorous-intensity activi-ties in the previous week. The items in the IPAQ short form provide separate scores on walking, moderate-intensity and vigorous-intensity activities. Computation requires summation of the duration (in minutes) and frequency (days) of the three activities. There are three classifications
• inactive or low or category 1
• minimally active or medium or category 2 • highly active or high or category 3
Detailed algorithm for scoring is mentioned in annexure.
4.10 MEASURING TOOLS
Stadiometer
The mobile stadiometer 217 of Seca Company was used for the study. Its speciality is its top quality material and skill-fully designed assembly system. It is easy to carry around for medical examinations.
The fold away height measuring rod and the platform of this stadiometer can be attached easily comparing to wall mounting type which needs a support for it to be fixed. The strong and large platform can be used at any place. The connections in between and the rod prevent it from shaking and moving. The headpiece shows the exact measurement as the subject stands on the platform. It has clearly marked scale on both sides, graduated in mm that helps in reading the result and can measure height up to 205 cm.(116) Height was checked three times by stadiometer average was taken
The technique of measuring height
• The subject should stand against the measuring rod with back, buttocks and heels
touching and the heels must be together.
• Both arms and the shoulders should be relaxed and held loosely at the sides. • The head must be in “Frankfort horizontal plane”. It is the line joining the margin
• Now the headpiece is brought to the top of the head, so that it helps to take proper measurement and does not get alter with the type of hairs.
Digital floor scale:
It has equipped with high precision strain gauze sensor with capacity of 150kg maxi-mum. It batteries powered and can register weight in increments of 100 grams.(117). One should be careful to watch out for the display of zero between every measurements. One should be careful about correct position of subject and to remove shoes, shawls etc before weighing.Weight was checked three times and average was taken
4.11 DATA ANALYSIS
4.11a Descriptive Analysis
:
4.11b Risk factor Analysis:
Bivariate analysis was done using Chi square test to study the associations between cate-gorical variables. Independent t test was done to compare means between two groups. Uni-variate analysis was done to generate an odds ratio and 95% confidence interval for the risk factors. Risk factors which had significant p values were included in the multi-variate analysis by a backward conditional logistic regression model.
To check dose response relationship, Risk factor analysis was done for (women with BMI>30 ) and (women with BMI<25 ) also.
4.12
Dietary risk factors:
Each participant’s ideal weight is calculated by Robinson formula for women. Ideal Body Weight (in kilograms) = 49 kg + 1.7 kg for each inch over 5 feet.(118).
Energy
Calorie requirement for a particular woman is calculated with respect to her physical activity and for her ideal body weight according to the “Nutrient requirements and rec-ommended dietary allowances for Indians by ICMR.(119). The recommendations are as follows,
For analysis, women who were taking more than recommended for their ideal body weight and physical activity were compared with women who were taking either equal or less than required
Fat:
Fat requirement for a particular woman for ideal body weight and physical activity were calculated as given below,
Sedentary woman for her ideal body weight -20g/day Minimally active woman for her ideal body weight-25g/day Highly active woman for her ideal body weight -30g/day
Safe level of fat is -50g(119). For analysis comparison between women who were tak-ing more than 50g and women were taktak-ing equal to or less than 50g were considered.
Protein:
Each women irrespective of their physical activity for their weight requires 0.83g/kg/day .(119)
Carbohydrate:
One gram of carbohydrate gives four kilo calories.65-80% of total energy intake should be contributed by carbohydrate.(119) This was calculated individually for each partici-pants. For analysis women who were taking more than 80% of total energy intake from carbohydrate were compared with women all others.
4.13 Bias:
1. Recall bias-
Recall bias may occur in assessing diet, exercise and obstetrical risk factors. Underestimation of diet is a distinct possibility and therefore the PI will use standard bowls to get the amount of food as accurately as possible.In order to avoid inaccuracies in obstetrical risk factors bias, the interviewer will look at documents such as antenatal cards. The recall bias is expected to be non-differential bias as we do not expect BMI to influence these exposure histories.
2. Interviewer Bias:
3. Measurement bias
Measurement bias can arise from weighing machine and stadiometer. To avoid that weighing machine will be used after calibration with a standard weight. Height of the subject will be checked twice and the average will be taken for analysis.
4.13 Implication of the study size-
5. RESULTS
5.1.1 Demographic characteristics of study population:
A total of 170 women were recruited in the study, among whom 112 were cases (BMI ≥
25 kg/m2) and 58 were controls.
[image:53.595.68.543.340.594.2]The socio-demographic characteristics are shown in Table 5.1. The mean age of cases and controls were 37.13 (sd 2.08) and 36.29 (sd2.87) years respectively.
Table 5.1aSocio-demographic characteristics of study population
Variable Categories Cases (BMI ≥25 kg/m2) N=112
No (%)
Controls (BMI < 25
kg/m2)N=58 No (%)
30-35 30(26.7) 24(41.3)
Age (years)
36-40 82(73.3) 34(58.7)
Hindu 95(84.8) 49(84.5))
Christian 10(8.9) 7(12.1)
Religion
Muslim 7(6.3) 2(3.4)
Married 102(91.1) 49(84.5)
Single 4(3.6) 5(8.6)
Separated 1(.9) 0
Marital status
Figure 5.1 Distribution of Religion among cases and controls.
Among the cases and controls, the illiteracy rate was 22.3% (25) and 32.8% (19) respec-tively. Majority of cases and controls had studied beyond middle school level (64.3% and 52.2% respectively). Only few had studied beyond 12th grade. Majority of cases and con-trols (81%) were house wife alone.
[image:55.595.73.530.372.671.2]According to Modified Kuppusamy Scale, 50%of cases were from whereas only 32.7% of controls were from middle/upper group. Majority of controls were from upper middle socio-economic group (63.8%).
Table 5.1bSocio-demographic characteristics of study population
Variable Categories Cases (BMI ≥25 kg/m2) N=112
No (%)
Controls (BMI < 25
kg/m2)N=58 No (%)
Housewife alone 91(81.3) 47(81)
Unskilled 12(10.7) 9(15.5)
Semiskilled/skilled 6(5.4) 1(1.7)
Clerk, supervisor 1(.9) 0
Occupation
Semiprofessional 2(1.8) 1(1.7)
Illiterate 25(22.3) 19(32.8)
Literacy
Literate 87(77.7) 39(67.3)
Nil 13(11.6) 10(17.2)
1-4 5(4.5) 3(.2)
5-8 22(19.6) 13(22.4)
9-10 50(44.6) 24(41.4)
11-12 15(13.4) 5(8.6)
Education
>=13 7(6.3) 3(5.2)
1 Upper 2(1.8) O
2-Upper Middle 21(18.8) 5(8.6)
3-Lower Middle 31(27.7) 14(24.1)
4-Upper lower 56(50) 37(63.8)
SES
cate-gory(Modified
Kup-pusamy scale)
Figure 5.4 literacy status among cases and controls
5.1.2 Medical history of study population
[image:58.595.65.538.360.658.2]Study participants were screened for Diabetes, Hypertension, Dyslipidemia during the year 2012 as part of a WHO STEPS study. Participants were asked about their current health status (Diabetes, Hypertension, Dyslipidemia and Depression). Table 5.2b gives the details of their present health status.
Table 5-2a Medical history of cases and controls:
Variable Category Cases N=112
n (%)
Controls N=58
n (%)
Yes 4(3.6%) 2(3.4%)
Diabetes
No 108(96.4%) 56(96.6%)
Yes 4(3.6%) 1(1.7%)
Hypertension
No 108(96.4%) 57(98.3)
Yes 14(12.5%) 3(5.2%)
Hyperlipidemia
No 98(87.5%) 55(94.8%)
Yes 4(3.6%) 1(1.7%)
Treatment
Among cases and controls, more than 96% did not have diabetes/hypertension. All par-ticipants who were diagnosed to have diabetes and hypertension among both cases and controls were taking treatment regularly.
Among the cases, 12.5% had dyslipidemia as compared to 5.2% in controls. Of the total 17 participants with dyslipidemia, only one (case) was on treatment.
[image:59.595.65.531.371.609.2]Based on medical history, 3.6% of cases and 1.7% of controls were on treatment for de-pression. Table 5.2b gives the details on other medical conditions among cases and con-trols.
Table 5:2b Other Co-morbidity among study participants
Medical history No
Seizure disorder- control 1 AtrilSeptal Defect-control 1 Bronchial Asthma -case 2
Hypothyrodism-case 2
Sheehans syndrome-case 1
Tuberculosis-case 1
5.1.3 Diet
Calorie, Protein, Fat intake in study participants
.Energy requirement for each individual was calculated based on their ideal body weight and level of physical activity. The diet of amajority of the study population was deficient in calories(77.7% of cases and 93.2% of cases).
Regarding protein intake, The diet of 43.8% of cases and 75.9% of controls had less than recommended protein
More than 50grams of fat per day was consumed by 48.3% of cases and 29.3%of con-trols. In this study,16.1% of cases and 24.1 % of controls weretaking more than 80% of energy requirement from carbohydrates.
The mean intake of calorie, protein and fat is given in Table 5.3
Table 5.3 Mean ca lorie and protein intake between cases and controls:
*Statistically significant
Difference in mean calorie,protein and fat intake between cases and controls were found to be significant
Variable Category Mean(SD) Mean difference (95%CI) T-test p-value
Case (112) 1644.65(408.26) Calorie
Control (58) 1439(344.61)
204.85 (80.99-328.71) 0.001*
Case (112) 33.85(17.9) Fat
Controls (58) 27.14(14.35) 6.71 (1.70-11.72) 0.009*
Cases (112) 45.93(15.76) Protein
Controls (58) 38.95 (14.352)
6.984 (2.09 –11.87)
Table 5-4 Calorie, Protein, Fat intake in study participants
Varaible category Cases(N=112)
N(%)
Controls 58 N(%) more than
recom-mended for index par-ticipant
25(22.3%) 4(6.9%) Calories
less than required 87(77.7%) 54(93.1%) Less than required for
index participant
49(43.8%) 44(75.9%) Protein
More than required for index participant
63(56.3%) 14(24.%)
Fat More than maximum
level of fat(50g)
49(43.8%) 17(29.3%)
Less than maximum level of fat(50g)
63(56.3) 41(70.7)
Carbohydrate Takemore than 80% of energy requirement from carbohydrates
18(16.1%) 14(24.1%)
Take less than 80% of energy requirement from carbohydrates
Figure 5. 6 Scatter Plot diagram showing relation between calorie intake and BMI
\ Pearson correlation 0.19(p value-0.012)-Statistically significant
Pearson correlation - 0.25(p value-0.001)-Statistically significant
Figure 5. 7 Scatter Plot diagram showing relation between fat intake and BMI
Pearson correlation- 0.15(p value-0.045)-Statistically significant
[image:63.595.80.525.454.687.2]Pearson correlation- 0.13(p value-0.09)-Statistically not significant 5.1.4
Exercise among study participants
[image:64.595.66.531.316.601.2]Physical activity is graded into inactive (category -1),minimally active (category 2) and health enhancing physical activity (HEPA)- a high active category(category 3) using IPAQ scale Almost half of the cases and 35% of controls were inactive.
TABLE 5.5 Physical activity classification based on IPAQ scale
Level of physical activity Cases N=112
Control N=58
Inactive 49(43.8) 20(34.5)
Minimally active 61(54.5) 37(63.8)
High active (HEPA) 2(1.8%) 1(1.7%)
5.1.5
Common mental disorders as assessed by general health questionnaire12
[image:65.595.66.536.197.420.2]Individuals were classified as ‘having symptoms suggestive of common mental disorder’ if the total score was more than two. The maximum possible score was 12. Around 30% of both cases and controls had symptoms suggestive of common mental dis-eases
Table 5.6 ‘Symptoms suggestive of common mental disorder’ among cases and controls.
Variable category Cases n=112
N(%)
Controls n=58 N(%)
[image:65.595.62.558.626.720.2]Present (GHQ score >2) 37(33%) 18(31%)
common mental disorder Absent (GHQ score 0-2) 75(67%) 40(69%)
5.1.6 Obstetric factors
.
[image:66.595.70.526.339.718.2]Majority of women attained (80% both cases and controls) attained menarche at the age of 13 or above.5.6% of cases and 7.4% of controls never became pregnant after 3 years of marriage
TABLE 5.7 Comparison of obstetric risk factors in cases and controls.
Variable Category Cases n=112
N(%)
Controls n=58 N(%) Nullipara(unmarried) 4(3.6%) 4(7.4%) Nullipara (married) 6(5.6%) 4(7.4%)
Para 1 5(4.6%) 5(9.3%)
Para 2 69(63.9%) 28(51.9)
Para 3 27(25%) 14(25.9%)
Parity
Para 4 1(.9%) 3(5.6%)
0 6 (5.6%) 4(7.4%)
Living children
2 70(64.8%) 30(55.6%)
>=3 27(25%) 15(17.6%)
[image:67.595.68.555.255.596.2].
Figure 5.10 Parity among cases and controls
..
5.1.7 BODY MASS INDEX:
Body mass index of participants was computed and cases and controls were classified ac-cording to WHO classification. Acac-cording to WHO classification, 10.3% (6) of controls were underweight (BMI <18.5). Among the cases, 35.7% (40) were obese (BMI > 30) according to WHO classification
[image:68.595.64.370.449.594.2].
TABLE 5:8Nutritional status of cases according to WHO classification
Category N (%)
Obese class 3 (> 40) 4(3.6%) Obese class 2 (35 to 39.99) 9(8.0%) Obese class 1 (30 to 34.99) 27(24.1%) Overweight (25 to 29.99) 72(64.3%)
5.2 UNIVARIATE ANALYSIS
RISK FACTORS FOR OBESITY /OVERWEIGHT IN WOMEN
Information on various potential risk factors were collected and analyzed to assess their association with young women having obesity/overweight. Results are pre-sented under separate sections as socio-demographic factors, medical co-morbidity, diet, physical activity, depression and obstetric factors.
.
5.2.1 Socio-demography factors and its association with obesity
Table 5.9 socio demographic factors and overweight/obesity
Study participants were dichotomized into high (upper and upper middle) and low (lower middle and lower) to study the association between SES and overweight/obese.
Table 5: 10 Socioeconomic status of family and overweight/obesity
95 % CI Riskfactor Cases
No (%)
Controls No (%)
p value OR
unad-justed lower upper Age age>36 72(64.2%) 29(50 %) 0.072 1.8 0.946 3.4 Literacy illiterate 5(4.5%) 3(5.2%) 0.836 0.857 0.197 3.7 Education Education <8 years 40(35.7%) 26(44.8%) 0.248 0.684 0.358 1.304 Occupation housewife 91(81.3%) 47(81%) 0.973 1.014 0.451 2.280 Marital status married 102(91.1%) 50(85%) 0.196 1.873 0.715 4.907
95% CI SES Cases-112
No (%) Controls-58 No (%) p value Oddsratio
unadjusted lower upper
High 23(20.5) 5(8.6)
Low 89 (79.9%) 53 (91.4%)
[image:70.595.66.478.600.718.2]*Statistically significant.
20.5% of cases and 8.6% of controls belonged to High SES.The odds of developing obe-sity or overweight among women belonging to high SES was 2.74 times higher than women who belong to low SES(P value-0.047, unadjusted OR 2.74 and 95% CI:1.09-7.63).
5.2.4 Personal history and overweight/obesity
Presence of diabetes hypertension and hyperlipidemia did not show significant associa-tion with overweight/obesity (table 5.11).There was no significant associaassocia-tion between obesity and sleep less than 6 hours.
able 5:11 Personal history (BMI >=25)
95% CI Cases 112 No (%) Controls 58 No (%) P value
OR unad-justed
Lower Upper Diabetes 4(3.6) 2(3.4) 0.967 .1.037 .184 5.837 Hypertension 4(3.3) 1(1.7) 0.499 .2.11 .231 19.334 Hyperlipidemia 14(12.5) 3(5.8) 0.131 2.619 .721 9.514 Duration of
sleep<6hours
5.2.5 DIET
Calories, protein, fat and carbohydrate consumed by calculated from 24 hour recall diet survey.
[image:72.595.66.541.407.588.2]It was shown in our study that women who take more than required calorie /day were3.8 times risk of being overweight as compared to women who take less than required. In this study women who take less than required protein has lower risk of developing obesity /overweight as compared to who takes more than required protein Other dietary factors like intake of more than safe level of fat and diet with more than 80% of energy require-ment from carbohydrate did not show significant association with obesity.
Table 5:12 Dietary risk factors and overweight/obesity
95% CI
Riskfactor Cases
No (%)
Controls No (%)
p value OR
unad-justed Lower Upper
> required Calories 25(22.3) 4(6.9) 0.011* 3.879 1.280 11.756
< recommended protein 49(43.8) 44(75.9) <0.001* 0.247 0.122 0.502
>safe level of fat 15(13.4) 3(5.2) 0.099 2.835 .786 10.22
>80%of requirement from
carbohydrate
18(16.1%) 14(24.1%) 0.202 .602 .275 1.319
*statistically significant .
5.2.6 Physical activity
.
34.5% in controls. There was no significant association between physical activity and obesity/overweight in this study population.
Table 5:13 Physical activity and overweight/obesity
95% CI Physical activity Cases-112 No (%) Controls-58 No (%)
p-value OR unad-justed
Lower Upper Inactive 49(43.8) 20(34.5%)
Active 63 (56.2%) 38 (65.5%)
0.243 1.478 0.766 2.853
5.2.
7 Common mental disorders and overweight/obesity
Presence of symptoms suggestive of common mental disorder and obesity/overweight was not associated with and overweight/obesity(p-value 0.791).
Table 5:14 Common mental disorders and overweight/obesity
Symptoms suggestive of common mental disorder
Cases No (%) Controls No (%) p- value OR unad-justed 95%Lower (CI) 95%Upper (CI)
Present 37 (33%) 18(31%)
Absent 75 (67%) 40 (69%)
5.2.8 Obstetrical risk factors and overweight/obesity
5.2.8a Age of menarche, parity and mode of delivery
Women whose parity of greater than 2did not show statistically significant association with overweight/obesity.
[image:74.595.68.562.407.608.2]Women whose menarche was prior to 13 years also did not show statistically significant association with overweight/obesity .The odds of developing obesity/overweight among women who had LSCS is 2.98 times higher than women who had normal delivery(OR-2.98, 95% CI:0.96-9.22, p- value-.049).
Table 5:15 Age of menarche, parityand overweight/obesity
Risk factor Cases No (%)
Controls No (%)
p value OR
unadjusted 95% CI Lower 95% (CI) Upper menarche(<13 age)
(Case-112, control 58)
15(13.4) 7(12.1) 0.807 1.13 .43 2.94 Parity (>2)
(Case-112, control 58)
28 (27.5) 17 (24%) 0.406 0.73 0.35 1.52 LSCS
(Case-102, control 50)
5:3 Multivariate analysis:
The following variables were chosen from univariate analysis for multivariate analy-sis namely Socio-economic status, age, hyperlipidemia, taking more than recom-mended calories, taking less than recomrecom-mended protein, mode of delivery LSCS, 3 and more parity.
Table 5:16 Multivariate analysis for BMI>25 (*significant)
Risk factor p value OR(adjusted) Lower 95% CI
Upper 95% CI Age (.36 years) 0.26 1.75 0.715 3.46
SES (high) 0.454 1.372 .600 3.137
After adjusting with age and SES, Parity <=2, intake ofmore than recommended protein and history of hyperlipidemia were found to be statistically associated with obe-sity/overweight .
5.4 Comparison of risk factors among overweight and obese women
with normal women.
Association of Risk factors with obesity was studied for dose response by comparing women who were obese with BMI >30 and women with BMI 25-29.9 with reference category with normal BMI <25
Dose response analysis showed positive association between fat intake and obesity other than history of hyperlipidemia ,SES ,parity >=2,mode of delivery more than recom-mended protein which also showed univariate analysis.
[image:76.595.65.556.546.693.2]Women who were taking more than 50g of fat have 3.88 higher chance of being obese as compared to women who take less than 50g of fat.
Table 5.17 Dose response analysis –Fat intake and overweight/obesity BMI <50gof fat >50g of fat p value Odds ratio Lower CI
95%
Upper 95%CI
<25 kg/m2 55(94.8%) 3(5.2%) Reference reference Reference Reference
25-29kg/m2 64(88.9%) 8(11.1%) .237 2.2 .579 9.063
Risk factors associated with overweight :
After adjusting with age and SES, Parity <=2,(p value .004,adjusted OR- 4.99 CI: 1.68-14.83) intake of more than recommended protein (p value .002, OR-3.67 CI:(1.604-8.39), and history of hyperlipidemia ( p value-.023,adjusted OR-3.95.CI:1.2-12.902) were found to be statistically associated with overweight. Women who takes more than 50g of fat (p value-0.04, unadjusted OR-3.8,95%CI:( 1.02-16.1)
6. DISCUSSION
A total of 170 women were recruited in the study. Among them 112 of them were Overweight by WHO definition (cases) and 58 were controls were normal This study has shown that 73% of obese subjects were in the age group of 35-40 as com-pared to 27 % between 30-35 years. Even though the association was not statistically significant, there was a rising trend in obesity with increasing age . Misra et al (2)found that there was a increasing trend in the prevalence of obesity with age. Pradeep et al in their study have demonstrated similar findings.
Almost 75% of cases and controls were literate. Eighty two percent of them were literate in cases and 62.1% in the control group. It is less compared to the national urban average of 85%. Nine percent of them were widowed at their young age, 5 of them were due to road traffic accidents and four of them due to Myocardial infarction.
According to Modified Kuppusamy Scale, fifty percentage of the cases and 63.8% of the control group belonged to Upper Lower SES Category..A study done in urban slum 70 % of obese people were belonging to upper lower. (26)
educated regarding hyperliidemia, as diseases and its complications which can b pre-vented
More than 75% of study participants among cases (77.7%) and controls (93.2% ) had less than their recommended calorie intake. Nearly two third of both groups were taking less than recommended protein. Among cases, 48.3% were consuming more than maximum level of fat recommended as compared to 29.3% among controls. In this study. 16.1% of cases and 24.1 % of controls were taking more than 80% of energy re-quirement from carbohydrates. This picture shows that the two sides of spectrum of nu-tritional disorders under nutrition and over nutrition problem in community.
According to IPAQ classification <2% were highly active. Reason may be due to urbanization, modern technology or lack of awareness. In this study 33% of cases and 31% of controls likely to have some common mental disorder. However, out of these only <2% women diagnosed to have depression and on treatment. It can clearly be seen that there is a very high number of women with undiagnosed depression in community. .This highlights the fact that there is a need to train primary care physician to screen, di-agnose and treat depression in community.
5.6% of cases and 7.4% from controls who were married for more than 3 years never became pregnant . Primary infertility is still a big problem in community and has to be addressed from a public health perspective.
clearly demonstrates that ignorance and cultural practices regarding breast feeding is still prevalent in community which shows urgent needs in health education and commu-nity participation regarding same.
According to WHO definition 42% of study participants were overweight. A study
done by Anuradha et al in urban Chennai also showed (42.7% in 30-39 years of
age group).(9) ICMR study done in urban Vellore also showed 55.8% .(26).This
study was done in a small age group of the population, which may explain why
there is no significant relation noted between obesity and as age increases.
women with 10 years of schooling has a higher chance of obesity as compared to less than 10th standard. It may be because less educated women were doing other chores like getting water to houses, manual labor work etc.
The odds of developing obesity or overweight among women who belong to Up-per/upper middle class SES was 2.74 times higher than women who belonged to other lower classes of SES(P value-.047.CI :1.09-7.63,unadjusted odds ratio -2.739). This find-ing is different from sobal et al and Mclaren et al that low SES is related with obesity .
should be noted that the greater capacity of the élite to get enough food supplies. Cul-tural values also will be playing a big role on this like body shape and body images.
Number of people who had history of diabetes, hypertension were very low. That explains why there was no significant association with diabetes and other co.morbidities. One should remember that study was done in young age group. However this study concluded that the odds of becoming obese was 4.458 times higher (95% CI: 1.2-9.4) amongst women with history of hyperlipidemia as compared to women without history of hyperlipidemia. This finding was consistent with other studies.(49-51)
It was shown in our study those women who had taken more than re-quired calorie /day 3.8 times risk of being obese or overweight as compared to women who had taken less than the required calorie intake. There were many stud-ies that have shown that rich calorie food is one of the most important causes of obesity.(69,70)
Women who were taking more than 50g of fat have 3.88 higher chance of being obese as compared to women who take less than 50g of fat. This can be explained by high SES peopl