Appendix A1
University of Southern Queensland
FACULTY OF ENGINEERING AND SURVEYING
ENG4111/4112 Research Project
PROJECT SPECIFICATION
FOR:
David O’May
TOPIC:
A Study of Pavement Performance on the Gatton Bypass Duplication
SUPERVISOR:
Ron Ayers
SPONSORSHIP: Main Roads
PROJECT AIM: To assess the viability of pavement cross sections used in the Southern
District of Main Roads Queensland by investigation and analysis of the performance of cross
section types used on the Gatton Bypass Duplication
PROGRAMME:
1. Background (Literature Review)
Moisture in Pavements
Use of TDR Monitoring
Performance of Pavement Cross Section Types
2. Collate and Review available information on Gatton Bypass Duplication Construction
and Performance.
3. Collate data from in-situ TDR Probes
4. Carry out investigation to validate TDR Probe data
5. Analyse TDR probe data
6. Collate Rainfall Data during and since construction
7. Collate and Analyse Deflection Data
8. Carry out performance based assessment (GPR, Roughness, Rutting and Maintenance
Costs)
9. Carry out trenching and materials testing on selected areas.
10. Investigate Design and actual traffic utilisation parameters
11. Assess sub-soil drain maintenance and performance.
12. Establish viability of cross section types used on the Gatton Bypass Duplication
13. Report findings in the required oral and written formats
14. Project future maintenance costs. (if time permits)
AGREED
(student)
(supervisor)
Date: / / 2007
Date: / / 2007
Appendix A2
Project Aim
This project aims to assess the viability of pavement cross sections used in the Southern
District of Main Roads, Queensland by investigation and analysis of the performance of
cross section types used on the Gatton Bypass Duplication.
Specific Objectives
The specific objectives for this project have been taken from the project specification.
This section is included to show the path that the project is taking with justification and
explanations behind the choice of each specific objective.
Research the background information relating to moisture in pavements.
The research will indicate the known paths by which moisture enters pavements and the
impact which moisture has on pavement performance.
Research the background of TDR Monitoring of moisture in soils.
Australia has limited exposure to TDR technology utilised for in-situ pavement moisture
monitoring. Extensive research has been carried out in both the United Stated and
Europe. The research will focus on the how TDR data can be related to long term
performance of pavements. The Long Term Pavement Performance (LTPP) Program in
the United States includes 43 sites with TDR installations from which analysis of ten
years of data has been performed. This, as well as other trial road sections with TDR
installations will provide indications on current research into the applicability of TDR to
Pavement Performance.
Time Domain Reflectometry (TDR) uses complex regression models and new analysis
techniques are being developed to provide additional accuracy. Purdue University in
Chicago recently held the 3rd International Symposium and Workshop on Time Domain
Reflectometry for Innovative Soils Applications. Many of the papers presented at this
Research the background Pavement Type Cross Sections
A number of thesis topics in Australia have focussed on pavement cross section types and
their performance. These will be consulted and overseas research sought. Differing from
the rest of the world, Australia uses an extremely high percentage of unbound granular
pavements. Other developed countries in Europe and also the US tend to use either rigid
pavements or deep lift asphalt.
Collate and Review available information on the Gatton Bypass Duplication Construction
and Performance.
Consultation of the construction records and Main Roads forms the basis for the activity.
Records exist both in Toowoomba and Brisbane on the construction of the project.
Collate Data from In-situ TDR Probes
The reading of the Data began in June 2003. Four years of readings is available from the
Main Roads Materials Branch is Herston, Brisbane. Data for the four years has been
received and another reading is due on the 13
thJuly.
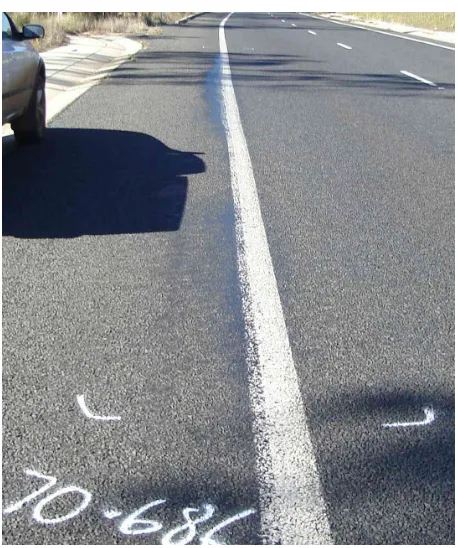
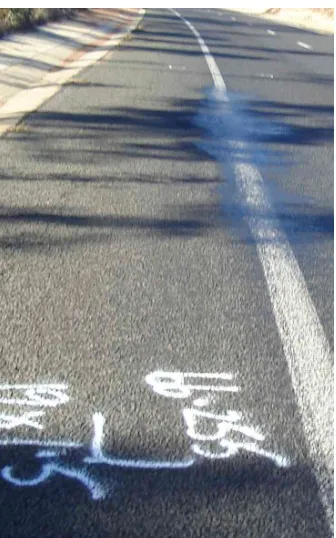
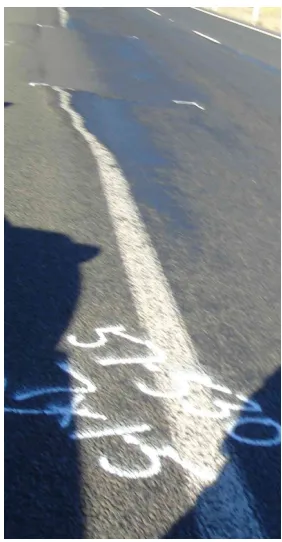
Carry out investigation to validate TDR probe data.
This involves the selection of two sites to carry out trenching and oven drying
assessments at the same cross sectional locations as the probes. The dry density and
moisture content will be determined for comparison with the reading of the TDR probes
on the day. Sites will be selected to be within one to two metres of the existing TDR
installations.
Collate Rainfall Data during and since the construction
Already have data for rainfall at the Bureau of Meteorology (BOM) at Gatton.
Information on the rainfall on site will also be sought from records held by Main Roads
Three Deflection Surveys have been carried out:
November 2003 - Pavement Deflection (PAVDEF) Survey (Entire Length)
November 2003 - Falling Weight Deflectometer Survey (Entire Length
February 2007 - Falling Weight Deflectometer Survey (CH 67-70km)
These reports will be scrutinised and compared to indicate any changes in pavement
performance.
Carry Out Performance Based Assessments.
A Field Inspection will be conducted with an appropriately trained spotter over the entire
21km stretch of the duplication. Noting of all repairs, sections which are performing
poorly and any sections showing distress will be noted. A Field Inspection Form will be
developed to adequately document for future reference the current performance of the
pavement.
The Main Roads ARMIS database will be scrutinised to provide all current and previous
data of the Rutting Roughness and Maintenance Costs on the 21km section of Road.
Investigate Design and Traffic Utilisation Parameters
The Pavement Design for each of the three packages will be compared with the actual
Traffic Utilisation. The increase in Large Heavy Vehicles will also be considered.
Assess sub-soil drain maintenance and performance
Contact will be made the RoadTek Toowoomba to determine the maintenance that has
been carried out on the sub-soil drainage installed on the project. Assessments will also
be made during the Field Investigation of the condition of the outlets of the sub-soil
drains. Consideration will also be given to utilisation CCTV cameras to survey the
sub-soil drainage structures.
Establish viability of cross section types used on the Gatton Bypass
From all the available information from the Field Investigation and the NDT, information
Report findings in written and oral formats
Appendix A3
Project Methodology
The specific objectives as listed earlier in Appendix A2 will now be
considered in terms of how each task will be accomplished, and why the
decision was made to carry out the work this way.
Research the background information relating to moisture in pavements, TDR
Monitoring of moisture in soils and Pavement Type Cross Sections
This will be achieved by conducting a literature review of both print
and web-based sources, from Australia and Overseas. This will ensure
that a wide variety of information is obtained. Worlds best practice for
the application of NDT Technologies exists primarily overseas in
Europe and the US. Moisture on Pavements is well documented in
Australia and has been well documented in the Main Roads Southern
Region. Pavement cross sections in have been developed within
Australia, influenced by a number of local factors, including
availability of resources, low traffic volumes, high percentages of heavy
vehicles and climatic conditions. Cross Sections used by different Road
Authorities throughout Australia will be investigated.
Collect and Analyse Data
All existing data (try to get most of it) within the Main Roads will be
found and compiled into one database. Analysis of TDR, FWD, Pavdev,
GPR and other parameters recorded yearly will be analysed.
Trenching and materials testing during construction will be compiled
and scrutinised and recent and future testing results analysed.
Validation of the TDR probe data.
The current methodology for calculation of the Gravimetric Moisture
Content will be reviewed and compared with world best practice.
Other regression models will be assessed for their applicability. Issues
testing by means of trenching will be carried out to compare with
current TDR results.
Collection of Rainfall Data
Rainfall data will be collate from the nearest BOM site at Gatton. This
will investigated for any impact on TDR results.
Performance Based Assessments
A Field Survey Sheet will be formed and an assessment of the
performance of the Project will be conducted. All existing back-log
information from the Maintenance contractor will be compiled and
reviewed.
Investigate the Design and Traffic Utilisation Parameters
The Pavement designed was based on a then current 10,000 AADT
(Average Annual Daily Traffic). The year after completion the Traffic
Volume increased to 12,000 AADT. The Design Life Traffic for 20
Years was 1.8 * 10^7esa’s. Investigation into current growth and the
current utilisation of the Pavement will be carried out.
Assess sub-soil drainage maintenance and performance.
All maintenance on the sub-soil drainage conducted by the
maintenance contractor will be reviewed. The flushing point for the
longitudinal drainage within the pavements was removed and the
possible impact this has made on the pavement performance will be
considered.
Compilation of results from the data and analysis from the various
areas of consideration will be carried out.
Report findings in written and oral formats
Appendix A4
Sustainability, Environmental and Safety Effects
This project is being undertaken with sponsorship of The Southern District of
Main Roads and plans to determine the viability of the pavement type cross
section for the District. An integral element of this Project is the use and
assessment of non-destructive testing (NDT) for road pavement monitoring.
Advancement in application and integration of NDT into asset management will
improve the quality of currently available data. Improvements in decision making
tools and subsequent, more efficient use of limited financial and natural resources,
will increase the sustainability of infrastructure construction and maintenance.
Identification of action to improve sustainability or reduce negative environmental
outcomes will immediately be directed to Main Roads management. Data
Acquisition work items such as "trenching" pose the only environmental risk for
this project and these risks will be managed. Any uncertainties will be clarified
through consultation with Main Roads Environmental Officers.
Ethical Effects
The ethical responsibility for the work is fully accepted by the author
and at no time will the author compromise the nine tenets of the
IEAust (Institution of Engineers Australia) Code of Ethics.
Members shall at all times place their responsibility for the
welfare, health and safety of the community before their
responsibility to sectional or private interests, or to others
members.
Improved understanding of road pavement performance will be of
benefit to the community, in terms of welfare, health and safety.
Improved Asset Management tools will lead to economic growth and an
improved efficiency in delivery of road pavements with enhanced safety
attributes.
Members shall act in order to merit the trust of the
community and membership in the honour, integrity and
dignity of the members and the profession.
Publication of the project will promote the honour, integrity and
dignity of the the engineering profession.
Members shall offer services, or advise on or undertake
engineering assignments, only in areas of their competence
and shall practise in a careful and diligent manner.
The author’s field of expertise and current vocational specialisation is
in the area of road pavement design and construction and
maintenance. Careful consideration and diligence will be forthright
members with greater competence will be sought in situations when
specialised skills or knowledge are required.
Members shall act with fairness, honesty and in good faith
towards all in the community, including clients, employers
and colleagues.
The author will ensure all actions and results throughout the project
are fair and honest.
Members shall apply their skills and knowledge in the interest
of their employer or client for whom they shall act as faithful
agents or advisers, without compromising the welfare, health
and safety of the community.
Development and delivery of the project is sponsored by Main Roads.
Main Roads is a public-sector organisation and as such, essentially is
owned by the ‘taxpayer’. Standards of accountability will ensure any
work done will benefit the community. Training in "Equal
Opportunity", "Workplace health and Safety" and "Code of Conduct",
all provide guidance to ensure this tenet is met.
Members shall take all reasonable steps to inform themselves,
their clients and employers and the community of the social
and environmental consequences of the actions and projects
in which they are involved.
Risk assessments have been carried out where necessary and no social
consequences were identified. Environmental consequences are
minimal as the majority of the project involves research and analysis of
provided to both employer and community.
Members shall express opinions, make statements or give
evidence with fairness and honesty and on the basis of
adequate knowledge.
The author’s field of expertise and current vocational specialisation is
in the area of road pavement design and construction and
maintenance. Careful consideration and diligence will be forthright
throughout the delivery of the project. Professional advice from
members with greater competence will be sought in situations when
specialised skills or knowledge are required. Supervision of the project
by University of Southern Queensland Staff, with relevant expertise,
will ensure fairness and honesty of the opinions, evidence and
statements contained within the project.
Members shall continue to develop relevant knowledge, skill
and expertise throughout their careers and shall actively assist
and encourage those under their direction to do likewise.
Fulfilling the requirements of the project will develop relevant
knowledge, skill and expertise in the author’s field of engineering.
Publication of the Project Document will assist and encourage others to
do likewise.
Members shall not assist, induce or be involved in a breach of
these Tenets and shall support those who seek to uphold
them.
All measures will be taken by the author to not assist or be involved
with any breach. Support will be readily given to any individual
This was downloaded from the following website:
http://www.ieaust.org.au/directory/res/downloads/Code_of_Ethics_2000.
Appendix A5
Risk Assessment
An important part of the project is to manage the risks encountered during and
after completion of the project. Determining, assessing and controlling risks are
the basis for risk management.
The Project has the major tasks:
1.
Office Work Research
2.
Office Work Reporting
3.
Field Work - Inspections
4.
Field Work - Reading TDR Data.
5.
Field Work - Trenching Operations
Appendix A6
The majority of the Project will require minimal resources such as internet,
computer and printing access. Although the Project dictates that some external
resources will be required to perform the tasks of TDR Data collection and
trenching. Staff from both the Soil Lab in Toowoomba and the Herston materials
lab will be required for work tasks. The timing of external resource dependant
tasks can be managed to negate any impact on the delivery time of the project.
Appendix A7
Appendix B
Table AB1: Gravimetric Moisture Content for Site A, Chainage 56090m.
A3 A6 A9 A4 A7 A10 A5 A8 A11
1.1 1.1 1.1 2.5 2.5 2.5 SG SG SG
4.00 4.20 3.80 4.40 4.20 4.80 10.20 9.20 11.20
17/06/03 1 4.00 4.20 3.80 4.40 4.20 4.80 10.20 9.20 11.20
18/06/03 2 4.00 4.20 3.80 4.40 4.20 4.80 10.20 9.20 11.20
24/06/03 8 4.21 4.45 4.29 4.56 4.32 4.92 10.23 9.21 11.37
04/07/03 18 4.25 4.53 4.26 4.56 4.25 4.89 10.12 9.09 11.32
11/07/03 25 4.24 4.55 5.03 4.61 4.35 6.20 10.43 9.27 12.06
18/07/03 32 4.31 4.50 5.45 4.73 4.42 5.69 10.60 9.34 12.01
25/07/03 39 4.38 4.09 5.25 4.64 3.91 5.45 10.28 9.15 11.74
01/08/03 46 4.13 4.30 4.99 4.53 4.23 5.44 10.17 9.07 11.65
08/08/03 53 4.41 3.77 5.29 4.74 3.91 5.40 10.37 9.09 11.84
18/08/03 63 4.04 4.16 5.46 4.56 4.06 5.40 10.16 8.41 11.14
26/08/03 71 4.12 4.14 5.34 4.58 4.02 5.43 10.19 8.30 10.77
05/09/03 81 4.25 4.10 5.34 4.68 4.06 5.52 10.17 8.58 11.02
16/09/03 92 4.25 3.05 4.88 4.85 3.23 5.46 10.09 8.40 11.20
06/10/03 112 4.37 3.71 5.96 4.85 3.60 5.82 10.21 8.78 11.58
13/10/03 119 4.37 2.96 6.22 4.91 3.07 5.93 10.91 8.46 12.19
30/10/03 136 4.42 3.20 6.35 4.97 3.24 6.03 11.09 8.54 12.43
10/11/03 147 4.48 3.34 6.47 4.95 3.30 5.92 11.24 8.41 12.08
01/12/03 168 4.60 2.49 6.67 5.18 2.97 6.12 11.58 8.64 12.33
17/12/03 184 4.34 4.39 6.41 5.01 4.02 6.00 11.62 8.80 12.14
30/01/04 228 4.69 3.97 7.13 5.36 3.13 6.55 12.40 9.10 12.67
12/03/04 270 4.54 3.46 6.94 5.40 3.39 6.26 12.90 9.19 12.46
06/04/04 295 4.43 3.56 6.56 5.17 3.39 5.96 11.98 9.36 12.27
07/05/04 326 4.29 3.53 6.21 5.02 3.34 5.88 11.00 10.33 11.63
20/07/04 400 4.16 4.47 5.39 5.08 4.23 5.40 10.43 10.60 10.93
22/10/04 494 4.39 4.61 6.07 5.14 4.25 5.60 11.33 12.02 11.52
16/11/04 519 4.79 3.70 6.79 5.73 3.25 6.03 11.52 11.76 12.19
08/04/05 662 5.27 3.66 6.78 5.70 3.32 5.82 11.76 13.57 12.02
19/10/05 856 5.89 3.97 7.62 5.84 3.50 5.09 12.73 11.57
11/01/06 940 6.47 5.83 9.19 6.00 4.74 5.48 13.46 12.56
10/07/06 1120 6.41 4.12 8.39 5.94 3.56 5.45 11.08
02/12/06 1265 7.95 5.12 6.71 4.45 5.40 12.21
26/07/07 1501 6.27 7.52 4.47 12.33
B2 B3 B6 B9 B12 B4 B7 B10 B1 B5 B8 B11 B13
1.1 1.1 1.1 1.1 1.1 2.5 2.5 2.5 SG SG SG SG SG
4.40 4.00 3.80 3.80 4.00 4.40 4.20 4.20 7.20 9.40 8.00 10.00 11.60
23/04/03 1 4.40 4.00 3.80 3.80 4.00 4.40 4.20 4.20 7.20 9.40 8.00 10.00 11.60
01/05/03 9 4.40 4.00 3.80 3.80 4.00 4.40 4.20 4.20 7.20 9.40 8.00 10.00 11.60
19/05/03 27 4.85 4.19 3.41 3.80 3.83 4.13 4.01 3.97 8.64 9.88 8.09 10.09 11.38
03/06/03 42 4.41 3.72 3.13 3.40 3.25 3.86 4.06 3.95 7.90 9.46 8.26 10.24 11.47
18/06/03 57 4.16 3.32 2.72 3.14 2.73 3.51 3.90 3.67 8.15 9.20 8.01 9.96 10.96
04/07/03 73 4.18 3.18 2.74 3.01 2.82 3.51 3.97 3.63 7.73 8.91 8.08 9.92 11.09
11/07/03 80 4.24 3.47 2.87 3.26 2.84 3.58 4.10 3.78 8.06 9.20 8.16 9.92 10.95
18/07/03 87 4.24 3.42 3.03 3.30 2.90 3.61 4.08 3.75 8.06 9.01 8.22 10.16 11.13
25/07/03 94 4.03 3.19 2.58 2.93 2.55 3.44 3.95 3.57 7.84 8.96 8.13 9.99 11.19
01/08/03 101 3.96 3.06 2.62 2.98 2.47 3.45 3.91 3.64 7.48 8.55 8.11 8.97 10.80
08/08/03 108 4.03 3.26 2.95 3.02 2.63 3.48 3.99 3.70 7.63 8.74 8.08 9.19 11.02
18/08/03 118 4.11 3.30 2.43 2.89 2.78 3.39 3.96 3.61 7.74 8.72 8.14 9.14 11.13
26/08/03 126 4.04 3.16 2.52 2.71 2.61 3.36 3.96 3.08 7.74 8.63 8.12 8.92 10.70
05/09/03 136 4.14 3.23 2.53 2.53 2.81 3.37 4.04 3.00 8.16 8.78 8.25 8.93 11.20
16/09/03 147 4.16 3.17 2.62 3.03 2.77 3.43 4.00 3.72 7.98 8.80 8.18 9.00 11.32
06/10/03 167 4.03 3.20 2.96 3.34 2.79 3.50 3.94 3.58 8.25 9.23 8.59 9.24 12.08
13/10/03 174 4.56 3.47 2.98 3.12 2.80 3.54 4.05 3.46 8.60 8.66 9.18 9.36 11.87
30/10/03 191 4.64 3.29 2.43 3.32 3.85 3.61 4.12 3.68 8.66 9.26 8.63 9.59 11.73
10/11/03 202 4.75 3.38 2.53 3.27 3.57 3.66 4.13 3.72 8.50 9.21 8.74 9.50 11.35
01/12/03 223 4.24 3.38 3.57 3.10 3.22 3.57 4.22 3.90 9.00 9.74 9.95 9.39 12.59
17/12/03 239 4.79 2.72 3.32 3.59 3.97 3.63 4.05 3.74 8.92 9.23 9.94 9.60 12.52
30/01/04 283 4.68 3.71 3.01 3.86 3.73 3.60 4.29 3.81 9.35 9.83 9.68 9.62 13.29
12/03/04 325 5.57 3.07 2.79 3.22 3.83 3.75 4.24 3.33 9.56 9.75 10.01 9.89 13.68
06/04/04 350 4.84 3.42 2.44 2.98 3.37 3.52 3.99 3.82 8.72 9.09 9.92 9.23 13.21
07/05/04 381 5.39 2.84 2.37 2.85 3.33 3.47 4.07 3.71 9.29 8.42 8.68 9.46 12.63
20/07/04 455 4.81 2.62 2.39 2.79 2.32 3.28 3.90 3.61 7.40 8.21 9.30 11.83
22/10/04 549 4.59 3.67 2.78 3.21 2.38 3.42 4.00 3.77 8.25 10.43 11.62 9.79 14.01
16/11/04 574 5.81 3.87 3.21 3.67 3.47 3.53 4.22 3.47 8.92 9.67
08/04/05 717 3.00 2.95 3.54 3.93 2.13 3.40 4.08 3.75 5.96 9.26 9.98
06/10/05 898 3.95 4.15 4.30 2.25 3.34 4.26 3.49 8.63 9.16 9.15
11/01/06 995 4.79 4.09 4.82 3.53 2.11 4.20 3.62 9.60
10/07/06 1175 3.45 2.72 4.33 1.59 2.55 3.92 3.42 8.26 9.55 7.73
02/12/06 1320 3.80 5.20 5.67 2.14 2.08 4.19 7.41 7.35
Table AB3: Gravimetric Moisture Content for Site C, Chainage 58320m.
C2 C3 C6 C9 C12 C4 C7 C10 C1 C5 C8 C11 C13
1.1 1.1 1.1 1.1 1.1 2.5 2.5 2.5 SG SG SG SG SG
3.60 4.00 3.40 3.60 3.20 4.20 3.60 3.20 6.40 9.00 8.60 10.60 7.40
24/04/03 1 3.60 4.00 3.40 3.60 3.20 4.20 3.60 3.20 6.40 9.00 8.60 10.60 7.40
01/05/03 8 3.60 4.00 3.40 3.60 3.20 4.20 3.60 3.20 6.40 9.00 8.60 10.60 7.40
19/05/03 26 4.39 3.97 3.46 4.38 3.87 3.86 3.31 3.08 5.52 8.18 7.92 10.52 7.40
03/06/03 41 4.00 3.55 3.22 3.82 3.41 3.64 3.18 2.92 5.35 8.17 7.65 10.47 7.74
18/06/03 56 3.86 3.42 2.29 3.57 3.07 3.63 3.05 2.76 5.33 7.93 7.17 10.10 7.29
04/07/03 72 3.82 3.42 2.43 3.65 3.03 3.53 3.05 2.71 5.18 7.85 6.83 9.95 7.21
11/07/03 79 3.98 3.41 2.18 3.84 3.12 3.53 2.98 2.82 5.43 7.88 6.76 9.98 7.65
18/07/03 86 3.86 3.46 2.44 3.83 3.11 3.58 3.06 2.66 5.51 7.78 6.81 10.16 7.55
25/07/03 93 3.73 3.30 2.96 3.58 2.84 3.36 2.92 2.63 5.34 7.81 7.03 9.96 7.39
01/08/03 100 3.79 3.13 2.85 3.60 2.86 3.46 2.98 2.65 5.19 7.64 6.95 9.98 7.20
08/08/03 107 3.86 3.34 2.99 3.74 2.96 3.47 3.02 2.72 5.49 7.84 7.16 9.98 7.65
18/08/03 117 3.63 3.37 2.97 3.82 2.99 3.47 3.08 2.68 5.08 7.64 7.18 10.04 7.82
26/08/03 125 3.64 3.28 2.89 3.58 2.76 3.41 2.94 2.64 5.25 7.72 7.03 9.91 7.54
05/09/03 135 3.67 3.39 3.04 3.91 2.91 3.43 3.10 2.74 5.31 7.77 7.01 10.22 7.64
16/09/03 146 3.57 3.35 2.91 3.69 3.02 3.43 3.02 2.81 5.15 7.92 7.22 10.38 8.68
06/10/03 166 3.63 3.41 2.78 3.84 3.00 3.55 3.05 2.80 5.34 8.00 7.16 10.78 9.01
13/10/03 173 3.62 3.40 2.23 3.87 2.95 3.44 3.00 2.70 5.42 7.88 7.18 10.63 8.84
30/10/03 190 3.80 3.57 2.89 4.09 2.98 3.56 3.10 2.78 5.98 8.28 7.37 11.05 10.43
10/11/03 201 3.79 3.53 2.61 4.55 3.16 3.62 3.11 2.84 6.12 8.40 7.44 10.78 10.47
01/12/03 222 3.73 3.67 2.35 4.48 3.25 3.75 3.14 2.96 6.12 8.64 7.59 11.01 10.17
17/12/03 238 3.65 3.55 2.84 5.18 2.98 3.53 3.05 2.76 6.41 8.54 7.52 11.19 9.50
30/01/04 282 3.84 3.83 2.51 4.92 3.34 3.64 3.29 2.94 7.89 8.74 7.90 11.74 9.75
12/03/04 324 3.96 3.76 2.47 5.55 3.27 3.64 3.34 2.72 8.29 8.59 7.98 11.42 9.06
07/05/04 380 3.33 3.36 2.19 4.77 2.92 3.41 2.96 2.45 6.40 7.81 7.21 10.65 9.12
20/07/04 454 3.64 3.27 4.43 2.98 3.38 2.88 2.51 6.49 7.51 6.85 10.56 9.34
22/10/04 548 3.59 3.48 2.11 4.85 3.07 3.52 3.03 2.50 6.56 7.99 7.24 11.40 8.79
16/11/04 573 4.43 3.66 2.78 5.78 3.75 3.66 3.10 2.76 9.49 8.18 8.03 12.05 10.74
08/04/05 716 3.98 3.48 2.93 5.92 3.46 3.61 3.25 2.75 5.16 8.39 8.06 7.08
19/10/05 910 5.10 3.53 2.82 5.97 4.18 3.21 3.19 2.68 9.01 8.60 7.79 8.70
11/01/06 994 5.13 3.68 2.81 5.14 2.79 3.37 2.82 8.57 9.64 8.31 8.79
10/07/06 1174 3.91 3.61 2.51 3.80 3.02 3.14 2.60 5.20 8.53 7.06 5.94
02/12/06 1319 3.93 4.09 2.51 3.96 3.02 3.18 2.67 5.71 8.97 7.11 6.81
D2 D3 D6 D9 D12 D4 D7 D10 D1 D5 D8 D11 D13 1.1 1.1 1.1 1.1 1.1 2.5 2.5 2.5 SG SG SG SG SG
4.80 4.40 4.80 4.20 3.80 6.60 6.60 6.20 10.20 7.60 8.00 8.20 9.20
15/08/03 1 4.80 4.40 4.80 4.20 3.80 6.60 6.60 6.20 10.20 7.60 8.00 8.20 9.20
18/08/03 4 4.80 4.40 4.80 4.20 3.80 6.60 6.60 6.20 10.20 7.60 8.00 8.20 9.20
26/08/03 12 4.39 5.22 4.82 4.63 3.68 6.89 6.59 6.21 10.17 7.65 8.05 8.20 9.16
05/09/03 22 4.53 4.90 4.84 4.43 3.74 7.05 6.74 6.29 10.32 7.70 8.01 8.23 9.36
16/09/03 33 4.52 4.69 4.70 4.44 3.84 8.18 6.76 6.57 10.41 7.77 8.08 8.24 9.28
06/10/03 53 5.62 4.40 4.58 4.41 3.86 8.18 7.03 6.68 12.74 7.85 7.97 8.68 9.73
13/10/03 60 5.10 4.47 3.97 4.07 8.09 7.01 6.69 13.78 7.98 8.35 8.65 9.65
30/10/03 77 5.88 4.55 4.38 4.06 7.97 6.98 6.63 13.79 7.77 8.50 8.63 9.31
10/11/03 88 5.18 4.72 4.53 4.19 7.18 7.08 7.09 13.40 7.97 7.93 8.79 9.58
01/12/03 109 5.37 4.78 4.70 4.34 7.15 7.25 7.27 13.92 7.90 8.54 8.94 10.13
17/12/03 125 6.16 4.63 4.30 4.27 7.85 7.06 7.07 14.27 8.03 8.73 8.80 9.98
30/01/04 169 6.37 4.80 4.52 4.38 8.25 7.49 7.55 14.34 9.10 9.05 8.99 10.22
12/03/04 211 5.57 4.69 4.62 4.37 8.43 7.30 7.49 13.35 9.81 8.88 9.12 10.10
06/04/04 236 4.95 3.76 3.95 3.62 8.78 7.30 8.13 12.76 9.86 8.03 8.77 9.48
07/05/04 267 5.51 4.45 4.22 3.91 8.80 6.17 7.03 12.33 9.76 8.56 8.88 9.40
22/10/04 435 6.20 4.56 4.71 4.41 8.66 6.58 7.37 13.27 10.30 9.00 9.32 9.84
16/11/04 460 5.75 4.88 4.60 4.22 9.12 6.99 8.15 12.98 10.62 9.13 9.85 9.76
08/04/05 603 4.87 4.90 4.14 3.99 9.04 7.30 8.26 12.10 10.27 8.69 10.11 9.38
06/10/05 784 5.50 5.37 3.77 8.68 7.96 8.25 13.57 10.27 9.58 9.50
11/01/06 881 6.16 5.84 4.25 10.64 8.40 14.08 11.11 11.72 10.26
10/07/06 1061 4.67 5.15 3.57 9.52 6.65 11.01 9.94 10.14 8.82
02/12/06 1206 4.51 5.86 3.75 9.98 7.63 11.68 10.35 11.10 10.06
Table AB5: Gravimetric Moisture Content for Site E, Chainage 66268m.
E2 E3 E6 E9 E12 E4 E7 E10 E5 E8 E11 E13
1.1 1.1 1.1 1.1 1.1 2.5 2.5 2.5 SG SG SG SG
5.20 4.60 4.80 4.20 5.40 6.00 5.60 6.20 10.40 10.60 10.00 12.20
25/08/03 1 5.20 4.60 4.80 4.20 5.40 6.00 5.60 6.20 10.40 10.60 10.00 12.20
26/08/03 4 5.20 4.60 4.80 4.20 5.40 6.00 5.60 6.20 10.40 10.60 10.00 12.20
05/09/03 12 5.01 4.48 4.27 4.17 5.12 6.31 5.81 6.69 10.47 10.80 10.00 12.32
16/09/03 22 4.59 4.30 4.00 4.05 4.84 6.36 5.76 6.70 10.84 10.91 10.82 12.91
06/10/03 33 5.40 4.24 4.34 5.16 6.43 6.89 6.83 11.21 11.81 10.92 13.82
13/10/03 53 5.27 4.22 4.41 5.17 6.57 7.67 6.68 11.29 11.76 15.07
30/10/03 60 6.40 4.41 4.62 5.30 6.76 7.85 7.11 11.52 12.24 13.64
10/11/03 77 6.17 4.39 4.44 5.25 6.55 7.50 7.09 12.68 12.35 13.87
01/12/03 88 6.03 4.57 4.59 5.28 7.18 7.88 7.28 14.90 12.79 13.25
17/12/03 109 6.00 4.37 4.26 5.40 7.67 6.60 7.18 14.70 12.46 13.11
30/01/04 125 6.11 4.84 4.67 5.46 8.61 7.09 7.69 16.07 13.11 14.57
12/03/04 169 6.56 4.41 4.81 5.60 7.87 6.72 7.68 15.19 12.96 13.17
06/04/04 211 6.15 4.37 4.54 5.44 8.40 7.09 7.51 15.26 12.63 13.43
07/05/04 236 6.02 4.07 4.54 4.91 8.03 7.19 14.32 11.61 13.12
20/07/04 267 5.55 4.00 4.29 5.03 7.54 6.69 13.34 11.04 12.44
22/10/04 435 6.13 4.34 4.95 5.43 8.10 7.37 14.39 12.19 12.50
16/11/04 460 6.33 4.42 5.44 5.03 8.81 8.20 15.05 12.62 13.30
08/04/05 603 5.56 4.64 5.51 4.68 8.94 8.02 14.84 13.95 13.12
06/10/05 784 6.23 5.05 5.64 5.25 9.83 7.69 14.44 14.99 13.46
11/01/06 881 6.30 5.32 6.25 5.55 8.32 13.42
10/07/06 1061 5.90 5.03 5.36 4.97 6.99 13.15
02/12/06 1206 6.14 5.03 5.40 5.15 7.34 13.69
26/07/07 1432 5.71 5.46 6.07 5.46 6.95 11.19
F1 F3 F6 F9 F12 F2 F4 F7 F10 F5 F8 F11 F13
1.1 1.1 1.1 1.1 1.1 2.5 2.5 2.5 2.5 SG SG SG SG
4.40 4.00 3.20 3.60 4.20 4.00 4.40 4.20 4.60 8.80 8.40 10.40 11.20
19/06/03 1 4.40 4.00 3.20 3.60 4.20 4.00 4.40 4.20 4.60 8.80 8.40 10.40 11.20
20/06/03 2 4.40 4.00 3.20 3.60 4.20 4.00 4.40 4.20 4.60 8.80 8.40 10.40 11.20
24/06/03 6 5.01 4.06 3.82 4.31 4.64 4.27 4.70 3.53 4.77 8.56 7.56 10.46 11.08
04/07/03 16 5.16 4.97 4.54 4.78 4.78 4.38 4.75 3.88 4.90 8.72 7.92 10.61 11.19
11/07/03 23 5.22 4.91 4.42 4.58 4.79 4.31 4.74 4.69 4.96 8.93 8.40 11.50 11.11
18/07/03 30 5.50 4.86 3.55 4.79 4.90 4.58 4.82 3.82 5.07 9.24 7.18 11.03 11.46
25/07/03 37 5.22 4.52 4.11 4.57 4.72 4.47 4.70 4.56 4.97 9.37 8.56 11.35 11.04
01/08/03 44 5.00 4.33 3.90 4.36 4.50 4.46 4.63 4.46 4.87 9.12 8.55 10.93 10.89
08/08/03 51 5.18 4.50 4.14 4.57 4.76 4.38 4.69 4.61 5.08 9.28 8.39 11.53 10.92
18/08/03 61 5.11 4.41 3.86 4.31 4.60 4.49 4.73 4.51 4.88 9.50 8.86 11.20 10.56
26/08/03 69 5.10 4.11 3.85 4.10 4.48 4.43 4.67 4.37 4.84 9.14 8.76 10.83 10.54
05/09/03 79 5.20 4.16 3.88 4.25 4.49 4.32 4.78 4.33 4.85 8.80 8.53 11.42 10.59
16/09/03 90 4.98 4.17 3.86 4.25 4.55 4.39 4.66 3.63 4.88 8.69 8.76 11.34 11.83
06/10/03 110 5.36 4.20 3.81 4.35 4.67 4.70 4.75 3.45 5.09 9.49 9.00 11.43 11.92
13/10/03 117 5.74 4.05 3.80 4.29 4.61 4.93 4.50 3.60 4.92 9.42 8.65 11.46 11.57
30/10/03 134 6.02 4.09 3.83 4.55 5.05 5.31 4.58 3.15 5.21 9.57 8.77 12.38 12.32
10/11/03 145 5.93 4.41 3.57 4.60 5.14 4.87 4.67 3.49 5.23 9.78 8.79 12.31 12.30
01/12/03 166 5.62 4.62 3.57 4.66 5.30 4.88 4.62 3.49 5.46 10.01 9.26 13.29 12.77
17/12/03 182 6.17 4.64 3.73 4.53 5.03 5.51 4.84 3.28 5.34 10.49 13.15 12.54
30/01/04 226 6.54 4.94 3.92 4.67 5.68 5.38 4.83 3.80 5.73 10.95 14.69 13.04
12/03/04 268 6.21 4.66 4.19 4.97 4.61 4.77 4.63 4.94 5.50 10.17 12.51 13.06
06/04/04 293 6.40 4.59 4.17 4.96 5.35 5.29 4.86 3.95 5.45 10.10 12.33 13.03
07/05/04 324 6.22 4.36 3.95 4.93 5.17 5.35 4.72 4.44 5.08 11.78 11.26 12.43
20/07/04 398 5.47 4.21 3.72 5.06 5.02 4.65 4.68 4.34 4.55 9.14 10.20 11.71
22/10/04 492 5.73 4.60 4.15 5.97 5.42 5.07 4.90 3.96 5.48 10.04 11.44 12.84
16/11/04 517 6.51 5.29 4.14 7.28 6.27 5.57 5.07 3.89 5.60 10.75 12.12 13.07
08/04/05 660 6.27 5.56 3.26 7.12 6.57 4.85 5.06 3.87 5.55 9.72 9.01 13.45
06/10/05 841 6.19 5.56 7.23 7.82 4.88 5.19 3.31 5.24 8.44
11/01/06 938 8.44 7.38 6.26 6.36 5.52 4.44 6.17
10/07/06 1118 5.94 5.93 5.94 6.74 5.15 4.76 4.48 5.14 9.02
02/12/06 1263 7.81 7.80 6.64 8.62 5.97 5.58 4.96 6.08
Table AB7: Gravimetric Moisture Content for Site G, Chainage 74820m.
G2 G3 G6 G9 G12 G4 G7 G10 G1 G5 G8 G11 G13
1.1 1.1 1.1 1.1 1.1 2.5 2.5 2.5 SG SG SG SG SG
4.40 3.60 3.60 3.40 3.80 6.40 6.40 7.60 8.40 9.40 10.20 10.80 10.40
20/06/03 1 4.40 3.60 3.60 3.40 3.80 6.40 6.40 7.60 8.40 9.40 10.20 10.80 10.40
24/06/03 5 4.40 3.60 3.60 3.40 3.80 6.40 6.40 7.60 8.40 9.40 10.20 10.80 10.40
04/07/03 15 4.62 3.84 4.08 3.76 4.33 6.72 6.46 7.96 8.05 9.49 10.00 10.51 10.79
11/07/03 22 4.48 3.63 3.89 3.54 4.35 6.73 6.60 7.82 8.50 9.76 10.48 10.50 11.08
18/07/03 29 4.34 3.62 3.76 3.52 3.68 6.86 6.75 7.66 9.01 10.35 11.10 10.73 10.67
25/07/03 36 4.03 3.36 3.48 2.38 4.05 6.62 6.54 7.44 9.06 10.09 10.81 10.88 11.13
01/08/03 43 4.02 3.23 3.32 2.17 3.95 6.48 6.47 6.72 8.92 9.45 9.87 10.80 10.78
08/08/03 50 4.17 3.37 3.74 2.14 4.30 6.54 6.67 6.95 9.12 9.65 9.83 10.89 10.98
18/08/03 60 4.10 3.30 3.48 1.84 3.95 6.19 6.65 7.53 9.20 9.75 9.54 10.96 11.74
05/09/03 78 4.09 3.33 3.40 2.44 3.87 6.26 6.63 6.35 9.27 9.72 9.54 11.11 11.17
16/09/03 89 3.98 3.43 3.56 2.53 4.13 6.63 6.70 6.44 9.26 9.97 10.51 11.07 11.19
13/10/03 116 4.94 3.25 4.09 2.32 4.05 6.37 6.71 7.53 11.76 8.98 10.49 11.61 11.44
30/10/03 133 5.86 3.29 3.92 2.05 4.16 6.27 6.87 9.36 12.72 9.62 11.07 12.57 12.05
01/12/03 165 5.44 3.71 3.87 2.03 4.31 6.09 7.07 9.73 12.84 10.69 12.06 12.57 13.13
17/12/03 181 5.81 3.53 3.77 2.57 4.33 6.43 6.90 9.52 13.32 10.67 12.07 12.34 12.53
30/01/04 225 6.09 4.05 3.60 2.03 5.16 7.37 7.16 9.77 13.89 11.32 12.23 12.97 13.36
12/03/04 267 5.84 4.87 4.12 1.82 5.22 7.45 7.22 9.73 13.16 11.32 11.78 13.29
06/04/04 292 5.50 4.77 4.01 1.72 5.42 7.26 7.17 9.73 12.71 11.05 11.51 13.66
07/05/04 323 5.40 5.82 3.92 2.33 4.49 7.55 6.68 9.11 12.33 10.47 12.39
20/07/04 397 4.90 5.38 3.92 1.85 3.50 7.14 6.36 9.07 11.80 10.23 12.16
22/10/04 491 5.90 6.05 3.95 2.15 4.38 7.20 6.86 9.09 12.31 10.55 11.72
16/11/04 516 6.44 6.35 4.20 2.88 4.64 7.21 7.00 9.50 12.98 10.65 12.81
08/04/05 659 4.80 6.70 4.15 2.92 4.95 7.94 6.56 9.19 12.80 10.48 11.59
19/10/05 853 5.60 6.94 5.54 2.29 8.59 7.83 6.86 8.97 13.65 10.93 10.50
10/07/06 1117 4.93 5.86 5.40 1.77 4.57 7.12 6.38 8.73 12.66 10.75 10.78
02/12/06 1262 4.97 5.31 1.78 4.76 7.49 6.38 9.11 12.96 10.82 11.40
A3 A6 A9 A4 A7 A10 A5 A8 A11
1.1 1.1 1.1 2.5 2.5 2.5 SG SG SG
4.00 4.20 3.80 4.40 4.20 4.80 10.20 9.20 11.20
17/06/03 1 0.00 0.00 0.00 0.00 0.00 0.00 0.00 0.00 0.00
18/06/03 2 0.00 0.00 0.00 0.00 0.00 0.00 0.00 0.00 0.00
24/06/03 8 0.21 0.25 0.49 0.16 0.12 0.12 0.03 0.01 0.17
04/07/03 18 0.25 0.33 0.46 0.16 0.05 0.09 -0.08 -0.11 0.12
11/07/03 25 0.24 0.35 1.23 0.21 0.15 1.40 0.23 0.07 0.86
18/07/03 32 0.31 0.30 1.65 0.33 0.22 0.89 0.40 0.14 0.81
25/07/03 39 0.38 -0.11 1.45 0.24 -0.29 0.65 0.08 -0.05 0.54
01/08/03 46 0.13 0.10 1.19 0.13 0.03 0.64 -0.03 -0.13 0.45
08/08/03 53 0.41 -0.43 1.49 0.34 -0.29 0.60 0.17 -0.11 0.64
18/08/03 63 0.04 -0.04 1.66 0.16 -0.14 0.60 -0.04 -0.79 -0.06
26/08/03 71 0.12 -0.06 1.54 0.18 -0.18 0.63 -0.01 -0.90 -0.43
05/09/03 81 0.25 -0.10 1.54 0.28 -0.14 0.72 -0.03 -0.62 -0.18
16/09/03 92 0.25 -1.15 1.08 0.45 -0.97 0.66 -0.11 -0.80 0.00
06/10/03 112 0.37 -0.49 2.16 0.45 -0.60 1.02 0.01 -0.42 0.38
13/10/03 119 0.37 -1.24 2.42 0.51 -1.13 1.13 0.71 -0.74 0.99
30/10/03 136 0.42 -1.00 2.55 0.57 -0.96 1.23 0.89 -0.66 1.23
10/11/03 147 0.48 -0.86 2.67 0.55 -0.90 1.12 1.04 -0.79 0.88
01/12/03 168 0.60 -1.71 2.87 0.78 -1.23 1.32 1.38 -0.56 1.13
17/12/03 184 0.34 0.19 2.61 0.61 -0.18 1.20 1.42 -0.40 0.94
30/01/04 228 0.69 -0.23 3.33 0.96 -1.07 1.75 2.20 -0.10 1.47
12/03/04 270 0.54 -0.74 3.14 1.00 -0.81 1.46 2.70 -0.01 1.26
06/04/04 295 0.43 -0.64 2.76 0.77 -0.81 1.16 1.78 0.16 1.07
07/05/04 326 0.29 -0.67 2.41 0.62 -0.86 1.08 0.80 1.13 0.43
20/07/04 400 0.16 0.27 1.59 0.68 0.03 0.60 0.23 1.40 -0.27
22/10/04 494 0.39 0.41 2.27 0.74 0.05 0.80 1.13 2.82 0.32
16/11/04 519 0.79 -0.50 2.99 1.33 -0.95 1.23 1.32 2.56 0.99
08/04/05 662 1.27 -0.54 2.98 1.30 -0.88 1.02 1.56 4.37 0.82
19/10/05 856 1.89 -0.23 3.82 1.44 -0.70 0.29 3.53 0.37
11/01/06 940 2.47 1.63 5.39 1.60 0.54 0.68 4.26 1.36
10/07/06 1120 2.41 -0.08 4.59 1.54 -0.64 0.65 -0.12
02/12/06 1265 3.95 0.92 2.31 0.25 0.60 1.01
26/07/07 1501 2.27 3.72 0.07 3.13
Table AB9: GMC Change for Site B, Chainage 56570m.
B2 B3 B6 B9 B12 B4 B7 B10 B1 B5 B8 B11 B13
1.1 1.1 1.1 1.1 1.1 2.5 2.5 2.5 SG SG SG SG SG
4.40 4.00 3.80 3.80 4.00 4.40 4.20 4.20 7.20 9.40 8.00 10.00 11.60
23/04/03 1 0.00 0.00 0.00 0.00 0.00 0.00 0.00 0.00 0.00 0.00 0.00 0.00 0.00
01/05/03 9 0.00 0.00 0.00 0.00 0.00 0.00 0.00 0.00 0.00 0.00 0.00 0.00 0.00
19/05/03 27 0.45 0.19 -0.39 0.00 -0.17 -0.27 -0.19 -0.23 1.44 0.48 0.09 0.09 -0.22
03/06/03 42 0.01 -0.28 -0.67 -0.40 -0.75 -0.54 -0.14 -0.25 0.70 0.06 0.26 0.24 -0.13
18/06/03 57 -0.24 -0.68 -1.08 -0.66 -1.27 -0.89 -0.30 -0.53 0.95 -0.20 0.01 -0.04 -0.64
04/07/03 73 -0.22 -0.82 -1.06 -0.79 -1.18 -0.89 -0.23 -0.57 0.53 -0.49 0.08 -0.08 -0.51
11/07/03 80 -0.16 -0.53 -0.93 -0.54 -1.16 -0.82 -0.10 -0.42 0.86 -0.20 0.16 -0.08 -0.65
18/07/03 87 -0.16 -0.58 -0.77 -0.50 -1.10 -0.79 -0.12 -0.45 0.86 -0.39 0.22 0.16 -0.47
25/07/03 94 -0.37 -0.81 -1.22 -0.87 -1.45 -0.96 -0.25 -0.63 0.64 -0.44 0.13 -0.01 -0.41
01/08/03 101 -0.44 -0.94 -1.18 -0.82 -1.53 -0.95 -0.29 -0.56 0.28 -0.85 0.11 -1.03 -0.80
08/08/03 108 -0.37 -0.74 -0.85 -0.78 -1.37 -0.92 -0.21 -0.50 0.43 -0.66 0.08 -0.81 -0.58
18/08/03 118 -0.29 -0.70 -1.37 -0.91 -1.22 -1.01 -0.24 -0.59 0.54 -0.68 0.14 -0.86 -0.47
26/08/03 126 -0.36 -0.84 -1.28 -1.09 -1.39 -1.04 -0.24 -1.12 0.54 -0.77 0.12 -1.08 -0.90
05/09/03 136 -0.26 -0.77 -1.27 -1.27 -1.19 -1.03 -0.16 -1.20 0.96 -0.62 0.25 -1.07 -0.40
16/09/03 147 -0.24 -0.83 -1.18 -0.77 -1.23 -0.97 -0.20 -0.48 0.78 -0.60 0.18 -1.00 -0.28
06/10/03 167 -0.37 -0.80 -0.84 -0.46 -1.21 -0.90 -0.26 -0.62 1.05 -0.17 0.59 -0.76 0.48
13/10/03 174 0.16 -0.53 -0.82 -0.68 -1.20 -0.86 -0.15 -0.74 1.40 -0.74 1.18 -0.64 0.27
30/10/03 191 0.24 -0.71 -1.37 -0.48 -0.15 -0.79 -0.08 -0.52 1.46 -0.14 0.63 -0.41 0.13
10/11/03 202 0.35 -0.62 -1.27 -0.53 -0.43 -0.74 -0.07 -0.48 1.30 -0.19 0.74 -0.50 -0.25
01/12/03 223 -0.16 -0.62 -0.23 -0.70 -0.78 -0.83 0.02 -0.30 1.80 0.34 1.95 -0.61 0.99
17/12/03 239 0.39 -1.28 -0.48 -0.21 -0.03 -0.77 -0.15 -0.46 1.72 -0.17 1.94 -0.40 0.92
30/01/04 283 0.28 -0.29 -0.79 0.06 -0.27 -0.80 0.09 -0.39 2.15 0.43 1.68 -0.38 1.69
12/03/04 325 1.17 -0.93 -1.01 -0.58 -0.17 -0.65 0.04 -0.87 2.36 0.35 2.01 -0.11 2.08
06/04/04 350 0.44 -0.58 -1.36 -0.82 -0.63 -0.88 -0.21 -0.38 1.52 -0.31 1.92 -0.77 1.61
07/05/04 381 0.99 -1.16 -1.43 -0.95 -0.67 -0.93 -0.13 -0.49 2.09 -0.98 0.68 -0.54 1.03
20/07/04 455 0.41 -1.38 -1.41 -1.01 -1.68 -1.12 -0.30 -0.59 0.20 -1.19 -0.70 0.23
22/10/04 549 0.19 -0.33 -1.02 -0.59 -1.62 -0.98 -0.20 -0.43 1.05 1.03 3.62 -0.21 2.41
16/11/04 574 1.41 -0.13 -0.59 -0.13 -0.53 -0.87 0.02 -0.73 1.72 0.27
08/04/05 717 -1.40 -1.05 -0.26 0.13 -1.87 -1.00 -0.12 -0.45 -1.24 -0.14 1.98
06/10/05 898 -0.45 0.35 0.50 -1.75 -1.06 0.06 -0.71 1.43 -0.24 1.15
11/01/06 995 0.39 0.29 1.02 -0.47 -2.29 0.00 -0.58 2.40
10/07/06 1175 -0.95 -1.08 0.53 -2.41 -1.85 -0.28 -0.78 1.06 0.15 -0.27
02/12/06 1320 -0.60 1.40 1.87 -1.86 -2.32 -0.01 0.21 -0.65
C2 C3 C6 C9 C12 C4 C7 C10 C1 C5 C8 C11 C13 1.1 1.1 1.1 1.1 1.1 2.5 2.5 2.5 SG SG SG SG SG
3.60 4.00 3.40 3.60 3.20 4.20 3.60 3.20 6.40 9.00 8.60 10.60 7.40
24/04/03 1 0.00 0.00 0.00 0.00 0.00 0.00 0.00 0.00 0.00 0.00 0.00 0.00 0.00
01/05/03 8 0.00 0.00 0.00 0.00 0.00 0.00 0.00 0.00 0.00 0.00 0.00 0.00 0.00
19/05/03 26 0.79 -0.03 0.06 0.78 0.67 -0.34 -0.29 -0.12 -0.88 -0.82 -0.68 -0.08 0.00
03/06/03 41 0.40 -0.45 -0.18 0.22 0.21 -0.56 -0.42 -0.28 -1.05 -0.83 -0.95 -0.13 0.34
18/06/03 56 0.26 -0.58 -1.11 -0.03 -0.13 -0.57 -0.55 -0.44 -1.07 -1.07 -1.43 -0.50 -0.11
04/07/03 72 0.22 -0.58 -0.97 0.05 -0.17 -0.67 -0.55 -0.49 -1.22 -1.15 -1.77 -0.65 -0.19
11/07/03 79 0.38 -0.59 -1.22 0.24 -0.08 -0.67 -0.62 -0.38 -0.97 -1.12 -1.84 -0.62 0.25
18/07/03 86 0.26 -0.54 -0.96 0.23 -0.09 -0.62 -0.54 -0.54 -0.89 -1.22 -1.79 -0.44 0.15
25/07/03 93 0.13 -0.70 -0.44 -0.02 -0.36 -0.84 -0.68 -0.57 -1.06 -1.19 -1.57 -0.64 -0.01
01/08/03 100 0.19 -0.87 -0.55 0.00 -0.34 -0.74 -0.62 -0.55 -1.21 -1.36 -1.65 -0.62 -0.20
08/08/03 107 0.26 -0.66 -0.41 0.14 -0.24 -0.73 -0.58 -0.48 -0.91 -1.16 -1.44 -0.62 0.25
18/08/03 117 0.03 -0.63 -0.43 0.22 -0.21 -0.73 -0.52 -0.52 -1.32 -1.36 -1.42 -0.56 0.42
26/08/03 125 0.04 -0.72 -0.51 -0.02 -0.44 -0.79 -0.66 -0.56 -1.15 -1.28 -1.57 -0.69 0.14
05/09/03 135 0.07 -0.61 -0.36 0.31 -0.29 -0.77 -0.50 -0.46 -1.09 -1.23 -1.59 -0.38 0.24
16/09/03 146 -0.03 -0.65 -0.49 0.09 -0.18 -0.77 -0.58 -0.39 -1.25 -1.08 -1.38 -0.22 1.28
06/10/03 166 0.03 -0.59 -0.62 0.24 -0.20 -0.65 -0.55 -0.40 -1.06 -1.00 -1.44 0.18 1.61
13/10/03 173 0.02 -0.60 -1.17 0.27 -0.25 -0.76 -0.60 -0.50 -0.98 -1.12 -1.42 0.03 1.44
30/10/03 190 0.20 -0.43 -0.51 0.49 -0.22 -0.64 -0.50 -0.42 -0.42 -0.72 -1.23 0.45 3.03
10/11/03 201 0.19 -0.47 -0.79 0.95 -0.04 -0.58 -0.49 -0.36 -0.28 -0.60 -1.16 0.18 3.07
01/12/03 222 0.13 -0.33 -1.05 0.88 0.05 -0.45 -0.46 -0.24 -0.28 -0.36 -1.01 0.41 2.77
17/12/03 238 0.05 -0.45 -0.56 1.58 -0.22 -0.67 -0.55 -0.44 0.01 -0.46 -1.08 0.59 2.10
30/01/04 282 0.24 -0.17 -0.89 1.32 0.14 -0.56 -0.31 -0.26 1.49 -0.26 -0.70 1.14 2.35
12/03/04 324 0.36 -0.24 -0.93 1.95 0.07 -0.56 -0.26 -0.48 1.89 -0.41 -0.62 0.82 1.66
07/05/04 380 -0.27 -0.64 -1.21 1.17 -0.28 -0.79 -0.64 -0.75 0.00 -1.19 -1.39 0.05 1.72
20/07/04 454 0.04 -0.73 0.83 -0.22 -0.82 -0.72 -0.69 0.09 -1.49 -1.75 -0.04 1.94
22/10/04 548 -0.01 -0.52 -1.29 1.25 -0.13 -0.68 -0.57 -0.70 0.16 -1.01 -1.36 0.80 1.39
16/11/04 573 0.83 -0.34 -0.62 2.18 0.55 -0.54 -0.50 -0.44 3.09 -0.82 -0.57 1.45 3.34
08/04/05 716 0.38 -0.52 -0.47 2.32 0.26 -0.59 -0.35 -0.45 -1.24 -0.61 -0.54 -0.32
19/10/05 910 1.50 -0.47 -0.58 2.37 0.98 -0.99 -0.41 -0.52 2.61 -0.40 -0.81 1.30
11/01/06 994 1.53 -0.32 -0.59 1.94 -1.41 -0.23 -0.38 2.17 0.64 -0.29 1.39
10/07/06 1174 0.31 -0.39 -0.89 0.60 -1.18 -0.46 -0.60 -1.20 -0.47 -1.54 -1.46
02/12/06 1319 0.33 0.09 -0.89 0.76 -1.18 -0.42 -0.53 -0.69 -0.03 -1.49 -0.59
Table AB11: GMC Change for Site D, Chainage 63430m.
D2 D3 D6 D9 D12 D4 D7 D10 D1 D5 D8 D11 D13
1.1 1.1 1.1 1.1 1.1 2.5 2.5 2.5 SG SG SG SG SG
4.80 4.40 4.80 4.20 3.80 6.60 6.60 6.20 10.20 7.60 8.00 8.20 9.20
15/08/03 1 0.00 0.00 0.00 0.00 0.00 0.00 0.00 0.00 0.00 0.00 0.00 0.00 0.00
18/08/03 4 0.00 0.00 0.00 0.00 0.00 0.00 0.00 0.00 0.00 0.00 0.00 0.00 0.00
26/08/03 12 -0.41 0.82 0.02 0.43 -0.12 0.29 -0.01 0.01 -0.03 0.05 0.05 0.00 -0.04
05/09/03 22 -0.27 0.50 0.04 0.23 -0.06 0.45 0.14 0.09 0.12 0.10 0.01 0.03 0.16
16/09/03 33 -0.28 0.29 -0.10 0.24 0.04 1.58 0.16 0.37 0.21 0.17 0.08 0.04 0.08
06/10/03 53 0.82 0.00 -0.22 0.21 0.06 1.58 0.43 0.48 2.54 0.25 -0.03 0.48 0.53
13/10/03 60 0.30 -0.33 -0.23 0.27 1.49 0.41 0.49 3.58 0.38 0.35 0.45 0.45
30/10/03 77 1.08 -0.25 0.18 0.26 1.37 0.38 0.43 3.59 0.17 0.50 0.43 0.11
10/11/03 88 0.38 -0.08 0.33 0.39 0.58 0.48 0.89 3.20 0.37 -0.07 0.59 0.38
01/12/03 109 0.57 -0.02 0.50 0.54 0.55 0.65 1.07 3.72 0.30 0.54 0.74 0.93
17/12/03 125 1.36 -0.17 0.10 0.47 1.25 0.46 0.87 4.07 0.43 0.73 0.60 0.78
30/01/04 169 1.57 0.00 0.32 0.58 1.65 0.89 1.35 4.14 1.50 1.05 0.79 1.02
12/03/04 211 0.77 -0.11 0.42 0.57 1.83 0.70 1.29 3.15 2.21 0.88 0.92 0.90
06/04/04 236 0.15 -1.04 -0.25 -0.18 2.18 0.70 1.93 2.56 2.26 0.03 0.57 0.28
07/05/04 267 0.71 -0.35 0.02 0.11 2.20 -0.43 0.83 2.13 2.16 0.56 0.68 0.20
22/10/04 435 1.40 -0.24 0.51 0.61 2.06 -0.02 1.17 3.07 2.70 1.00 1.12 0.64
16/11/04 460 0.95 0.08 0.40 0.42 2.52 0.39 1.95 2.78 3.02 1.13 1.65 0.56
08/04/05 603 0.07 0.10 -0.06 0.19 2.44 0.70 2.06 1.90 2.67 0.69 1.91 0.18
06/10/05 784 0.70 0.57 -0.03 2.08 1.36 2.05 3.37 2.67 1.58 0.30
11/01/06 881 1.36 1.04 0.45 4.04 2.20 3.88 3.51 3.72 1.06
10/07/06 1061 -0.13 0.35 -0.23 2.92 0.45 0.81 2.34 2.14 -0.38
02/12/06 1206 -0.29 1.06 -0.05 3.38 1.43 1.48 2.75 3.10 0.86
E2 E3 E6 E9 E12 E4 E7 E10 E5 E8 E11 E13
1.1 1.1 1.1 1.1 1.1 2.5 2.5 2.5 SG SG SG SG
5.20 4.60 4.80 4.20 5.40 6.00 5.60 6.20 10.40 10.60 10.00 12.20
25/08/03 1 0.00 0.00 0.00 0.00 0.00 0.00 0.00 0.00 0.00 0.00 0.00 0.00
26/08/03 4 0.00 0.00 0.00 0.00 0.00 0.00 0.00 0.00 0.00 0.00 0.00 0.00
05/09/03 12 -0.19 -0.12 -0.53 -0.03 -0.28 0.31 0.21 0.49 0.07 0.20 0.00 0.12
16/09/03 22 -0.61 -0.30 -0.80 -0.15 -0.56 0.36 0.16 0.50 0.44 0.31 0.82 0.71
06/10/03 33 0.20 -0.56 0.14 -0.24 0.43 1.29 0.63 0.81 1.21 0.92 1.62
13/10/03 53 0.07 -0.58 0.21 -0.23 0.57 2.07 0.48 0.89 1.16 2.87
30/10/03 60 1.20 -0.39 0.42 -0.10 0.76 2.25 0.91 1.12 1.64 1.44
10/11/03 77 0.97 -0.41 0.24 -0.15 0.55 1.90 0.89 2.28 1.75 1.67
01/12/03 88 0.83 -0.23 0.39 -0.12 1.18 2.28 1.08 4.50 2.19 1.05
17/12/03 109 0.80 -0.43 0.06 0.00 1.67 1.00 0.98 4.30 1.86 0.91
30/01/04 125 0.91 0.04 0.47 0.06 2.61 1.49 1.49 5.67 2.51 2.37
12/03/04 169 1.36 -0.39 0.61 0.20 1.87 1.12 1.48 4.79 2.36 0.97
06/04/04 211 0.95 -0.43 0.34 0.04 2.40 1.49 1.31 4.86 2.03 1.23
07/05/04 236 0.82 -0.73 0.34 -0.49 2.03 0.99 3.92 1.01 0.92
20/07/04 267 0.35 -0.80 0.09 -0.37 1.54 0.49 2.94 0.44 0.24
22/10/04 435 0.93 -0.46 0.75 0.03 2.10 1.17 3.99 1.59 0.30
16/11/04 460 1.13 -0.38 1.24 -0.37 2.81 2.00 4.65 2.02 1.10
08/04/05 603 0.36 -0.16 1.31 -0.72 2.94 1.82 4.44 3.35 0.92
06/10/05 784 1.03 0.25 1.44 -0.15 3.83 1.49 4.04 4.39 1.26
11/01/06 881 1.10 0.52 2.05 0.15 2.12 1.22
10/07/06 1061 0.70 0.23 1.16 -0.43 0.79 0.95
02/12/06 1206 0.94 0.23 1.20 -0.25 1.14 1.49
26/07/07 1432 0.51 0.66 1.87 0.06 0.75 -1.01
Table AB13: GMC Change for Site F, Chainage 72670m.
F1 F3 F6 F9 F12 F2 F4 F7 F10 F5 F8 F11 F13
1.1 1.1 1.1 1.1 1.1 2.5 2.5 2.5 2.5 SG SG SG SG
4.40 4.00 3.20 3.60 4.20 4.00 4.40 4.20 4.60 8.80 8.40 10.40 11.20
19/06/03 1 0.00 0.00 0.00 0.00 0.00 0.00 0.00 0.00 0.00 0.00 0.00 0.00 0.00
20/06/03 2 0.00 0.00 0.00 0.00 0.00 0.00 0.00 0.00 0.00 0.00 0.00 0.00 0.00
24/06/03 6 0.61 0.06 0.62 0.71 0.44 0.27 0.30 -0.67 0.17 -0.24 -0.84 0.06 -0.12
04/07/03 16 0.76 0.97 1.34 1.18 0.58 0.38 0.35 -0.32 0.30 -0.08 -0.48 0.21 -0.01
11/07/03 23 0.82 0.91 1.22 0.98 0.59 0.31 0.34 0.49 0.36 0.13 0.00 1.10 -0.09
18/07/03 30 1.10 0.86 0.35 1.19 0.70 0.58 0.42 -0.38 0.47 0.44 -1.22 0.63 0.26
25/07/03 37 0.82 0.52 0.91 0.97 0.52 0.47 0.30 0.36 0.37 0.57 0.16 0.95 -0.16
01/08/03 44 0.60 0.33 0.70 0.76 0.30 0.46 0.23 0.26 0.27 0.32 0.15 0.53 -0.31
08/08/03 51 0.78 0.50 0.94 0.97 0.56 0.38 0.29 0.41 0.48 0.48 -0.01 1.13 -0.28
18/08/03 61 0.71 0.41 0.66 0.71 0.40 0.49 0.33 0.31 0.28 0.70 0.46 0.80 -0.64
26/08/03 69 0.70 0.11 0.65 0.50 0.28 0.43 0.27 0.17 0.24 0.34 0.36 0.43 -0.66
05/09/03 79 0.80 0.16 0.68 0.65 0.29 0.32 0.38 0.13 0.25 0.00 0.13 1.02 -0.61
16/09/03 90 0.58 0.17 0.66 0.65 0.35 0.39 0.26 -0.57 0.28 -0.11 0.36 0.94 0.63
06/10/03 110 0.96 0.20 0.61 0.75 0.47 0.70 0.35 -0.75 0.49 0.69 0.60 1.03 0.72
13/10/03 117 1.34 0.05 0.60 0.69 0.41 0.93 0.10 -0.60 0.32 0.62 0.25 1.06 0.37
30/10/03 134 1.62 0.09 0.63 0.95 0.85 1.31 0.18 -1.05 0.61 0.77 0.37 1.98 1.12
10/11/03 145 1.53 0.41 0.37 1.00 0.94 0.87 0.27 -0.71 0.63 0.98 0.39 1.91 1.10
01/12/03 166 1.22 0.62 0.37 1.06 1.10 0.88 0.22 -0.71 0.86 1.21 0.86 2.89 1.57
17/12/03 182 1.77 0.64 0.53 0.93 0.83 1.51 0.44 -0.92 0.74 1.69 2.75 1.34
30/01/04 226 2.14 0.94 0.72 1.07 1.48 1.38 0.43 -0.40 1.13 2.15 4.29 1.84
12/03/04 268 1.81 0.66 0.99 1.37 0.41 0.77 0.23 0.74 0.90 1.37 2.11 1.86
06/04/04 293 2.00 0.59 0.97 1.36 1.15 1.29 0.46 -0.25 0.85 1.30 1.93 1.83
07/05/04 324 1.82 0.36 0.75 1.33 0.97 1.35 0.32 0.24 0.48 2.98 0.86 1.23
20/07/04 398 1.07 0.21 0.52 1.46 0.82 0.65 0.28 0.14 -0.05 0.34 -0.20 0.51
22/10/04 492 1.33 0.60 0.95 2.37 1.22 1.07 0.50 -0.24 0.88 1.24 1.04 1.64
16/11/04 517 2.11 1.29 0.94 3.68 2.07 1.57 0.67 -0.31 1.00 1.95 1.72 1.87
08/04/05 660 1.87 1.56 0.06 3.52 2.37 0.85 0.66 -0.33 0.95 0.92 -1.39 2.25
06/10/05 841 1.79 1.56 3.63 3.62 0.88 0.79 -0.89 0.64 -1.96
11/01/06 938 4.04 3.38 2.66 2.36 1.12 0.24 1.57
10/07/06 1118 1.54 1.93 2.34 2.54 1.15 0.36 0.28 0.54 0.22
02/12/06 1263 3.41 3.80 3.04 4.42 1.97 1.18 0.76 1.48
G2 G3 G6 G9 G12 G4 G7 G10 G1 G5 G8 G11 G13 1.1 1.1 1.1 1.1 1.1 2.5 2.5 2.5 SG SG SG SG SG
4.40 3.60 3.60 3.40 3.80 6.40 6.40 7.60 8.40 9.40 10.20 10.80 10.40
20/06/03 1 0.00 0.00 0.00 0.00 0.00 0.00 0.00 0.00 0.00 0.00 0.00 0.00 0.00
24/06/03 5 0.00 0.00 0.00 0.00 0.00 0.00 0.00 0.00 0.00 0.00 0.00 0.00 0.00
04/07/03 15 0.22 0.24 0.48 0.36 0.53 0.32 0.06 0.36 -0.35 0.09 -0.20 -0.29 0.39
11/07/03 22 0.08 0.03 0.29 0.14 0.55 0.33 0.20 0.22 0.10 0.36 0.28 -0.30 0.68
18/07/03 29 -0.06 0.02 0.16 0.12 -0.12 0.46 0.35 0.06 0.61 0.95 0.90 -0.07 0.27
25/07/03 36 -0.37 -0.24 -0.12 -1.02 0.25 0.22 0.14 -0.16 0.66 0.69 0.61 0.08 0.73
01/08/03 43 -0.38 -0.37 -0.28 -1.23 0.15 0.08 0.07 -0.88 0.52 0.05 -0.33 0.00 0.38
08/08/03 50 -0.23 -0.23 0.14 -1.26 0.50 0.14 0.27 -0.65 0.72 0.25 -0.37 0.09 0.58
18/08/03 60 -0.30 -0.30 -0.12 -1.56 0.15 -0.21 0.25 -0.07 0.80 0.35 -0.66 0.16 1.34
05/09/03 78 -0.31 -0.27 -0.20 -0.96 0.07 -0.14 0.23 -1.25 0.87 0.32 -0.66 0.31 0.77
16/09/03 89 -0.42 -0.17 -0.04 -0.87 0.33 0.23 0.30 -1.16 0.86 0.57 0.31 0.27 0.79
13/10/03 116 0.54 -0.35 0.49 -1.08 0.25 -0.03 0.31 -0.07 3.36 -0.42 0.29 0.81 1.04
30/10/03 133 1.46 -0.31 0.32 -1.35 0.36 -0.13 0.47 1.76 4.32 0.22 0.87 1.77 1.65
01/12/03 165 1.04 0.11 0.27 -1.37 0.51 -0.31 0.67 2.13 4.44 1.29 1.86 1.77 2.73
17/12/03 181 1.41 -0.07 0.17 -0.83 0.53 0.03 0.50 1.92 4.92 1.27 1.87 1.54 2.13
30/01/04 225 1.69 0.45 0.00 -1.37 1.36 0.97 0.76 2.17 5.49 1.92 2.03 2.17 2.96
12/03/04 267 1.44 1.27 0.52 -1.58 1.42 1.05 0.82 2.13 4.76 1.92 1.58 2.89
06/04/04 292 1.10 1.17 0.41 -1.68 1.62 0.86 0.77 2.13 4.31 1.65 1.31 3.26
07/05/04 323 1.00 2.22 0.32 -1.07 0.69 1.15 0.28 1.51 3.93 0.27 1.99
20/07/04 397 0.50 1.78 0.32 -1.55 -0.30 0.74 -0.04 1.47 3.40 0.03 1.76
22/10/04 491 1.50 2.45 0.35 -1.25 0.58 0.80 0.46 1.49 3.91 0.35 1.32
16/11/04 516 2.04 2.75 0.60 -0.52 0.84 0.81 0.60 1.90 4.58 0.45 2.41
08/04/05 659 0.40 3.10 0.55 -0.48 1.15 1.54 0.16 1.59 4.40 0.28 1.19
19/10/05 853 1.20 3.34 1.94 -1.11 4.79 1.43 0.46 1.37 5.25 0.73 0.10
10/07/06 1117 0.53 2.26 1.80 -1.63 0.77 0.72 -0.02 1.13 4.26 0.55 0.38
02/12/06 1262 0.57 1.71 -1.62 0.96 1.09 -0.02 1.51 4.56 0.62 1.00
Figure AB1
GMC vs Date for Site A Base Probes.
0.0
1.0
2.0
3.0
4.0
5.0
6.0
7.0
8.0
9.0
10.0
23/04/03 20/10/03 17/04/04 14/10/04 12/04/05 09/10/05 07/04/06 04/10/06 02/04/07 29/09/07
Date
G
ra
v
im
e
tr
ic
M
o
is
tu
re
C
o
n
te
n
t
(%
)
A3 A6 A9
Figure AB2
GMC vs Date for Site A Lower Subbase Probes.
0.0
1.0
2.0
3.0
4.0
5.0
6.0
7.0
8.0
23/04/03 20/10/03 17/04/04 14/10/04 12/04/05 09/10/05 07/04/06 04/10/06 02/04/07 29/09/07
Date
G
ra
v
im
e
tr
ic
M
o
is
tu
re
C
o
n
te
n
t
(%
)
Figure AB3
GMC vs Date for Site C Subgrade Probes.
0.0
2.0
4.0
6.0
8.0
10.0
12.0
14.0
23/04/03 20/10/03 17/04/04 14/10/04 12/04/05 09/10/05 07/04/06 04/10/06 02/04/07 29/09/07
Date
G
ra
v
im
e
tr
ic
M
o
is
tu
re
C
o
n
te
n
t
(%
Figure AB4
GMC vs Date for Site A Outer Lane Outer Wheel Path.
0.0
2.0
4.0
6.0
8.0
10.0
12.0
14.0
16.0
23/04/03 20/10/03 17/04/04 14/10/04 12/04/05 09/10/05 07/04/06 04/10/06 02/04/07 29/09/07
Date
G
ra
v
im
e
tr
ic
M
o
is
tu
re
C
o
n
te
n
t
(%
)
A3 A4 A5
Figure AB5
GMC vs Date for Site A Centreline.
0.0
2.0
4.0
6.0
8.0
10.0
12.0
14.0
16.0
23/04/03 20/10/03 17/04/04 14/10/04 12/04/05 09/10/05 07/04/06 04/10/06 02/04/07 29/09/07
Date
G
ra
v
im
e
tr
ic
M
o
is
tu
re
C
o
n
te
n
t
(%
)
Figure AB6
GMC vs Date for Site A Inner Lane Outer Wheel Path.
0.0
2.0
4.0
6.0
8.0
10.0
12.0
14.0
23/04/03 20/10/03 17/04/04 14/10/04 12/04/05 09/10/05 07/04/06 04/10/06 02/04/07 29/09/07
Date
G
ra
v
im
e
tr
ic
M
o
is
tu
re
C
o
n
te
n
t
(%
Figure AB7
GMC Change vs Date for Site A Base
-6.0
-4.0
-2.0
0.0
2.0
4.0
6.0
23/04/03 20/10/03 17/04/04 14/10/04 12/04/05 09/10/05 07/04/06 04/10/06 02/04/07 29/09/07
Date
G
ra
v
im
e
tr
ic
M
o
is
tu
re
C
o
n
te
n
t
C
h
a
n
g
e
(
%
)
A3 A6 A9
Figure AB8
GMC Change vs Date for Site A Lower Subbase
-5.0
-4.0
-3.0
-2.0
-1.0
0.0
1.0
2.0
3.0
4.0
5.0
23/04/03 20/10/03 17/04/04 14/10/04 12/04/05 09/10/05 07/04/06 04/10/06 02/04/07 29/09/07
Date
G
ra
v
im
e
tr
ic
M
o
is
tu
re
C
o
n
te
n
t
C
h
a
n
g
e
(
%
)
Figure AB9
GMC Change vs Date for Site A Subgrade
-5.0
-4.0
-3.0
-2.0
-1.0
0.0
1.0
2.0
3.0
4.0
23/04/03 20/10/03 17/04/04 14/10/04 12/04/05 09/10/05 07/04/06 04/10/06 02/04/07 29/09/07
Date
G
ra
v
im
e
tr
ic
M
o
is
tu
re
C
o
n
te
n
t
C
h
a
n
g
e
(
%
Figure AB10
GMC Change vs Date for Site A Outer Lane OWP
-5.0
-4.0
-3.0
-2.0
-1.0
0.0
1.0
2.0
3.0
4.0
5.0
23/04/03 20/10/03 17/04/04 14/10/04 12/04/05 09/10/05 07/04/06 04/10/06 02/04/07 29/09/07
Date
G
ra
v
im
e
tr
ic
M
o
is
tu
re
C
o
n
te
n
t
C
h
a
n
g
e
(
%
)
A3 A4 A5
Figure AB11
GMC Change vs Date for Site A Centreline.
-5.0
-4.0
-3.0
-2.0
-1.0
0.0
1.0
2.0
3.0
4.0
5.0
23/04/03 20/10/03 17/04/04 14/10/04 12/04/05 09/10/05 07/04/06 04/10/06 02/04/07 29/09/07
Date
G
ra
v
im
e
tr
ic
M
o
is
tu
re
C
o
n
te
n
t
C
h
a
n
g
e
(
%
)
Figure AB12
GMC vs Date for Site A Inner Lane OWP
-6.0
-4.0
-2.0
0.0
2.0
4.0
23/04/03 20/10/03 17/04/04 14/10/04 12/04/05 09/10/05 07/04/06 04/10/06 02/04/07 29/09/07
Date
G
ra
v
im
e
tr
ic
M
o
is
tu
re
C
o
n
te
n
t
C
h
a
n
g
e
(
%
Figure AB13
GMC vs Date for Site B Base Probes.
0.0
1.0
2.0
3.0
4.0
5.0
6.0
7.0
8.0
23/04/03 20/10/03 17/04/04 14/10/04 12/04/05 09/10/05 07/04/06 04/10/06 02/04/07 29/09/07
Date
G
ra
v
im
e
tr
ic
M
o
is
tu
re
C
o
n
te
n
t
(%
)
B2 B3 B6 B9 B12
Figure AB14
GMC vs Date for Site B Lower Subbase Probes.
0.0
1.0
2.0
3.0
4.0
5.0
6.0
7.0
8.0
23/04/03 20/10/03 17/04/04 14/10/04 12/04/05 09/10/05 07/04/06 04/10/06 02/04/07 29/09/07
Date
G
ra
v
im
e
tr
ic
M
o
is
tu
re
C
o
n
te
n
t
(%
)
Figure AB15
GMC vs Date for Site B Subgrade Probes.
0.0
2.0
4.0
6.0
8.0
10.0
12.0
14.0
23/04/03 20/10/03 17/04/04 14/10/04 12/04/05 09/10/05 07/04/06 04/10/06 02/04/07 29/09/07
Date
G
ra
v
im
e
tr
ic
M
o
is
tu
re
C
o
n
te
n
t
(%
)
Figure AB16
GMC vs Date for Site B Verge Probes.
0.0
2.0
4.0
6.0
8.0
10.0
12.0
14.0
16.0
23/04/03 20/10/03 17/04/04 14/10/04 12/04/05 09/10/05 07/04/06 04/10/06 02/04/07 29/09/07
Date
G
ra
v
im
e
tr
ic
M
o
is
tu
re
C
o
n
te
n
t
(%
)
Figure AB17
GMC vs Date for Site B Outer Lane Outer Wheel Path.
0.0
2.0
4.0
6.0
8.0
10.0
12.0
14.0
16.0
23/04/03 20/10/03 17/04/04 14/10/04 12/04/05 09/10/05 07/04/06 04/10/06 02/04/07 29/09/07
Date
G
ra
v
im
e
tr
ic
M
o
is
tu
re
C
o
n
te
n
t
(%
)
B3 B4 B5
Figure AB18
GMC vs Date for Site B Centreline.
0.0
2.0
4.0
6.0
8.0
10.0
12.0
14.0
16.0
23/04/03 20/10/03 17/04/04 14/10/04 12/04/05 09/10/05 07/04/06 04/10/06 02/04/07 29/09/07
Date
G
ra
v
im
e
tr
ic
M
o
is
tu
re
C
o
n
te
n
t
(%
)
Figure AB19
GMC vs Date for Site B Inner Lane Outer Wheel Path.
0.0
2.0
4.0
6.0
8.0
10.0
12.0
14.0
23/04/03 20/10/03 17/04/04 14/10/04 12/04/05 09/10/05 07/04/06 04/10/06 02/04/07 29/09/07
Date
G
ra
v
im
e
tr
ic
M
o
is
tu
re
C
o
n
te
n
t
(%
Figure AB20
GMC Change vs Date for Site B Base
-5.0
-4.0
-3.0
-2.0
-1.0
0.0
1.0
2.0
3.0
4.0
5.0
23/04/03 20/10/03 17/04/04 14/10/04 12/04/05 09/10/05 07/04/06 04/10/06 02/04/07 29/09/07
Date
G
ra
v
im
e
tr
ic
M
o
is
tu
re
C
o
n
te
n
t
C
h
a
n
g
e
(
%
)
B2 B3 B6 B9 B12
Figure AB21
GMC Change vs Date for Site B Lower Subbase
-5.0
-4.0
-3.0
-2.0
-1.0
0.0
1.0
2.0
3.0
4.0
5.0
23/04/03 20/10/03 17/04/04 14/10/04 12/04/05 09/10/05 07/04/06 04/10/06 02/04/07 29/09/07
Date
G
ra
v
im
e
tr
ic
M
o
is
tu
re
C
o
n
te
n
t
C
h
a
n
g
e
(
%
)
Figure AB22
GMC Change vs Date for Site B Subgrade
-5.0
-4.0
-3.0
-2.0
-1.0
0.0
1.0
2.0
3.0
4.0
23/04/03 20/10/03 17/04/04 14/10/04 12/04/05 09/10/05 07/04/06 04/10/06 02/04/07 29/09/07
Date
G
ra
v
im
e
tr
ic
M
o
is
tu
re
C
o
n
te
n
t
C
h
a
n
g
e
(
%
)
Figure AB23
GMC Change vs Date for Site B Verge
-5.0
-4.0
-3.0
-2.0
-1.0
0.0
1.0
2.0
3.0
4.0
5.0
23/04/03 20/10/03 17/04/04 14/10/04 12/04/05 09/10/05 07/04/06 04/10/06 02/04/07 29/09/07
Date
G
ra
v
im
e
tr
ic
M
o
is
tu
re
C
o
n
te
n
t
C
h
a
n
g
e
(
%
)
Figure AB24
GMC Change vs Date for Site B Outer Lane OWP
-5.0
-4.0
-3.0
-2.0
-1.0
0.0
1.0
2.0
3.0
4.0
5.0
23/04/03 20/10/03 17/04/04 14/10/04 12/04/05 09/10/05 07/04/06 04/10/06 02/04/07 29/09/07
Date
G
ra
v
im
e
tr
ic
M
o
is
tu
re
C
o
n
te
n
t
C
h
a
n
g
e
(
%
)
B3 B4 B5
Figure AB25
GMC Change vs Date for Site B Centreline.
-5.0
-4.0
-3.0
-2.0
-1.0
0.0
1.0
2.0
3.0
4.0
5.0
23/04/03 20/10/03 17/04/04 14/10/04 12/04/05 09/10/05 07/04/06 04/10/06 02/04/07 29/09/07
Date
G
ra
v
im
e
tr
ic
M
o
is
tu
re
C
o
n
te
n
t
C
h
a
n
g
e
(
%
)
Figure AB26
GMC vs Date for Site B Inner Lane OWP
-5.0
-4.0
-3.0
-2.0
-1.0
0.0
1.0
2.0
3.0
4.0
23/04/03 20/10/03 17/04/04 14/10/04 12/04/05 09/10/05 07/04/06 04/10/06 02/04/07 29/09/07
Date
G
ra
v
im
e
tr
ic
M
o
is
tu
re
C
o
n
te
n
t
C
h
a
n
g
e
(
%
Figure AB27
GMC vs Date for Site C Base Probes.
0.0
1.0
2.0
3.0
4.0
5.0
6.0
7.0
8.0
23/04/03 20/10/03 17/04/04 14/10/04 12/04/05 09/10/05 07/04/06 04/10/06 02/04/07 29/09/07
Date
G
ra
v
im
e
tr
ic
M
o
is
tu
re
C
o
n
te
n
t
(%
)
C2 C3 C6 C9 C12
Figure AB28
GMC vs Date for Site C Lower Subbase Probes.
0.0
1.0
2.0
3.0
4.0
5.0
6.0
7.0
8.0
23/04/03 20/10/03 17/04/04 14/10/04 12/04/05 09/10/05 07/04/06 04/10/06 02/04/07 29/09/07
Date
G
ra
v
im
e
tr
ic
M
o
is
tu
re
C
o