University of Southern Queensland
Faculty of Engineering and Surveying
A Study of Pavement Performance on
the Gatton Bypass Duplication
A Dissertation submitted by
David Victor O’May
in fulfilment of the requirements of
Courses ENG4111 and ENG4112 Research Project
towards the degree of
Bachelor of Engineering (Civil)
ABSTRACT
The Project aims to assess the viability of pavement cross sections used in the Southern
District of Main Roads Queensland by investigation and analysis of pavement
performance for cross section types used on the Gatton Bypass Duplication (GBD).
Pavement Cross Section for the GBD was based on a design adopted from the Victorian
Roads Authority, VicRoads. Two significant aspects of the GBD were innovative for
the Department of Main Roads; First use of VicRoads Cross Section and First use of
Time Domain Reflectometry (TDR) Technology to monitor moisture in the pavements.
Investigation into the Pavement Performance includes; reviewing TDR data from seven
installations, development of a Pavement Performance Profile from historical data and
Forensic Investigation into current failures, probable causes and contributory factors.
Compilation of the Pavement Performance Profile required analysis of yearly data
relating to structural, functional and other attributes. The functional attributes of
Rutting and Roughness were considered as they correlate well with road user
expectations. Structural performance assessments were based on Deflection Testing,
which indicated the pavements structural capacity to withstand current and future
loadings prior to failure. Traffic Loadings and Maintenance costs, both historical and
projected, were also integrated into the Profile.
Forensic Investigation into the current failures included conventional methods and the
modern technologies of Ground Penetrating Radar (GPR) and Closed Circuit Television
(CCTV). GPR was utilised to identify anomalies and moisture within and below the
pavement structure, while CCTV provided an opportunity to investigate sub-soil drains.
The Pavement Performance Profile and Forensic Investigation are reconciled to produce
an interrelationship between performance and failure. This interrelationship forms the
basis for Distress Threshold Limits and the calculation of the Estimated Remaining
Service Life of the pavement, which concludes the Project. The methodology
developed for this study is reviewed and considered for its application to other
University of Southern Queensland
Faculty of Engineering and Surveying
ENG4111 & ENG4112
Research Project
Limitations of Use
The Council of the University of Southern Queensland, its Faculty of Engineering and
Surveying, and the staff of the University of Southern Queensland, do not accept any
responsibility for the truth, accuracy or completeness of material contained within or
associated with this dissertation.
Persons using all or any part of this material do so at their own risk, and not at the risk
of the Council of the University of Southern Queensland, its Faculty of Engineering and
Surveying or the staff of the University of Southern Queensland.
This dissertation reports an educational exercise and has no purpose or validity beyond
this exercise. The sole purpose of the course pair entitled "Research Project" is to
contribute to the overall education within the student’s chosen degree program. This
document, the associated hardware, software, drawings, and other material set out in the
associated appendices should not be used for any other purpose: if they are so used, it is
entirely at the risk of the user.
Prof Frank Bullen
Dean
Certification
I certify that the ideas, designs and experimental work, results, analyses and conclusions
set out in this dissertation are entirely my own effort, except where otherwise indicated
and acknowledged.
I further certify that the work is original and has not been previously submitted for
assessment in any other course or institution, except where specifically stated.
David Victor O’May
Student Number: 0050042019
___________________________
Signature
_________________________
Acknowledgements
The author would like to thank: Associate Professor Ron Ayers for his valuable advice,
guidance and direction; my wife, Miriam; and my friends for their support and
understanding during the preparation of this project.
Many thanks to the Main Roads staff both at Toowoomba and the Geotechnical
Laboratory in Herston. The writer would also like to acknowledge Mr Vasantha
Wijilukasuriya for allowing the use of the Time Domain Reflectometry data.
TABLE OF CONTENTS
Abstract
i
Disclaimer
ii
Certification
iii
Acknowledgements
iv
Table of Contents
v
List of Figures
xiv
List of Tables
xviii
Glossary
xxi
1
Introduction ... 1
1.1
Aims and Objectives of the Project ... 3
1.2
Dissertation Overview ... 4
2
Background ... 7
2.1
Department of Main Roads Queensland... 7
2.2
Southern District of Main Roads... 8
2.3
Warrego Highway...10
2.4
Gatton Bypass...11
2.5
Gatton Bypass Duplication ...12
2.6
Project Construction History...14
2.7
Cross Section History ...16
2.8
Cross Section Design...19
2.9
Pavement Design ...24
2.9.3
Lower Subbase ...27
2.9.4
Controlled Subgrade...28
2.9.5
Verge ...28
2.10
Seal Design...29
2.11
Time Domain Reflectometry (TDR) Installations ...29
2.12
Site Geology...30
2.13
Maintenance Issues...30
3
Literature Review ...33
3.1
Road Pavements ...33
3.2
Pavement Performance ...34
3.2.1
Pavement Failure...35
3.2.2
Pavement Defects ...35
3.2.3
Laser Profilometry...36
3.2.4
Rutting ...38
3.2.5
Roughness ...39
3.2.6
Deflections ...40
3.3
Moisture in Pavements...46
3.4
Monitoring Moisture in Pavements ...49
3.4.1
Time Domain Reflectometry (TDR) ...49
3.4.2
Ground Penetrating Radar (GPR) ...57
3.5
Pavement Design Features and Pavement Performance ...60
3.5.1
Pavement Type...60
3.5.2
Sub-surface drains ...60
3.6
Characterisation of Climate ...62
3.6.1
Thornthwaite Moisture Index (TMI)...62
3.7
Deterioration of Pavements...64
3.7.1
Underlying Rate of Deterioration Estimation...64
3.7.2
Distress Threshold Values ...65
3.7.3
Remaining Service Life (RSL) ...66
4
Methodology...69
4.1
Collate information on GBD...70
4.2
Time Domain Reflectometry ...71
4.3
Pavement Performance Profile...72
4.4
Forensic Investigation into Failures ...74
4.5
Reconcile Major Components of Investigation ...78
4.6
Conclusions ...78
5
Insitu Moisture Monitoring using TDR...79
5.1
Site Selection...79
5.2
Site Descriptions...82
5.2.1
Site A ...82
5.2.2
Site B ...82
5.2.3
Site C ...82
5.2.4
Site D ...82
5.2.5
Site E...83
5.2.6
Site F...83
5.2.8
Subgrade Details ...84
5.3
Equipment ...85
5.4
Installation...86
5.4.1
Installation Procedures ...86
5.4.2
Calibration...87
5.5
Calculating GMC...88
5.6
Details of Instrumentation...90
5.6.1
Site A – Ch 25820 ...90
5.6.2
Site B – Ch 26300 ...91
5.6.3
Site C – Ch 28050 ...92
5.6.4
Site D – Ch 33160 ...93
5.6.5
Site E – Ch 35998...94
5.6.6
Site F – Ch 42400...95
5.6.7
Site G – Ch 44550 ...96
5.7
Results...97
5.8
Analysis of Results ...99
5.8.1
Site A – Ch 25820 ...99
5.8.2
Site B – Ch 26300 ...100
5.8.3
Site C – Ch 28050 ...101
5.8.4
Site D – Ch 33160 ...102
5.8.5
Site E – Ch 35998...102
5.8.6
Site F – Ch 42400...103
5.8.7
Site G – Ch 44550 ...104
5.10
Probe Performance ...109
5.11
Climate Analysis ...112
5.11.1
Climate Classification ...112
5.11.2
Climate Classification Results ...116
5.12
Discussion and Conclusion ...117
5.13
Integration with other Major Components ...123
6
Pavement Performance Profile ...124
6.1
Introduction ...124
6.2
Rutting...126
6.2.1
Decision Rules for Linear Rutting Progression Rate ...127
6.2.2
Results...129
6.2.3
Analysis of Results...129
6.2.4
Discussion ...135
6.3
Roughness ...137
6.3.1
Results...137
6.3.2
Analysis of Results...137
6.3.3
Discussion ...140
6.4
Deflections ...142
6.4.1
PAVDEF Survey ...143
6.4.2
FWD Survey ...145
6.4.3
Discussion ...147
6.5
Maintenance Costs...149
6.5.3
Projected Repair Costs ...151
6.5.4
Results...152
6.5.5
Discussion ...155
6.6
Traffic Loadings ...156
6.6.1
Discussion ...160
6.7
Conclusions ...161
6.8
Integration with other Major Components ...167
7
Forensic Investigation into Failures...169
7.1
Plan the Investigation ...171
7.1.1
General Review of Problem...171
7.1.2
Scope of Work ...172
7.2
Review Documents and Literature ...174
7.2.1
Plans...174
7.2.2
Pavement History ...175
7.2.3
Drainage Design...176
7.2.4
Pavement Materials Information...176
7.2.5
Construction Records ...177
7.2.6
Traffic Data...177
7.2.7
Soil or Geological Records ...177
7.2.8
Climate Data ...177
7.3
Interview Personnel ...178
7.4
Non-destructive Condition Survey...179
7.4.1
Field Inspections of Pavement Condition...180
7.4.1.2
Results...182
7.4.1.3
Analysis of Results ...182
7.4.1.4
Discussion ...184
7.4.2
Closed Circuit Television (CCTV) ...187
7.4.2.1
Methodology ...188
7.4.2.2
Results...191
7.4.2.3
Analysis of Results ...194
7.4.2.4
Discussion ...197
7.4.3
Ground Penetrating Radar ...198
7.4.3.1
Methodology ...199
7.4.3.2
Results...200
7.4.3.3
Analysis of Results ...200
7.4.3.4
Discussion ...203
7.4.4
Deflection Testing ...204
7.4.4.1
Methodology ...204
7.4.4.2
Results...204
7.4.4.3
Analysis of Results ...205
7.4.4.4
Discussion ...207
7.5
Destructive Materials Sampling and Testing...208
7.5.1
Methodology ...209
7.5.2
Moisture Content Results ...213
7.5.2.1
Moisture Ratio...214
7.5.2.2
Degree of Saturation...215
7.5.4
Gradings...222
7.5.5
Subgrade CBR...222
7.5.6
Discussion ...223
7.6
Probable Cause(s) of Failure...225
7.6.1
Investigative Synthesis ...225
7.6.2
Types of Failures...226
7.6.3
Failure Hypothesis...227
7.6.4
Summary of Results ...228
7.6.5
Probable Causes of Failures...229
7.6.5.1
General Rutting and Shoving...230
7.6.5.2
Rutting and Shoving in Cuts ...231
7.6.5.3
Cracking in Asphalt Surfacing ...232
7.6.5.4
Failures over Culvert ...232
7.6.5.5
Failures adjoining Bridges ...233
7.7
Conclusions ...234
7.8
Integration with other Major Components ...235
8
Conclusion...237
8.1
Summary of Method ...238
8.2
Project Conclusions ...241
8.3
Further Work. ...244
APPENDICES
Appendix A1
Project Specification
Appendix A2
Project Aims and Objectives
Appendix A3
Project Methodology
Appendix A4
Assessment of Consequential Effects
Appendix A5
Risk Assessment
Appendix A6
Resource Analysis
Appendix A7
Project Timeline
Appendix B
Insitu Moisture Monitoring using Time Domain
Reflectometry (TDR)
Appendix C
Rutting Data
Appendix D
Roughness Data
Appendix E
Deflections Data
Appendix F
Field Inspections
Appendix G
Trench Results
Appendix H
Maintenance Data
Appendix I
Closed Circuit Television (CCTV) Survey
Results
Appendix J
Ground Penetrating Radar (GPR) Results
Appendix K
Supplementary Specification MRSS.01.010
LIST OF FIGURES
Figure 2.1 Main Roads Districts Map ... 7
Figure 2.2 Southern District Map... 9
Figure 2.3 South East Queensland Map... 11
Figure 2.4 Gatton Bypass Duplication Map ... 12
Figure 2.5 Construction packages for the GBD Project... 15
Figure 2.6 Early 1970’s VicRoads Pavement Design for Rural Freeways ... 18
Figure 2.7 Revised VicRoads Pavement Design for Rural Freeways post early 1970’s ... 19
Figure 2.8 Construction of Verge prior to pavement ... 20
Figure 2.9 Typical GBD pavement section... 21
Figure 2.10 Example of Installation of subsoil drains. ... 22
Figure 2.11 Operation of Paver on GBD ... 23
Figure 2.12 Typical Fill Type Cross Section ... 23
Figure 2.13 Typical Cut Type Cross Section... 24
Figure 2.14 Pavement Design for GBD ... 25
Figure 2.15 Isolated Failure on the Project in July 2004 ... 31
Figure 2.16 Asphalt Failure west of Sandy Creek Bridge in July 2004... 31
Figure 2.17 Failure at Chainage 63.175km... 32
Figure 2.18 Failure at Chainage 66.981km... 32
Figure 3.1 Main Roads Network Survey Vehicle (NSV) ... 37
Figure 3.2 Schematic of Multi Layer Profilometer (MLP) used by Main Roads... 37
Figure 3.3 Example of a FWD Unit with Load applied by pad on left and gauges measuring the pavements response on the right. ... 41
Figure 3.4 A typical pavement Deflection Bowl subjected to a Point Load ... 42
Figure 3.5 Drainage systems with Subsoil Drains at the sides ... 48
Figure 3.7 Typical TDR curve for soil and measurement of apparent length la... 54
Figure 3.8 Illustration of Trace Interpretation Methods... 55
Figure 3.9 Dimensionless electric field distribution for three wire TDR probes ... 56
Figure 3.10 Phases of Pavement Performance ... 64
Figure 3.11 Design Life Relationship to Distress ... 67
Figure 3.12 Service Life Relationship to Threshold Distress... 68
Figure 4.1 Methodology for Determining the Pavement Performance Profile ... 73
Figure 5.1 Instrumentation at Site A ... 90
Figure 5.2 Instrumentation at Site B ... 91
Figure 5.3 Instrumentation at Site C ... 92
Figure 5.4 Instrumentation at Site D ... 93
Figure 5.5 Instrumentation at Site E... 94
Figure 5.6 Instrumentation at Site F... 95
Figure 5.7 Instrumentation at Site G ... 96
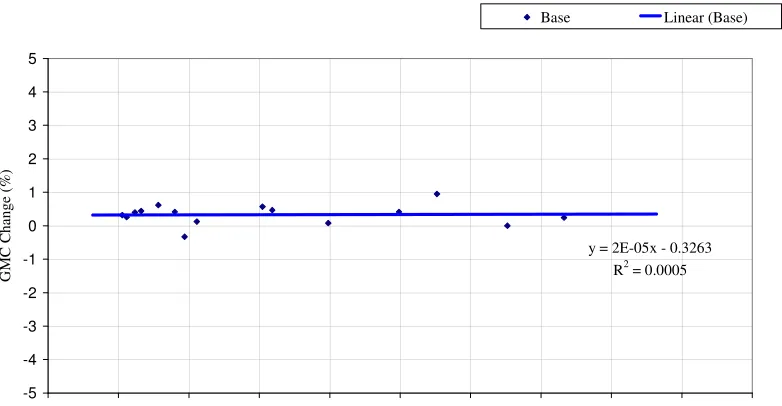
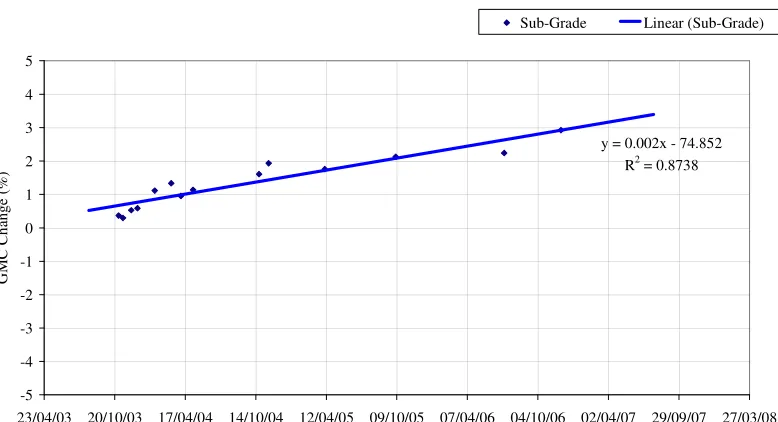
Figure 5.8 Base Course GMC Change versus Date for site D... 107
Figure 5.9 Lower Subbase GMC Change versus Date for site D... 107
Figure 5.10 Subgrade GMC Change versus Date for site D... 108
Figure 5.11 Probe Failures per Layers ... 110
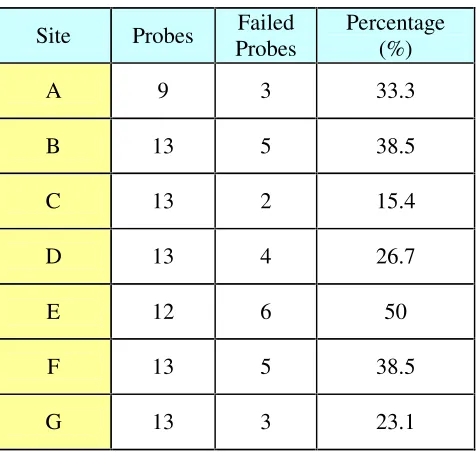
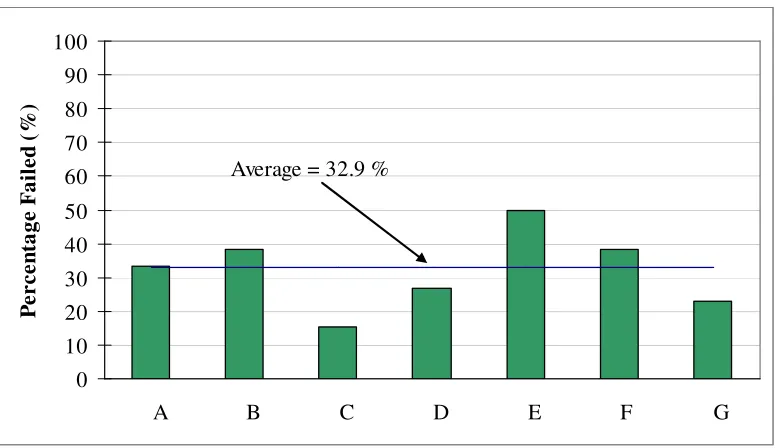
Figure 5.12 Probe Failures per Site ... 111
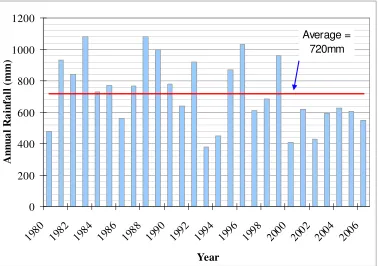
Figure 5.13 Yearly Rainfall at Gatton UQ BOM Site (1980 And 2006) ... 112
Figure 5.14 TMI at Gatton UQ BOM Site (1980-2006) (Ia = 0.6) ... 115
Figure 5.15 TMI at Gatton UQ BOM Site (1980-2006) (Simplified & Ia = 1.0) ... 115
Figure 6.1 Methodology for Determining the Pavement Performance Profile .... 125
Figure 6.2 Rutting versus Date for GBD 2004-2007. ... 130
Figure 6.3 No of Sections versus LRPR Range based of 100m sections. ... 131
Figure 6.6 IRI versus Date on GBD ... 139
Figure 6.7 Linear Roughness Progression Rate versus Chainage on GBD ... 140
Figure 6.8 Example of Asphalt Fatigue Cracking on GBD ... 150
Figure 6.9 Example of OWP Failure on GBD... 150
Figure 6.10 Financial Expenditure on GBD Sealed Surface in 2006/07 versus Chainage... 152
Figure 6.11 Projected Financial Expenditure on GBD Sealed Surface in 2007/08 versus Chainage. ... 153
Figure 6.12 Financial Expenditure on GBD Sealed Surfaces versus Financial Year. ... 154
Figure 7.1 Failure of the Pavement of the GBD. Plastic Deformation of the Pavement. (Rut progressed to Shove). ... 172
Figure 7.2 Failure of the Pavement of the GBD. Plastic Deformation of the Pavement. (Rut progressed to Shove). ... 173
Figure 7.3 Percentage OWP Failed vs Cut Number for GBD... 184
Figure 7.4 Flush Point with cover on. ... 189
Figure 7.5 Head of CCTV Probe, includes camera and LED light source. ... 189
Figure 7.6 Equipment Setup with camera inserted into drain. ... 190
Figure 7.7 Condensation at Site 1 distance 15m ... 194
Figure 7.8 Free Water at Location 5 Distance 8.0m ... 195
Figure 7.9 Silt at 4.0 m from inspection point Location 1... 196
Figure 7.10 Antenna Setup for the GPR Survey of GBD. ... 199
Figure 7.11 GPR Results for OWP, OL, GBD Chainage 67.2-67.5km... 201
Figure 7.12 Cut 11, OWP, OL, 68.0 to 68.14km, GBD with Repair Showing on Right ... 201
Figure 7.13 Fill, OWP, OL, 67.7 to 67.8km, GBD. ... 202
Figure 7.14 Cut 10, OWP, OL, 67.1 to 67.25km, GBD... 202
Figure 7.15 Lower Subbase CBR versus Chainage for GBD... 206
Figure 7.16 Subbase 2 CBR versus Chainage for GBD... 206
Figure 7.18 Starting Trenching at Location 4... 210
Figure 7.19 Profile of the Trench at Location 3. ... 211
Figure 7.20 Trench at Location 4. ... 211
Figure 7.21 Locating Culvert at Location 5... 212
Figure 7.22 Liquid Limit versus Trench Number for Base Course on GBD... 220
Figure 7.23 Plasticity Index verus Trench Number for Base Course on GBD. ... 221
LIST OF TABLES
Table 2.1: Main Roads Districts ... 8
Table 2.2: Important state-controlled roads within Southern District... 10
Table 2.3: Summary of Gatton Bypass Duplication Project Costs ... 16
Table 2.4: Road Configuration ... 17
Table 2.5: Specification for Type G1.1 & G1.2 Material used on GBD... 26
Table 2.6: Physical Properties of Type 2.5 Lower Subbase ... 27
Table 2.7: Controlled Subgrade Specification ... 28
Table 2.8: Verge Material Specification ... 28
Table 2.9: Gatton Bypass Seal Design ... 29
Table 3.1: Important parameters in Deflection Testing ... 42
Table 3.2: Terminology used in Deflection Testing... 43
Table 3.3: Pavement Rehabilitation Manual: Interpretation of Deflection Ratio... 44
Table 3.4: Interpretation of deflection ratio for PAVDEF (Deflectograph) ... 44
Table 3.5: Correlation between D900 value for Benkelman Beam and Subgrade CBR ... 45
Table 3.6: Dielectric Constant (Ka) for typical construction materials ... 51
Table 3.7: Thornthwaite Moisture Index Climate Classifications... 63
Table 5.1: Site Locations and Details of Probe Sites ... 80
Table 5.2: Installation dates and Details of Probe Sites... 81
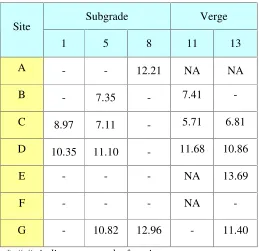
Table 5.3: Subgrade Properties at the Instrumented Sites ... 84
Table 5.4: GMC Results on 02/12/06 (%) ... 97
Table 5.5: GMC Results on 02/12/06 (%) ... 98
Table 5.6: GMC Progression Rates for Layer at site D ... 106
Table 5.8: Probe Failures for Layers ... 109
Table 5.9: Probe Failures for Sites ... 110
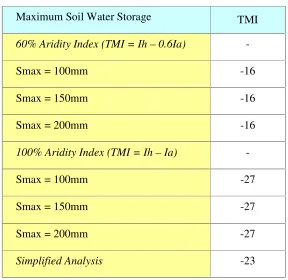
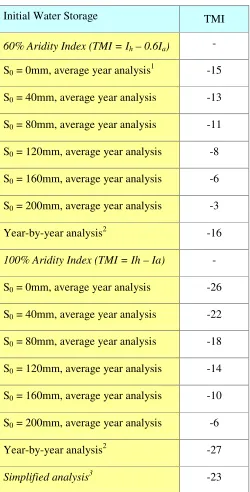
Table 5.10: TMI (1980-2006) for Year-By-Year Analysis... 113
Table 5.11: TMI (1980-2006) for Calculation Method (Smax = 200mm)... 114
Table 6.1: Limits for Validation of Rutting Data ... 127
Table 6.2: Average Rutting On Warrego Highway 2004-2007... 132
Table 6.3: Number of Sections forEstimated Remaining Service Life (ERSL) based on Rutting Distress Thresholds... 134
Table 6.4: Terminal Depth of Rut required for Rehabilitation... 135
Table 6.5: Roughness Results for the GBD (55.01-75.74km)... 138
Table 6.6: Pavement Deterioration Classification... 139
Table 6.7: Deflection Ratios for PAVDEF along the Warrego Highway: Ipswich – Toowoomba (18A) (QMR 2004a)... 143
Table 6.8: Summary of PAVDEF deflection testing data: GBD (Nov 2003) ... 144
Table 6.9: Interpretation of deflection ratio for PAVDEF (Deflectograph) ... 145
Table 6.10: Backcalculated Estimated Layer Moduli results ... 146
Table 6.11: Failure Classification System ... 151
Table 6.12: Traffic Count Information for the Warrego Highway at the GBD since completion of GBD. ... 157
Table 6.13: Growth Rates for Years 2004-2006 on GBD... 158
Table 6.14: Design Traffic Calculator using 2006 Data for GBD. ... 158
Table 6.15: Summary of Traffic Calculator using 2006 Data for GBD with ESA Growth Factor (2%)... 159
Table 6.16: Estimated Remaining Service Life for GBD based on LRPR rates. ... 166
Table 6.17: Estimated Remaining Design Life for GBD based on 2006 counts... 166
Table 7.1: Data collected from Field Inspections... 181
Table 7.2: Failure Classification System ... 181
Table 7.3: Failures for Packages Chainages ... 183
Table 7.5: GBD OWP Failure Summary ... 186
Table 7.6: Summary of Survey Details ... 191
Table 7.7: Survey Results for Location Five (5) at Chainage 67.341km... 192
Table 7.8: Survey Results for Drain Number Six (6) at Chainage 67.280km ... 193
Table 7.9: Location of Test Trenches on GBD... 209
Table 7.10: Moisture Content (GMC %) Results for Trenches 1-3 ... 213
Table 7.11: Moisture Content (GMC %) Results for Trenches 4-5 ... 214
Table 7.12: Degree of Saturation... 216
Table 7.13: Liquid Limit Results for Trenches 1-5 (LL %)... 217
Table 7.14: Plasticity Index Results for Trenches 1-5 (PI %) ... 218
Table 7.15: Linear Shrinkage Results for Trenches 1-5 (LS %) ... 219
Table 7.16: Weighted Plastic Property Results for Base 1 Course, Trenches 1-5. ... 222
Table 7.17: Subgrade CBR values for Trench 4, from DCP. ... 223
Table 7.18: Possible failure causes for rutting, with associated information. ... 229
GLOSSARY
AADT Average Annual Daily Traffic, the typical number of vehicles using a section of road each day
ARRB Australian Road Research Board
ARMIS A Road Management Information System, used by the Queensland Department of Main Roads for the collection and storage of linear and
spatial road-related data.
Austroads Australian Road Research Board
CBR California Bearing Ratio
CF Curvature Function, CF = D0 – D200
Ch. Chainage, length along a road measured from a specific start point
CL Centreline
CV Coefficient of variation, CV = SD / X x 100
DCP Dynamic Cone Penetrometer
DOS Degree of Saturation
D0 Rebound Deflection, D0 = Maximum Deflection – Residual Deflection
DX Deflection measured X mm away from the loading point
Dr Representative Deflection, which for a homogenous section
corresponds to the 90% highest Rebound Deflection (D0)
DR Deflection Ratio, DR = D250 / D0 (may be a percentage)
EB Eastbound
ERDL The Estimated Remaining Design Life of a pavement
ERSL The Estimated Remaining Service Life of a pavement
ESA Equivalent Standard Axles
FWD Falling Weight Deflectometer
GMC Gravimetric Moisture Content
GNP Gross National Product
GPR Ground Penetrating Radar
HV Heavy Vehicles
IL Inner Lane
IWP Inner Wheelpath
LL Liquid Limit
LS Linear Shrinkage
MDD Maximum Dry Density
MRS Designation of Queensland Main Roads Standard Specifications
NAASRA National Australian Association of State Road Authorities, now known as Austroads
OECD Organisation for Economic Cooperation and Development
OMC Optimum Moisture Content
OL Outer lane
OWP Outer Wheelpath
PAVDEF A variation of the deflectograph deflection testing machine, used in Queensland
PI Plasticity Index, PI = LL – PL
PL Plastic Limit
PMB Polymer Modified Binder
RLT Repeat Load Triaxial
SD Standard deviation of deflection parameter for a homogenous section
SRA State Road Authority
WB Westbound
1
Introduction
Road pavements are critically important to both the Australian Economy and
lifestyle of its people. Australia has the highest proportion of road freight per
capita, or per unit of Gross Domestic Product (GDP) of any Organisation for
Economic Co-operation and Development (OECD) country, as stated by the
Austroads Pavement Strategy 2001-2004 (Austroads 2002). Road freight in
Australia has tripled since 1979, and is predicted to at least double in the next
fifteen years.
Road pavement performance and quality significantly affects:
• Safety and comfort of road users
• Effective management of the road freight task
• Load-carrying capacity and service life of the road
• Vehicular fatigue, especially for heavy vehicles
• Amenity of surrounding environment
Road pavements in Australia and New Zealand are valued at around $50 billion,
or approximately one third of total road infrastructure value. Construction and
maintenance works on pavements in Australia and New Zealand cost in the order
of $3 billion per year, or approximately half of the total annual road expenditure
(Austroads 2002).
Road pavement deterioration imposes significant financial burdens on State Road
Authorities (SRAs) in Australia. Expected rates of deterioration and Design Life
realisation are anticipated within the budgets of SRA’s. Premature deterioration
of pavements requires either additional or reallocated funding to carry out either
Reeves (2001) provided information about the magnitude of pavement failure on
roads managed by the Queensland Department of Main Roads, including the
following facts:
• The cost of pavement failures to the Queensland Department of Main Roads
is approximately $10 million per year, at a conservative estimate.
• Of roughly $3 billion in funding spent on pavements in the previous 10
years, about $30 million (10%) has not given optimum value since remedial
treatment was necessary to allow pavement to reach its intended design life.
• About $10 million is spent on unplanned costs each year due to design
investigation inadequacies, which result in costly construction changes and
claims.
Greater understanding of pavement failures, being gained through detailed
investigations, is invaluable in reducing the costs associated with pavement
failures into the future.
The negative consequences of premature failure of pavements are not only
financial. SRA’s are concerned with the negative public image consequences
from high profile premature pavement failures. Public perception of poor
management of funds, evidenced by poor performance of road construction
projects, can also lead to negative political consequences.
Premature failure minimisation requires Best Practice application to: planning,
design, construction, maintenance, rehabilitation and operation of road pavements.
Best Practice is required to be in agreement with data available through thorough
investigation into performance of pavements, most importantly, poorly performing
pavements.
Investigation into pavement performance for a SRA requires the development of a
methodology to assess pavements in the road network. Recently completed
construction projects provide the greatest opportunity to access information
relevant to the assessment of performance. Therefore, methodology development
1.1
Aims and Objectives of the Project
The project seeks to develop and apply a methodology for the investigation of
Pavement Performance on the Gatton Bypass Duplication (GBD). Results from
the investigation will be juxtaposed with innovations adopted in the design of the
GBD to determine any causal relationships between design and performance. The
viability of the cross section types used in the Southern District of Main Roads
Queensland will be assessed by reviewing the outcomes. The Methodology for
the investigation of Pavement Performance will be developed with scope for
further application in the Queensland Department of Main Roads.
The detailed investigation of the Pavement Performance of the Gatton Bypass
Duplication consists of an amalgamation of concepts, technologies, techniques
and methodologies adopted from a number of sources. The methodology
developed in this project differs significantly from the majority of work carried
out into Pavement Performance, which tended to focus on either one technology
or attribute of the pavement. With a broad focus on collating, analysing and
reviewing information from many sources and technologies, this methodology
attempts to gain increased understanding of the performance of the pavement.
Increased understanding of pavement performance and subsequent increased
ability in determining pavement success or failure will maximise learnings from
the investigation.
The methodology outline is;
• Compilation and Review of all available information on the Project relating
to the Pavement.
• Development of a Pavement Performance Profile from historical data
• Forensic Investigation into pavement failures.
Listed are some of the Technologies and Methods used for the investigation;
• Time Domain Reflectometry (TDR)
• Closed Circuit Television (CCTV)
• Ground Penetrating Radar (GPR)
• Falling Weight Deflectometer (FWD)
• Linear Rutting Progression Rate (LRPR) (Austroads 2007)
• Forensic Investigation into pavement failures (Smith 2004)
1.2
Dissertation Overview
Research was firstly carried out into moisture in pavements, pavement type cross
sections and also methodologies and technologies used in the determination of
pavement performance. An examination of the history of the GBD, including the
history of the pavement design and construction records, was also completed.
The methodology for the investigation was developed and the three major
components adopted for the study of Pavement Performance on the GBD are:
1. In-Situ Moisture Content Monitoring using Time Domain Reflectometry
A number of innovations adopted in the design of the Cross Sections for the GBD
were intended to reduce moisture in the pavement. Time Domain Reflectometry
(TDR) technology was installed prior to completion of the project to monitor
moisture within the pavement structure. Data from this technology was reviewed
2. Pavement Performance Profile
A Pavement Performance Profile for the GBD was developed by assessing both
structural and functional attributes of the pavement. Attributes included in the
Pavement Performance Profile are:
• Rutting
• Roughness
• Deflections
• Maintenance Costs
• Traffic Loadings
Historical data since completion provided the opportunity to calculate trends for
each of the attributes except Deflections. Deflection data for the entire project
was only available for one point during the life of the pavement, in
November/December 2003, just after completion. Deflection data will again be
collected at the end of 2007. Rutting and Roughness data was validated to
determine linear progression rates based on regression modelling. Progression
rates were compared to current classification systems and also used to determine
the Estimated Remaining Service Life (ERSL) of the pavement.
3. Forensic Investigation into Pavement Failures
Failures have started to form in the GBD pavement, with the first developing less
than three years after practical completion of the project. The investigation of
these failures follows the method:
• Review Documents and Literature
• Interview Personnel
• Non-destructive Condition Survey
• Destructive Materials Sampling and Testing
Conclusions
Results and conclusions from the three components were reconciled and discussed
to determine interrelationships between components. Results are reviewed to
conclude whether current failures are isolated or indicative of a systemic problem
with the pavement design and cross section. Underlying rates of deterioration are
reviewed to determine the Estimated Remaining Service Life (ERSL) of the
pavement. The viability of type cross sections used on the GBD is reviewed and
related to the viability of other type cross sections used by the Southern District of
Main Roads.
The methodology developed for this study is reviewed and considered for its
application to other new construction projects completed by the Department of
2
Background
2.1
Department of Main Roads Queensland
The Queensland Department of main roads is responsible for 34,000 km of state
controlled road network. There are three funding types which categorise the roads
controlled by Main Roads, Queensland. These are National Highways (NH),
Other State Controlled Roads (OCSR) and Local Roads of Regional Significance
(LRRS). State controlled roads account for approximately 20% of the state’s total
road network and carries approximately 70% of the state’s traffic.
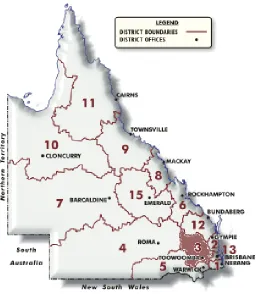
Management of such a large network throughout the state is facilitated through the
division of the State into 14 separate districts. The district divisions can be seen in
[image:32.612.242.499.387.681.2]Figure 2.1 and District Details are shown in Table 2.1. The southern district has been highlighted.
Table 2.1: Main Roads Districts
District No District Headquarters
1 South Coast Hinterland Nerang
2 North Coast Hinterland Gympie
3 Southern Toowoomba
4 South Western Roma
5 Border Warwick
6 Central Rockhampton
7 Central Western Barcaldine
8 Mackay Mackay
9 Northern Townsville
10 North Western Cloncurry
11 Peninsula Cairns
12 Wide Bay Bundaberg
13 Metropolitan Spring Hill
15 Central Highlands Emerald
2.2
Southern District of Main Roads
The Southern District of The Department of Main Roads Queensland is
responsible for 3118 km of State Controlled roads and includes seventeen Shires.
The Southern District is comprised of 18 local government councils: Toowoomba
City, Cherbourg (Community) Council and the Shire Councils of Crows Nest,
Cambooya, Esk, Gatton, Millmerran, Murgon, Jondaryan, Laidley, Kingaroy,
Rosalie, Nanango, Wondai, Chinchilla, Wambo, Dalby Town and Pittsworth. The
Figure 2.2 Southern District Map
www.mainroads.qld.gov.au
Five National Highway Links are controlled by the Southern District, Main Roads,
as shown in Table 2.2. Most critical, due to highest traffic volumes and freight
movement, is the Warrego Highway, Ipswich to Toowoomba, comprising of
Table 2.2: Important state-controlled roads within Southern District
2.3
Warrego Highway
The Warrego Highway, east of Toowoomba, shown in Figure 2.3, is part of the
National Highway System linking the productive areas of South Western
Queensland, Northern New South Wales together with parts of Central and
Western Queensland to the markets and distribution centres of Toowoomba,
Brisbane and other further destinations. The Warrego Highway is designated as
part of the overall Brisbane to Darwin corridor. The Warrego also links with the
New England Highway and the Gore Highway. The link with the Gore Highway
The freight function on the Warrego Highway is critical for the economy of the
State and the efficient movement of freight carrying vehicles. Long term
performance of the Highway is crucial for the development of the Queensland
economy into the future.
The Warrego provides a vital commercial link between Brisbane, the Brisbane
Industrial Zones and the Port of Brisbane to the whole of South West Queensland
and Northern New South Wales. Consequently, the Warrego Highway is heavily
relied upon by both Inter-State and Intra-State freight transportation industries,
travellers and the local communities established along its length.
Figure 2.3 South East Queensland Map
2.4
Gatton Bypass
The Queensland Department of Main Roads initially recognised the necessity to
construct a bypass of the Warrego Highway (between Ipswich and Toowoomba)
around Gatton Township in the 1960s. The primary objectives of the bypass
construction were to ease traffic congestion through Gatton Township, reduce
heavy vehicle movements through residential areas, and reduce travel time on the
link.
The Department adopted the current 21 km northern bypass route in 1975 and
detailed design commenced in early 1984. Construction commenced in early 1985
with completion achieved in November 1989. The project cost $A23 million and
consisted of three major road contracts, two major bridge contracts (Sandy Creek
and Lockyer Creek) and one smaller contract for the end connections. The bypass
design accommodated a four-lane upgrade when funding became available.
2.5
Gatton Bypass Duplication
The Deputy Prime Minister and Minister for Transport and Regional Services
announced the provision of funding for construction of the 21km Gatton Bypass
Duplication (GBD) immediately following the May 2001 federal budget, as part of
the Roads to Recovery initiative. The project included a new grade-separated
intersection at the eastern end and a duplication of grade-separation over rail and
road at the western end. A Map of the location of the Project is shown in Figure
2.4
Figure 2.4 Gatton Bypass Duplication Map
The primary objectives of the GBD project were to:
• improve safety by reducing the severity and frequency of accidents;
• increase freight-efficiency through improved travel conditions,
overtaking opportunities and consistent travel speeds; and
• develop a consistent driver expectation on the Brisbane to
Toowoomba link by removal of the last two-lane section.
Prior to duplication, the Gatton Bypass carried 10,130 vehicles per day with
19.7% commercial vehicles. Traffic Census Reports indicated that between 61%
and 72% of the Warrego Highway corridor traffic travelled on the Gatton Bypass
while the remainder utilised the Gatton - Helidon Road which runs roughly
parallel to the Warrego Highway and passes through the rural centres of Gatton
and Grantham. An improved Level of Service (LOS) on the Gatton Bypass would
increase demand on the link by drawing some traffic from the Gatton - Helidon
Road.
Traffic growth rate at the time of Project Initiation was 5% and was expected to
continue over the design period. If the rate of growth continued, then it was
expected that the Gatton Bypass would be servicing 25,000 vehicles per day in a
20-year planning horizon.
The Gatton Bypass had also developed into an accident black spot between
Brisbane and Toowoomba regions through the high proportion of severe and
traumatic traffic accidents that had occurred since its opening. There were 16
lives lost on the section of the highway and there had been 22 head-on collisions.
From November 1998 to 2001, there were 107 reported accidents including 41
involving death or hospitalisation. In the event of serious accidents, all traffic
would need to be detoured through Gatton and during the undertaking of major
The Bypass was the subject of complaint, due to lack of overtaking opportunities.
In response, Main Roads constructed three overtaking opportunities on the
highway in 1993 plus an additional westbound lane in 1994. A less than desirable
LOS can was considered to exist. This perception was most probably conditioned
by the very high LOS provided by the four-lane divided sections on both ends of
the Bypass.
Duplication from two lanes to four lanes would improve the LOS, consistent with
the efficiencies experienced on the remainder of the Brisbane to Toowoomba link.
2.6
Project Construction History
The GBD was carried out as three main construction packages with each using
different arrangements for design and construction. This enabled construction to
start sooner than other contractual arrangements would allow. The three packages
are shown in Figure 2.5.
The Project consisted of three (3) packages:
Package 1: The eastern end, with a length of 5.1 km, was a Design and Construct
Contract (D&C), with Bielby Holdings carrying out the work.
Package 2: The centre, with a length of 10.1 km, was designed by RoadTek, and
the construction contract was awarded to Stockport. Financial
problems experienced by Stockport caused disruptions to the work
schedule, and the work was completed by RoadTek.
Package 3: The western end, with a length of 5.9 km, was designed by Farr Evrat
under contract, with the construction contract being awarded to
Figure 2.5 Construction packages for the GBD Project
The major roadwork involved in the project was a new 21km two lanes
construction on the northern side of the existing road, to become the
Brisbane-bound lanes of the bypass. There are 15 cuts ranging in height from 2-9m in
height, 19 embankment fills ranging from 3-8m in height, 7 new bridges and
banks of box culverts in the new construction. Other work included the
modification of the existing lanes from a two-way road to become the
Toowoomba-bound lanes of the new bypass (changes to line marking, guardrail
installations and signs), duplicating the Helidon interchange at the western end,
building a new Gatton-Esk interchange at the eastern end, and bridge works.
Costs for the duplication project totalled $47 million, and the project reached
Practical Completion for the majority of the works by the start of 2004. A
Table 2.3: Summary of Gatton Bypass Duplication Project Costs
2.7
Cross Section History
The project was designed in accordance with “The Standards and Guidelines for
the Construction of National Highways”, March 1987, issued by the Federal
Department of Transport and Communications. A general design speed of 100
km/h was assumed, based on the relationship with the existing carriageway. The
following, Table 2.4, shows the minimum proposed configuration at the Design
Stage of the Project. This Configuration was adhered to except where some
Table 2.4: Road Configuration
CROSS SECTION
Formation 11 metres
Traffic Lanes 2 by 3.5 metres
Shoulders 2.0 metre outer, and 1.0 metre inner
Median 21 metres
PAVEMENT
Planning Configuration Unbound granular and bitumen chip seal
Width Full Formation
Design Life 20 years
Risks were identified during the initiation of the project and pavement
performance was highlighted as critical. High Traffic volumes, high commercial
vehicle volumes and the profile of the project all contributed to additional
emphasis being placed on pavement design and construction. It was considered
that the application of current granular pavement design and construction methods
within Southern District would not provide a satisfactory outcome. Subsequently,
ideas on applicable pavement design and construction design methods and
controls were sought from throughout Main Roads and Australia.
The Pavement Design for the Project was an unbound flexible pavement design
adopted from the Victorian Roads Authority, VicRoads. Development of this
Heavy Duty Unbound Flexible Pavement for Rural Roads began in the 1970’s
after significant failures occurred in several sections of rural freeway only recently
completed in Victoria.
Major investigations were undertaken into causes for the unexpectedly poor
performance of the rural freeway sections completed in the 1970’s by VicRoads.
investigation concluded the causes of the premature distress being exhibited by the
pavements were from:
o Properties of the Base Material
o Water entry from unsealed shoulders
o Water entry from Verges
o Lack of Pavement Drains
Figure 2.6 Early 1970’s VicRoads Pavement Design for Rural Freeways
Substantial changes were made to the VicRoads pavement design including;
• Longitudinal sub-soil drains were provided
• Impermeable verges were constructed
• Sealed shoulders were provided
• A double coat seal was included as the new surfacing regime
• The crushed rock layer was increased from 100mm to 200mm
• Crushed rock sub-bases were provided
• New specifications for pavement materials were introduced
• Control measures for quarries were introduced
• Higher standards of compaction were introduced (98% Modified)
50mm Asphalt
100mm Crushed Rock Base
200mm Subbase
200mm Select Fill
Some of the changes are indicated in Figure 2.7.
Figure 2.7 Revised VicRoads Pavement Design for Rural Freeways post early 1970’s
2.8
Cross Section Design
The Victorian Heavy Unbound Flexible Pavement adopted for the Gatton Bypass
Duplication Project is significantly different to normal pavement construction in
the Southern District, Main Roads. While some of the innovations implemented
by VicRoads had already been implemented by Main Roads Southern District,
there were a number of new innovations adopted from the VicRoads design:
1. Impermeable verge constructed prior to pavement layers
2. Higher compaction standard for Base Course
3. Laying of the base in thinner layers to control moisture and compaction
4. New Specification for base to increase impermeability and cohesiveness
5. Longitudinal subsoil drains to drain the pavement
6. Use of a Paver for laying pavement layers
7. Seal extended over verge
The basis for the introduction of these innovations was to limit the entry of Two Coat Seal
150mm or more select fill 200mm Crushed Rock Base
200mm Crushed Rock Subbase
implemented through the specification of materials for use with the Degree of
Saturation requirement for all layers being 65%.
Historically, unbound granular pavement construction in Queensland comprised a
sprayed seal overlying a crushed rock base/subbase overlying a subgrade. This
profile was typically a full width construction with excavation or earthworks to
subgrade level with layers placed at full width. A construction method new to
Queensland was chosen for the Gatton Bypass Duplication. This method was
used successfully a number of times by VicRoads throughout Victoria. The
unique aspect of this method involves the construction of the verge over the
subgrade followed by the construction of the pavement layers under the running
lanes. This is shown in Figure 2.8. The verge material is a lower quality
pavement material (soaked CBR 10%) than is used under the running lanes. This
construction method has been proven by VicRoads to be more economical than a
full width pavement construction, due to the saving achieved from the significant
quantity reduction in high quality crushed rock. Prior to construction, the
geotechnical investigation along the alignment identified material suitable for
verge construction.
As shown in Figure 2.9, the pavement is boxed in by impermeable verges and a high strength controlled subgrade. Shown also is the location for the installation
of the subsoil drains.
Figure 2.9 Typical GBD pavement section
A higher compaction standard of 102% standard for the base courses was adopted
rather than 100%, normally applied in the Southern District of Main Roads.
VicRoads normally usually uses a 98% modified compaction which equates
roughly to 103% standard, but equivalence from standard to modified compaction
can vary greatly depending on the material.
Placement of the unbound granular material was in 100mm layers to maximise
moisture control and degrees of saturations for the layers. Thinner layers also
provided for greater compaction to be achieved with less compactive effort.
A new specification was developed for the material used as the base courses to
increase the cohesiveness and reduce the permeability. The Main Roads
Supplementary Specification, Gatton Bypass Duplication Packages 1 & 2, calls for
Type G1.1 to have a Californian Bearing Ratio of at least 80%. Refer to Table
2.5 for the relevant specified properties of Type G1.1 base material placed along
the entire alignment of the GBD. To increase cohesiveness and reduce
permeability, Plastic Properties requirements were relaxed and additional fine
materials were allowed in the mixes. 300mm CBR
Verge CBR 10
Low permeability 140mm 2.5
100mm G1.2 100mm G1.2 100mm G1.1 100mm G1.1
Longitudinal sub soil drains were placed along the length of the project. This was
to allow moisture to exit the pavement. An example of the subsoil drain
installation is shown in Figure 2.10.
Figure 2.10 Example of Installation of subsoil drains.
The pavement layers incorporating base and subbase materials required the use of
a self propelled spreading machine (paver). The paver provided the opportunity to
reduce segregation, increase the consistency of laid materials and gain greater
depth control of layers. The paver in action is shown in Figure 2.11 and the
Figure 2.11 Operation of Paver on GBD
The seal was extended over the verge to maximise the chance of keeping moisture
changes low and controlling cracking.
Shown in Figure 2.12 & Figure 2.13 are the typical cross sections used for Cuts
and Fills for the project. Fill cross sections were designed for approximately 75%
of the Project and cut or cut/fill transition for 25%.
Figure 2.13 Typical Cut Type Cross Section
2.9
Pavement Design
The aim of pavement design is to select the most economical pavement thickness
and composition which will provide a satisfactory level of service for the
anticipated traffic (Austroads 2004a). The pavement design is based on a twenty
(20) year Design Life and 1.8 x 10^7 Equivalent Standard Axles (ESA).
The pavement design for the Gatton Bypass Duplication Project was carried out in
accordance with the provisions of the Main Roads Pavement Design Manual
(1999). Subgrade material for the project varied from an expansive black soil at
the eastern limits around Lockyer Creek to sandy/loam material further west.
Several extensive sandstone cuttings were necessary to provide the desired
alignment and grade. Subgrade CBR values from 5 to 10 were anticipated for
insitu material along the extent of the route.
The pavement design included:
• 660 mm unbound granular and 3 coat seal for CBR 5 Subgrade
• 540 mm unbound granular and 3 coat seal for CBR 10 Subgrade
The Pavement Design adopted at the Gatton Bypass is as follows in descending
order from the surface (Dobson 2002):
a) 2-coat seal (as advised in Section 2.10)
b) AMCO prime
c) 100 mm thick Base 1 unbound granular material (CBR 80%)
d) 100 mm thick Base 2 unbound granular material (CBR 80%)
e) 100 mm thick Upper Subbase 1 unbound granular material (CBR 45%)
f) 100 mm thick Upper Subbase 2 unbound granular material (CBR 45%)
g) 140 mm thick Lower Subbase unbound granular material complying with
Type 2.5 of MRS11.05 (CBR 15% modelled)
h) 300-500mm thick CBR 10% controlled subgrade material
i) Semi-infinite subgrade with design CBR of 3%.
Refer to Figure 2.14 for the diagrammatic representation.
Figure 2.14 Pavement Design for GBD 200mm thick base
Type G1.1
200mm thick upper subbase Type G1.2
140mm thick lower subbase Type 2.5
Compacted to 102% RDD
Compacted to 100% RDD
Compacted to 100% RDD
All material used in the Base, Upper Subbase and Verge was to comply with the
Main Roads Supplementary Specification, MRSS.01.010, Gatton Bypass
Duplication Packages 1 and 2. This specification is contained in Appendix K.
Material used in the lower subbase was required to meet the MRS11.05
requirements set out in Table 2.6
2.9.1
Base
The Gatton pavement specification calls for Type G1.1 material to be used for the
base. Refer to Table 2.5 for details on the G1.1 Material.
Table 2.5: Specification for Type G1.1 & G1.2 Material used on GBD.
Property G1.1 G1.2
CBR – California Bearing Ratio (CBR) min 80 min 45
Compaction Standard (% RDD) 102 100
DoS – Degree of Saturation (%) max 65 max 65
LL - Liquid Limit (%) max 25 max 28
PL - Plastic Limit (%) 18 – 22 18 – 22
PI - Plasticity Index (%) 3 – 7 3 – 8
LS – Linear Shrinkage (%) 1.5 – 3.5 1.5 – 4.0
WPI1 80 – 150 80 – 200
WPI2 40-85 40-110
% < 37.5mm 100 100
% < 26.5mm 100 100
% < 19mm 80 – 100 87 – 100
% < 9.5mm 55 – 90 68 – 84
% < 4.75mm 40 – 70 51 – 63
% < 2.36mm 30 – 55 30 – 55
% < 0.425mm 18 – 30 18 – 24
% < 0.075mm 8 – 20 8 – 12
2.9.2
Subbase
The Gatton pavement specification calls for Type G1.2 material for the upper
subbase. The Californian Bearing Ratio must be at least 45%. Refer to Table 2.5
for the requirements for the material.
2.9.3
Lower Subbase
The 140mm layer of lower subbase material comprises MRS11.05 Unbound
Pavements Type 2.5 material. Refer to Table 2.6 for the requirements for the
material.
Table 2.6: Physical Properties of Type 2.5 Lower Subbase
Property Specification
CBR – California Bearing Ratio (CBR) min 15
Compaction Standard (% RDD) 100
DoS – Degree of Saturation (%) 65
LL - Liquid Limit (%) max 40
PL - Plastic Limit (%) max 26
PI - Plasticity Index (%) max 14
LS – Linear Shrinkage (%) max 7.5
% < 37.5mm 85 - 100
% < 9.5mm 40 – 100
% < 2.36mm 20 – 100
% < 0.425mm 10-80
2.9.4
Controlled Subgrade
A 300mm thick CBR 10 material is specified and the purpose of this layer was to
serve as a working platform for construction equipment. Suitable material
identified on site was XW/MW sandstone and MW/SW sandstone. The
specifications are shown in Table 2.7
Table 2.7: Controlled Subgrade Specification
Material Property Specification
Soaked CBR (minimum) 10%
WPI1 300-1200
Swell (maximum) 1.5%
Maximum particle size 75mm
Notes: 1. WPI = PI x % passing 0.425mm sieve.
2.9.5
Verge
Verge material was sourced on site from a cut and comprised XW/MW sandstone
and MW/SW sandstone. The specifications are shown in Table 2.8
Table 2.8: Verge Material Specification
Material Property Specification
Permeability (maximum) 5 x 10⁻⁹ m/s
Soaked CBR (minimum) 10%
WPI1 300-1200
Swell (maximum) 1%
Maximum particle size 20mm
2.10
Seal Design
The seal design at Gatton consisted of a two coat seal. Firstly, the pavement was
primed with cutback bitumen (grade AMC00). The first and second seal are as
detailed in Table 2.9 below. This seal design should only be considered as a
guide as a number of variations occurred over the length of the project.
Table 2.9: Gatton Bypass Seal Design
Seal Aggregate
Size (mm)
Binder
Type1
Aggregate Spread Rate
(m2/m3)
Slow Lane Binder Application
Rate (L/m2)
Fast Lane Binder Application
Rate (L/m2)
First 10 S2S 120-130 0.8 1.0
Additional2 10 S2S 120-130 1.2 -
Second 14 S2S 95 1.7-2.6 2.3-2.9
Notes: 1. As per Queensland Department of Main Roads Standard Specification MRS11.20 Cutback Bitumen; 2. Additional seal in the slow lane was required due to severe stripping and some potholing in the slow lane.
2.11
Time Domain Reflectometry (TDR) Installations
As part of a new approach to pavement and cross section design, Southern District
decided to instrument and monitor the pavement cross sections ability to keep
moisture low. Seven sites were selected along the alignment to be instrumented
and monitored. The instrumentation comprised Time Domain Reflectometry
(TDR) probes (beneath the slow lane, along the centreline and in the fast lane for
each of the lower base, subbase and subgrade layers) and three temperature probes
installed in the subbase at the same locations as the TDR probes in the subbase.
The installation of the TDR probes and the ongoing monitoring represent the
single greatest use of the technology (for moisture monitoring in pavements) by
Main Roads. At time of trenching, support test data such as the in-situ CBR,
OMC and relative density were also collected, and the results reported with oven
2.12
Site Geology
The site geology varies from recent alluvium, in and adjacent to creek channels, to
weathered sandstone in elevated areas. Three different soil types were
encountered along the alignment:
• Alluvial black soil
• Residual duplex soil
• Alluvial sandy soil
The alluvial black soils are found along the alluvial flats from the start of the job
to approximately Ch 30700. They are dark grey to black in colour, highly plastic
(PI §-40%, LS §-17%) cracking clay soils typically with an organic surface
horizon.
The residual duplex soils are the dominant soil type from Ch 30700-45300. They
comprise two distinct horizons with the upper being sand or loamy silty sand and
the lower being a brown to yellow sandy clay to clay (Dissanayake 2001).
The third soil type is the alluvial interlayered fine sandy and silty clayey soils
intersected on the alluvial plain of Sandy Creek (Dissanayake 2001).
2.13
Maintenance Issues
Small sections of pavement began to fail in early 2004 as shown in Figure 2.15
and Figure 2.16. A visual investigation of the new pavement was conducted in
July 2004, six months after project completion. Minor patching west of the Sandy
Creek Bridge had been carried out in January-February 2004. Low roughness and
Figure 2.15 Isolated Failure on the Project in July 2004
Figure 2.16 Asphalt Failure west of Sandy Creek Bridge in July 2004.
Since the beginning of 2006 a number of failures have been developing within the
project. Failures are occurring in three distinct locations:
1. In cross sections constructed in cuttings
2. At cut/fill transitions
Field inspection in August 2007 resulted in 56 sections of the GBD being
identified as failing. Examples of the types of failure are shown in Figure 2.17 &
Figure 2.18. Maintenance works in late 2006 resulted in 36 failures being repaired by milling and filling with dense graded asphalt.
Figure 2.17 Failure at Chainage 63.175km
3
Literature Review
3.1
Road Pavements
Australia has the largest proportion of road freight of any OECD country,
measured per capita or per unit of Gross Domestic Product (GDP). This road
freight, measured in tonne-km, has tripled since 1979, and is predicted to double
between 2000 and 2015 (Austroads, 2002). Road pavements in Australia and New
Zealand are valued at approximately A$50 billion, or one third of the total value
of all road infrastructure. Yearly pavement works expenditure is around A$3
billion per year, or nearly half of the total annual road expenditure (Austroads,
2002). Premature loss of pavement performance, leading to a reduction in Level
Of Service (LOS) imposes a significant financial burden on road agencies, who
already struggle with funding shortfalls.
Pavement structure functions to support a surface which has an acceptable ride
quality. The design process aims to provide a pavement which will maintain its
structural integrity in order to provide good quality riding, throughout its design
life. A correctly designed pavement should be functional during the design life,
with only a small chance of structural failure occurring, without requiring any
form of rehabilitation (Robinson 1999).
Performance of road pavements impacts on the following:
• Safety and comfort of road users
• Effective management of the road freight task
• Load-carrying capacity and hence the life of the road
• Extent of wear and tear on vehicles, especially heavy vehicles
3.2
Pavement Performance
Extensive research has been carried out throughout the world into Long Term
Pavement Performance. The Long Term Pavement Performance Program (LTPP)
in the United States is administered by the Federal Highways Authority (FHWA)
and has been gathering information since 1987. The LTPP was set up to study the
rapid deterioration of the US Highway network and to gain improved
understanding of the effect of various parameters on pavement performance
(Stubstad 2006). Two main sub-programs exist, General Pavement Studies (GPS)
and Specific Pavement Studies (SPS). One sub-program known as the Seasonal
Monitoring Program (SMP) attempts to understand the impact of daily and yearly
temperature and moisture changes on pavement structure and its response to loads.
Sixty-three (63) sections were selected from the GPS and SPS st