Predicting Aural Performance in a Tertiary Music Training Programme
Louise M. Buttsworth, Gerard J. Fogarty and Peter C. Rorke
University of Southern Queensland
We gratefully acknowledge the assistance of Cameron Brown and Gabrielle Emery from the Music Programme at USQ.
Requests for reprints should be sent to Gerard Fogarty, Faculty of Sciences, USQ, Toowoomba, QLD, 4350, Australia
Abstract
Predicting Aural Performance in a Tertiary Music Training Programme
Throughout this century, a number of musical aptitude batteries have been developed (e.g., Seashore, 1939; Drake, 1954; Gordon, 1965; Bentley, 1966; Wing, 1970; Karma, 1985). The variety of tests employed in these musical aptitude batteries emphasizes the diverse range of skills and abilities that we associate with the musical area. Some of these abilities relate to the judgement of rhythm (Drake, 1954), others to pitch discrimination and tonal memory (Seashore, 1939), whilst others assess more complex abilities such as judgement of whether two passages are versions of the same model or fundamentally different (Gordon, 1965). In general, these batteries were developed to assist with the prediction of successful musical performance.
When one turns from problems of predicting musical performance to problems of developing musical ability through formal training programmes, such as are found in tertiary institutions, we find that there are aspects of musical achievement selected for special attention. One of these special areas concerns what are known as aural abilities, which come under the general heading of listening skills. It has long been recognized that listening is more than the physiological sense of hearing. Sounds that are pleasant to one ear may be discordant to another. Perceptions differ from
individual to individual and from culture to culture. Musicians, perhaps more than any other group in society, need to be aware of these subtleties because there is often a very fine line between sounds which are aesthetically pleasing and sounds which, although very similar in terms of physical properties, are not nearly as pleasing to the ear. It is for this reason that the development and training of aural abilities is seen as such a significant aspect of formal musical training.
As with other areas of musical performance, the term aural is really something of an umbrella, used to cover quite a wide range of more specific abilties. Some of these specific areas are more important than others. One vital aspect of aural abilities concerns intonation, otherwise known as playing in tune. Accurate intonation is accepted as one of the foremost considerations leading to successful musical performance (Duke, 1985) and is also regarded as one of the most frustrating
problems in music-making (Swaffield, 1974). This may surprise non-musicians who probably feel that most musical instruments are manufactured to produce an in-tune tone and that the task is simply to place the fingers correctly. This is certainly not true. With the exception of keyboard instruments and the majority of percussion instruments, fine tuning is required and specific techniques to achieve this differ from instrument to instrument. Above all, it is the musician's judgement of what is just right that determines the final tone, rather than any inbuilt feature of the instrument.
Aural training, at the University of Southern Queensland (USQ) at least, aims to develop listening skills for a wide variety of musical contexts. More specific aims include improving the students' ability to identify sounds and reproduce them in firstly a vocal form and secondly in written form. The particular methodology used in 1990 to achieve these aims was based on aspects of the Kodaly approach to aural training and used relative solfege as well as absolute pitch names. Exercises involved both written and practical tasks. Written tasks included dictations and
recognition of intervals, while the practical tasks included harmony singing and sight singing.
weakness concerned the identification of out-of-tuneness, especially in ensemble situations. This is a key attribute of aural ability and also one of the most difficult to train. Siegel and Siegel (1977a) probably summarised the feelings of many
professional music trainers when they posed the question: "Why is it, then, that musicians are so poor at telling 'sharp' from 'flat'?" (p. 406). They found in their studies that musicians with good relative pitch were very good at identifying the standard tonal intervals but that they were quite inaccurate when it came to judging in-tuneness within each of the intervals. Subjects had a strong tendency to rate out-of-tune stimuli as in out-of-tune. Their explanation was that musicans develop a form of
perceptual categorization, rather similar to that which we use to discriminate between vowels and consonants in the speech domain. As a result, they learn to tolerate pitch deviations and perceive the resulting tones as in tune. How does one distinguish this learned tolerance from the ignorance of the nonmusician, who also is blissfully unaware of the poor intonation?
Fortunately, there are other aspects of aural training where the expected relationship between training and performance is evident. Siegel and Siegel (1977b) report that interval identification improves dramatically as a function of training with musicians reporting intervals as sounding qualitatively different from one another. Thus, overall scores on an aural training programme should still reflect expected differences between students who have mastered the material being taught in the course and those who have not.
The present group of researchers came together to develop assessment tests which would give some idea of entry level intonation skills of students undertaking the aural training course and the relationship between scores on these tests and end-of-semester results. It was decided at the outset to include a range of tests which differed primarily in the extent to which they tapped processes which were likely to be affected by the aural training programme but which also demonstrated significant individual differences at the outset. The resulting battery included tests of pitch discrimination and tests which assessed various intonation skills within different intervals. Because of the exploratory nature of the study, no attempt was made to formulate specific hypotheses regarding relationships between predictor and criterion variables.
Method
Subjects
The subjects who participated in the study included all of the music students in the Music Programme at the University of Southern Queensland, Toowoomba,
Queensland. These students were either enrolled in the Bachelor of Creative Arts or the Diploma of Creative Arts. There were 91 subjects in all, comprising 64 females and 27 males. First year students numbered 25, there were 27 second year students and 39 third year students. Age of students ranged from 17 to 48 years, with a mean age of 20.46 years. All instrumental families were represented with 12 string players, 16 woodwind players, 13 brass players, 35 keyboardists and percussionists, and 15 singers.
Description of Independent Variables
subjects. Four of the tests were believed to be assessing unlearned aural skills, and these tests were similar to the sorts of pitch tasks found in musical aptitude tests. The tests required an identification of which tone in a melodic interval was higher, or whether a passage of tones was rising or falling in pitch. These four are described below:
• Test 1: The subject was required to identify which of two tones played one after the other is higher. All intervals from a minor third to an octave were used.
• Test 2: Similar to Test 1, except only tones and semitones were used.
• Test 3: This test required similar processes again, except intervals smaller than a semitone were used. Items one, two and three contained intervals of 50 cents, items four, five and six contained intervals of 45 cents, and so on.
• Test 4: Test 4 contained four-tone scale passages and the task was to indicate whether the passage was rising or falling in pitch. Major and minor scales were used.
The remaining ten tests were believed to be assessing aural abilities which depended to some extent on prior learning, primarily intonation skills. Nine of the tests required an identification of which tone was out-of-tune in a passage of tones or a chord. The remaining test of the battery assessesed the ability to identify which particular scale form was being used in a passage of tones. These ten tests are described below:
• Test 5: The subject was required to identify whether the harmonic or the melodic form of the minor scale was being used. Since the sixth and seventh tones of the scale are the only discriminating factors between the two forms, only the four highest tones of the scale were used (fifth, sixth, seventh and eighth tones of the scale).
• Test 6: Two tones were played one after each other, and the subject was asked to indicate whether the second tone was out-of-tune or not. Intervals between a minor second and an octave were used.
• Test 7: Two tones were played at the same time, twice. In the first dyad, both of the tones were in-tune, and in the second dyad, the subject was asked to indicate whether either the higher or the lower tone was out-of-tune. Intervals from a minor third to an octave were used.
• Test 8: The subject was required to identify which tone was out-of-tune in a five-tone scale passage. The first five-tone was always in-tune, and the subjects decided among the remaining four tones. Major and minor scale passages were used.
• Test 9: Similar to Test 8 except chromatic scale passages were used.
• Test 10: A chord was played twice, and the subject had to indicate which tone, if any, was out-of-tune. It differed from Test 7 in that three-tone chords, formed from major chords and their inversions, were used.
• Test 11: Similar to Test 10 except in that minor chords and their inversions were used.
• Test 12: Similar to the previous test, except that augmented and diminished triads and their inversions were used.
• Test 13: Again, this test is similar to the previous ones. This time, however, subjects had to detect out-of-tune tones in chromatic chords and chords using the superimposed third.
General Comments on Test Format and Presentation
With a small number of response options, just two in the case of the first seven tests, guessing was clearly a possible strategy for the subjects. This is commonly overcome by using a large number of items in the tests. In the present instance, however, the tests were thirty items long, not sufficient to overcome errors introduced by guessing. Three other techniques were used to discourage guessing. Firstly,
subjects were asked to do their best to determine the correct answer for each item. Admittedly, this is a very weak form of control. Secondly, wherever possible, subjects were given the option of responding that none of the tones were out of tune. Tests seven to fourteen included this extra answer option. Thirdly, each test was constructed in such a fashion that the initial items were quite easy for all subjects. For the tests that required a tone to be out-of-tune, for example, the amount of out-of-tuneness of the particular tone was initially large but, as the test progressed, the amount
decreased. The medium by which the deviation was measured is called cents. Since 100 cents equals a semitone, the smallest unit in Western scales, the largest degree of out-of-tuneness possible is therefore 50 cents above or below the actual tone. For the tests that required a tone to be played out-of-tune, items one, two and three contained a tone that was 50 cents out-of-tune. In items four, five and six, the tone was 45 cents out-of-tune; in items seven eight and nine one tone was 40 cents out-of-tune, and so on. The last three items of each test contained a tone that was only five cents out-of-tune. These measures were designed to maintain the interest of the subjects in the tests and, hopefully, to discourage guessing.
General Comments on Test Construction
All items were played within the two-octave range surrounding middle C on the keyboard.This range was chosen because it corresponded well with the four-voice vocal range, with the extreme high and low tones removed. For those tests where no tuning was involved, a piano sound was obtained on a Roland Planet-P synthesizer: MKS-10. The tones were played on the Roland Midi Keyboard Controller. The sound was obtained through the MKS-10, run through a TEAC 15,16 channel mixer, and recorded onto two channels (1 and 2) of a MCI - 4 track recorder. All editing was done on this machine before the tape was copied onto four channels of a TEAC A-3440 reel-to-reel recorder. This became the master tape for cassette copies.
For the tests that required a tone to be out-of-tune by a certain number of cents, the Roland Super Jupiter MKS-80 was used. This synthesizer has two Voltage Controlled Oscillators (VCO's), the second having a tuner which can accurately increase or decrease the pitch of a tone by + or -50 cents. This unit also contained a mixing control dial of the two VCO's. When a tone was required to be out-of-tune, the mixing control was manually turned from VCO 1 to VCO 2, which was already set up for the correct amount of cents by which the tone needed to be out-of-tune. In-tune tones were played on VCO 1, and out-of-tune tones were played on VCO 2.
All instructions and practice items were included on the recording, and each individual item was announced. An electronic metronome with a silent visual display was used to enable recording to proceed while tones were produced in time to the beat. Depending on the nature of the test, tones and chords were held for one or two full crotchet beats (M.M.=60). Eight beats of silence allowed time to answer.
Description of Dependent Variable
The aural training percentage recorded at the end of semester one, 1990, was the result of two separate examinations, a test requiring written responses worth 40% and a practical test worth 60%. The written examination included recognition of intervals. A total of twenty intervals were assessed in both ascending and descending order. Questions were of four main types: (a) students were given the first tone on the staff and asked to write the second, (b) the tonic tone was given and students were asked to write both tones of the interval, (c) two tones were given successively and students were asked to supply the correct label (eg. major third), (d) two tones were given simultaneously and students were asked to supply the correct label. Students were also required to recognize triads in their root positions and inversions on any degree of the major or minor scales. In the final section of this examination, students had to complete five dictations. For the first dictation, the students were required to write the rhythm for a piece of music. For the second dictation, the rhythm was supplied and the students wrote the melody. The third dictation consisted of a known tune, one to which they had been exposed during training. The fourth dictation was an unfamiliar melody and students were required to write both rhythm and melody. The final dictation was a two- or three-part melody.
The practical test involved the reproduction of pieces which had been set for memorisation during the semester. Examples included canons, themes from composed works, folk songs, and two- and three-part exercises. For the actual performance, students were allowed to choose one of the pieces but other pieces were also chosen by the examiner. The examiner chose examples which covered set memorised works, use of Solfege, use of letter names, singing upper and lower parts, and singing one part and playing another on the keyboard simultaneously. The practical test also covered more techical aspects of aural skills. Students were asked to sing (a) intervals in both ascending and descending order, (b) a series of intervals given numbers and starting tones, (c) ascending and descending scales to set rhythms, (d) triads in ascending and descending order. Rhythmic ability was also assessed through such exercises as clapping in two-part rhythms, clapping or tapping in canon with self, clapping an ostinato with the left hand while singing and conducting with the right.
Marks were allotted for all of these activities and added to the marks gained for the written section to yield the final aural score which formed the criterion variable in this study. Thus, it could be said to represent an amalgam of many different aural skills.
Procedure
Results
Preliminary Analyses
The first 30 students who participated in the study received 100% for Tests 1, 2, and 4. These are three of the four tests which were designed to tap pitch
discrimination abilities. Since the variability of these tests was nil for the first 30 students and reduction of testing time was an important consideration, these three tests were taken out of the battery for the remaining students. This constituted the only variation in testing procedure for the subjects in this study.
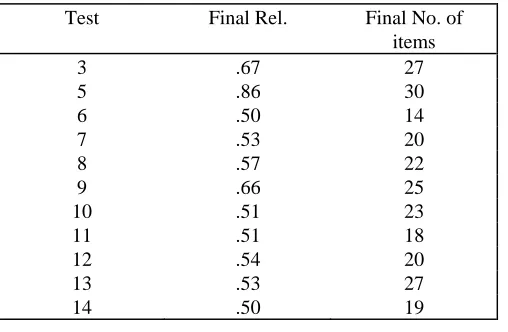
[image:8.595.85.339.400.566.2]Because the majority of the tests were newly developed, the initial stage of data analysis entailed calculating reliability estimates for each test. Data from all 91 students were used in these analyses. Cronbach's Alpha, as implemented in the SPSS Reliability sub-programme, was used as an index of internal consistency. Those items identified as suppressing the reliability of the test because of negative item-total correlations were removed to ensure that as far as possible subsequent analyses were conducted on scales which were homogeneous. Table 1 displays the reliability estimates for all tests and includes the number of items deleted from each test. The tests all have reliabilities somewhere in the 0.50 to 0.86 range, with ten of the estimates falling between 0.50 and 0.67. These tests, therefore, have moderate reliability.
Table 1
Reliability Scores of 11 Tests in the Pitch Battery
Test Final Rel. Final No. of items
3 .67 27 5 .86 30 6 .50 14 7 .53 20 8 .57 22 9 .66 25 10 .51 23 11 .51 18 12 .54 20
13 .53 27 14 .50 19
N = 91
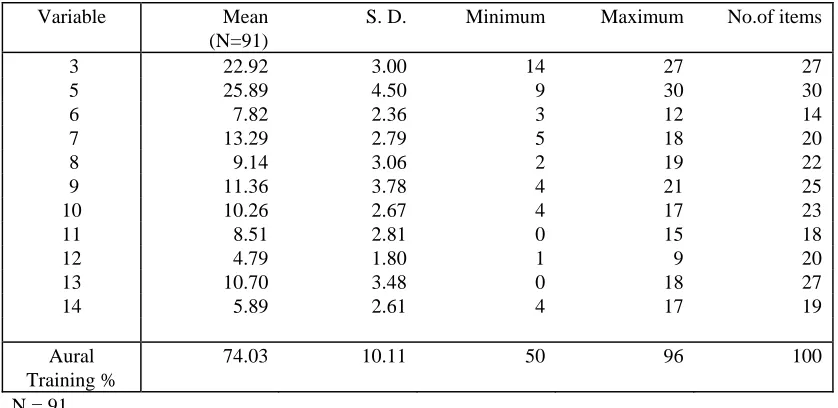
Table 2
Summary Statistics for Total Test Scores
Variable Mean (N=91)
S. D. Minimum Maximum No.of items
3 22.92 3.00 14 27 27 5 25.89 4.50 9 30 30 6 7.82 2.36 3 12 14 7 13.29 2.79 5 18 20 8 9.14 3.06 2 19 22 9 11.36 3.78 4 21 25 10 10.26 2.67 4 17 23 11 8.51 2.81 0 15 18 12 4.79 1.80 1 9 20 13 10.70 3.48 0 18 27 14 5.89 2.61 4 17 19
Aural Training %
74.03 10.11 50 96 100
N = 91
Tests 1, 2, and 4 have been left out of Table 2 for reasons explained earlier: they were too easy and were not administered to all subjects. It appears from Table 2 that the difficulty level of the tests varied markedly, ranging from quite easy in the case of Test 5, with a mean proportion correct of 0.86, to quite difficult in the case of Test 12, with a mean proportion correct of 0.24. The question of appropriate
difficulty level is always a perplexing one in an exploratory study and in the present study it led to situations where some tests were clearly too easy and in other cases too hard. By and large, however, the data shown in Table 2 indicate that there is
reasonable variance on most measures.
[image:9.595.88.518.529.750.2]In order to examine the relationships among these eleven tests, Pearson Correlation Coefficients were calculated. These are shown in Table 3.
Table 3
Correlation Matrix Obtained from Eleven Tests (N=91)
Tests
3 5 6 7 8 9 10 11 12 13 14
T5 .29**
T6 .07 .26**
T7 .42** .34** .25*
T8 .31** .22* -.07 .16
T9 .23** .09 -.02 .28* .46**
T10 .19* .20* .11 .27* .38** .41**
T11 .17 .12 .01 .14 .25** .25** .31**
T12 .28** .31** .12 .17 .11 .22* .30** .25** T13 .27** .22* -.08 .07 .06 .21* .06 .37** .29*
T14 .26** .17** -.06 .23* .23* .22* .15 .32** .10 .45**
Aur .40** .36** .18 .49** .23* .28** .36** .33** .30* .17 .21
The pattern of correlations is interesting. Although the battery was deliberately constructed to include tests which differed from each other, it did include some which might have been expected to correlate highly. The first point to note is that there are no extremely high correlations among the tests themselves. This can probably be attributed, at least in part, to the modest reliability estimates for many of the tests. The highest correlation is in fact 0.46, between Tests 8 and 9, which differed only in the types of scale used. The second point to note is that eight of the tests correlate with the dependent variable. Although none of the correlations could be regarded as high, the maximum being 0.49, these figures are quite in line with those obtained in many other prediction situations. Coupled with what appeared to be a lack of multicollinearity among the predictor variables, these correlations with the criterion suggested that individual tests might well be explaining different parts of the variance in the dependent variable.
Factor Analyses
The original test battery was designed to capture variance associated with two broad factors: pitch discrimination and intonation. The deletion of three of the four markers for the first factor, however, virtually ruled out any chance of these two factors emerging. An attempt to fit the two factor model using confirmatory factor analysis (Joreskog & Sorbom, 1987) was unsuccessful (χ2
df,43= 82.20). Subsequent
analyses were conducted using the remaining eleven tests as separate independent variables. Because 15 of the subjects did not receive Aural scores, these analyses were based on 76, rather than 91, cases.
Data Screening
Prior to the main regression analyses, screening procedures were applied to the full data set. In most cases, variables were normally distributed, except for Test 5 and Test 14 where considerable skewness was evident. Transformations were applied to these variables but regression results were not affected so the untransformed variables were retained. A number of univariate outliers were identified, particularly for Tests 10 and 12. Again, because removal of these outliers did not affect the regression analyses, untransformed data was used in subsequent analyses. An inspection of scatterplots revealed that assumptions of linearity were met. The correlation matrix (Table 3), as mentioned above, using the criteria specified by Tabachnick & Fidell (1989, p. 87), revealed no indication of multicollinearity or singularity within the set of independent variables. With the use of a p<0.001 criterion for Mahalanobis distance, no multivariate outliers among the cases were identified.
Regression Analyses
To investigate how well the tests of the battery predicted aural training results, a stepwise multiple regression from the SPSSx package was performed. This
procedure automatically enters variables into the regression equation in order of their correlation, in the case of the first variable, or partial correlation, in the case of
the interpretation of relative contributions of variables, squared semipartial correlation coefficients are also reported. A summary of the final results for those variables which had significant Beta coefficients is presented in Table 4.
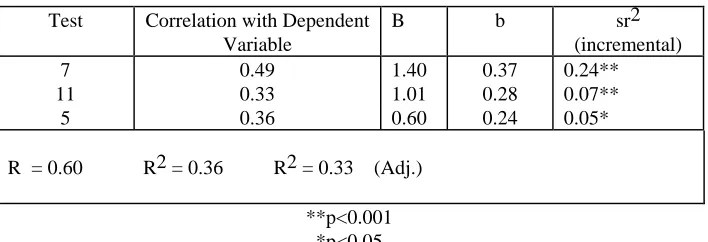
Table 4
Results of Stepwise Regression of Individual Tests on Aural Training Scores (N=76)
Test Correlation with Dependent Variable
B b sr2 (incremental)
7 0.49 1.40 0.37 0.24** 11 0.33 1.01 0.28 0.07**
5 0.36 0.60 0.24 0.05*
R = 0.60 R2 = 0.36 R2 = 0.33 (Adj.)
**p<0.001 *p<0.05
Where B = unstandardised regression weighting
b = standardised regression weighting
sr2 = squared semipartial correlation (unique contribution of variable)
Three of the independent variables contributed significantly to prediction of aural training scores. Test 7 alone contributed 24%, test 11 contributed a further significant 7%, and Test 5 contributed a further significant 5%. The three tests together accounted for 36% of the variability in Aural training scores. Test 3,
although it had the second highest correlation with Aural scores, did not appear in the final equation. Clearly, the proportion of variance which it could have explained had already been accounted for by Test 7.
Discussion
The aim of the investigation was to determine how well a newly developed batttery of tests, containing mainly tests of intonation, could predict tertiary student aural training results. Despite the exploratory nature of the study and problems with reliability and appropriate difficulty level among the predictor variables, the amount of variance explained was not only statistically significant but but quite noteworthy from a practical point of view.
It is interesting to consider the nature of the three tests that were most
predictive. Test 7 required the subject to identify the tone out-of-tune in a dyad. Test 11 was similar, except the subject was required to identify the tone out-of-tune in a triad. Both these tasks required the subject to discriminate a tone that was played at the same time as one or two other tones. It is interesting that these tests were better predictors than the tests whose stimuli required the subject to identify a tone out-of-tune in a passage or to indicate whether a single tone was out-of-out-of-tune. A possible explanation is that it is easier to identify out-of-tuneness when there is an in-tune tone played at the same time, serving as a reference tone.
recalled that the latter test is very similar to Test 11, except that major triads were used instead of minor triads. Test 5 examines an important skill which is not usually assessed in aural form. Students are usually required to distinguish between the two forms of the minor scale by performance only.
It should also be pointed out that the pattern of correlations among the tests themselves makes it difficult to say exactly which tests are most important in predicting Aural performance. Test 3 shares more variance with Aural scores than either Tests 5 or 11, but is excluded from the equation by the prior extraction of Test 7. Test 3 is more like a traditional test of pitch discrimination. Rather than say that such tests are unimportant in accounting for variance on Aural training scores, we prefer to say that their contribution is covered by some of the newer tests developed for the present battery.
Turning to the tests which did not contribute to the prediction of the dependent variable, test six appeared to have little commonality with the other tests in the battery and did not correlate with the criterion (scatterplot was rectangular). The low
reliability of this test suggests that students did not approach the task in a consistent manner and may have resorted to guessing. A possible explanation is that the test did not contain enough in-tune tones to serve as reference points. Only the first tone was in-tune. All other tests of this nature included more tones for reference (Tests 8, 9, and 10), or had a reference in-tune dyad or triad before each test item (Test 11, 12, 13, and 14). The concept of categorical perception offers another explanation, not
necessarily at odds with the first. The concept refers to a process whereby continuous acoustic variation is transformed into a discrete set of auditory events (Siegal and Siegal, 1977a, 1977b). These authors reported that musicians with good interval judgement were poor at discriminating between in-tune melodic intervals and out-of-tune melodic intervals. These findings suggest that tests of intonation may yield unpredictable results simply because even accomplished musicians fail to detect poor intonation. In the same way that a person with good language skills recognises the sound of the letter 'a' without difficulty even when it is quite distorted, so too do accomplished musicians recognise a tone for what it supposed to be, rather than for what it actually is. Test 6, with just a single reference tone, may well have invoked this tendency among the better students thereby reducing their performance to the level of the less accomplished students.
Whilst these findings are encouraging, the study contained some obvious weaknesses. Due to its exploratory nature, there was some uncertainty concerning the appropriate difficulty level of the tests used. It appears that three tests were too easy and that other tests were too difficult for this sample. In the case of the tests that were too difficult, an inspection of the items deleted indicates that they were mostly towards the end of the tests, where difficulty level had been manipulated by decreasing the amount of of out-of-tuneness. The particular problem with this technique is deciding the limits for out-of-tuneness. Even though there is a desired rate of frequency for each tone, there is some question concerning how much
deviation from this desired frequency is identifiable. From inspection of the reliability table, it appears likely that students were guessing items near the end of some tests, suggesting that tones which are out of tune by five, ten or even fifteen cents may be too difficult for a tertiary music population to identify.
cannot establish its reliability. We can only report that the marks were awarded by a lecturer with many years of experience teaching and assessing Aural skills. With regard to validity, we are able to report that its correlation with Grade Point Average (Aural score not included) was 0.49. In other words, it shares a reasonable amount of variance with the other courses taught in the music programme. The psychometric properties of the criterion variable are being examined more closely in a follow-up research project. In this project, which will not be completed for another year or so, the reduced battery has been administered to a much larger sample comprising
students from three institutions. This second study includes a wider range of potential criterion variables and should give a better picture of the relationship between scores on these tests of intonation and performance in different areas of the music
programme.
In summary, the present study has shown that a battery of tests assembled mostly to assess intonation skills by judging whether or not tones are in tune, has successfully predicted a large part of score variance in a course designed to train a wide range of listening skills. This occurred despite the fact that among the many activities involved in the assessment for the Aural course, none actually required the students to judge whether or not a tone was in tune. It seems that this aspect of intonation represents a more fundamental musical aptitude which can be measured at the outset of tertiary training and which appears to form part of the platform for later learning of a variety of aural skills.
References
Bentley, A. (1966). Musical ability in children and its measurement. New York : October House.
Duke, R.A. (1985). Wind instrumentalist's intonational performance of selected musical intervals. Journal of Research in Musical Education, 33(2), 101-111. Drake, R.M. (1954). Manual for the Drake musical aptitude tests. U.S.A: Science
Research Associates.
Gordon, E.E. (1965). Musical aptitude profile. U.S.A: Houghton Mifflin. Joreskog, K.G., & Sorbom, D. (1988). LISREL 7: A guide to the program and
applications (2nd ed.). Michigan: SPSS Inc..
Karma, F. (1985). Components of auditive structuring - towards a theory of musical aptitude. Bulletin for the Council of Research in Music Education, 82, 1-13 Seashore, C. (1939). Psychology of music. New York: McGraw-Hill.
Siegel, J.A., & Siegel, W. (1977a). Categorical perception of tonal intervals: Musicians can't tell sharp from flat. Perception and Psychophysics, 21(5), 399-407.
Siegel, J.A. & Siegel, W. (1977b). Absolute identification of notes and intervals by musicians. Perception and Psychophysics, 21, 143-152.
Swaffield, W.R. (1974). Effect of melodic parameters on ability to make fine-tuning responses in context. Journal of Research in Music Education, 22(4), 305-312. Tabachnick, B.G., & Fidell, L.S. (1989). Using multivariate statistics (2nd ed.). New
York: Harper Collins.
Thorndike, R.L. (1982). Applied psychometrics. Boston: Houghton Mifflin.