A Comparison of Measures of Preferred Processing Style: Method or Trait Variance?
Gerard J. Fogarty and Lorelle J. Burton University of Southern Queensland
Australia
Abstract
A Comparison of Measures of Preferred Processing Preference: Method or Trait Variance?
Paivio's (1971) "dual code" theory stated that there are two fundamental ways of representing knowledge: the first a spatial form associated with the visual modality, the second a verbal form associated with the auditory modality. According to this theory, any given stimulus can be encoded using one of two symbolic systems: the verbal system which is essentially linear and most suitable for dealing with language and abstract, sequential relationships; and the imaginal system, which specialises in dealing with non-verbal and concrete, parallel relationships. A number of controversies followed the publication of this theory. One that is more germane to the topic of this paper concerned the mechanism for selecting the form of encoding. Initially, it was believed that the selection was data-driven: the content itself determined the form of coding. It soon became apparent that this was not entirely true and that far from being completely data-driven our natural encoding efforts involve both verbal and visual components for which individuals show varying degrees of preference (Clark and Chase, 1972; Richardson, 1977; Young, 1978; Cooper, 1982; Richardson, 1983).
The recognition of individual differences in preference for processing mode led to the development of scales to measure this tendency among individuals. Among the first of these scales were the Ways of Thinking (WOT) questionnaire (Paivio, 1971) and the Individual Differences Questionnaire (IDQ) (Ernest & Paivio, 1971; Paivio & Harshman, 1983), a self-report instrument which yielded scores on a verbal scale and a separate imagery scale. The IDQ was criticised by Katz (1987) who believed that it was a measure of imagery self-belief rather than a measure of individual differences in processing
preference. It was also criticised by Richardson (1983) for its reliance on poorly-defined imagery processes. Richardson’s (1977) own Verbaliser-Visualiser Questionnaire (VVQ) is another instrument often used for measuring processing preference. Richardson drew on the hemispheric specialisation work of Kinsbourne (1972) as a source of some of his ideas. The VVQ consists of 15 true-false items from the WOT and yields a single value indicating strength of tendency to use either verbal or visual coding forms. A low score indicates strong verbalising tendencies and a high score indicates strong visualising tendencies. The scale has been criticised by a number of authors (eg. Edwards & Wilkins, 1981; Sullivan & Macklin, 1986; Parrott, 1986; Boswell & Pickett, 1991); the usual criticism being that the scale treats the verbaliser-visualiser tendency as a unitary
construct. This scoring system has been criticised because it is difficult to know whether failure to endorse a “visual” item really indicates a preference for verbal encoding (McGrath, O’Malley, Dura & Beaulieu, 1989). It may be that the person is weak at both. These researchers factor-analysed the VVQ and found evidence for two uncorrelated factors, one representing verbal fluency, the second vividness of visual imagery. All but three of the 15 items loaded on one or other of these factors. They recommended treating the VVQ as though it comprised two separate scales.
what he termed a “somatic” response which serves as a dynamic link between image and meaning. Thus, his Triple Code Model consists of image, somatic and meaning
components and was applicable at all stages of development. Aylwin (1977, 1981, 1985, 1990) is another who considers thinking in terms of three different forms of mental representation: verbal (inner speech), visual (pictures in the mind’s eye), and enactive (imagined action or role play). These three correspond to the overt activities of speech, vision, and action. According to Aylwin (1985), people can interpret the same stimulus in three different ways but the form of representation leads to different associative patterns. The word “parrott”, for example, if represented in the verbal mode is more likely to be associated with a superordinate word such as “bird”. If the representation is primarily visual, the association is likely to be with a word reflecting an attribute, such as “green”. If the representation is enactive, the predominate association might be with a phrase such as “cracking nuts” (Aylwin (1985, p.41). She argues that despite having the three modes available to us, individuals tend to use that form of thinking which best balances task demands with personal preferences. To measure preference, Aylwin developed the Modes of Thought Questionnaire (MOTQ). Scores on this scale were found to correlate with career choice, gender, and a range of standard psychometric tests of imagery and verbal abilities (Aylwin, 1990).
A third research tradition that converges on the problem of preferences in processing modality has its roots in the work of Clark and Chase (1972) who devoted much effort to understanding the mental processes people use to verify sentences
describing rather simple pictures. The task upon which much of this work was based was the sentence verification task (SVT). The SVT is a simple experimental paradigm which involves the presentation of a sentence describing a pictorial configuration which varies from trial to trial. When subjects have indicated that they comprehend the sentence, the pictorial representation appears on the screen and subjects indicate whether or not the sentence accurately described the picture. Sentences and pictures can be paired in sixteen different ways covering four different experimental conditions. Eight of the sentence-picture pairs and their associated experimental conditions are listed below. The
remaining eight pairs can be obtained by reversing the order of "*" and "+" in the picture.
Sentence Picture Trial Type
*
STAR IS ABOVE PLUS + True Affirmative (TA) *
PLUS IS BELOW STAR + True Affirmative *
PLUS IS ABOVE STAR + False Affirmative (FA) *
STAR IS BELOW PLUS + False Affirmative
*
PLUS IS NOT ABOVE STAR + True Negative (TN) *
STAR IS NOT BELOW PLUS + True Negative *
STAR IS NOT ABOVE PLUS + False Negative (FN) *
The task, in its standard form, yields a number of reaction-time-based dependent variables. Carpenter and Just (1975) proposed the Constituent Comparison Model to account for individual reaction time data. This model assumes specific rules for
construction of propositional forms and the comparison process and claims that the time taken to decide whether the picture matched the sentence depends on the number of constituent comparisons in the stimulus sentence. True Affirmative (TA) pairs contain K constituent comparisons, False Affirmative (FA) contain K+1, True Negative (TN) involve K+5, and False Negative (FN) involve K+4 constituent comparisons (Carpenter & Just, 1975). The time taken to respond is a direct function of the number of constituent comparisons. A key component in the model is the conversion of the sentence and picture representations into a common format so that they are symbolically equivalent.
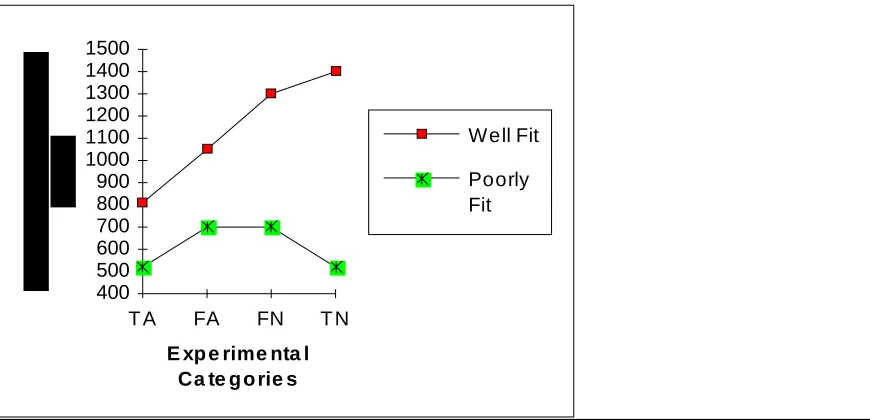
Originally, it was assumed that the conversion was to a linguistic format (Carpenter & Just, 1975). MacLeod, Hunt & Mathews (1978) and Mathews, Hunt, & MacLeod (1980), however, demonstrated that this was not necessarily the case and that some subjects use a linguistic code as the basis for comparison whereas others use a pictorial code. Reliable differences in reaction times can distinguish between individuals who prefer to form imaginal or propositional representations of the information conveyed in the sentence. This is shown clearly in Figure 1.
E xp e rime nta l Ca te g o rie s
400 500 600 700 800 900 1000 1100 1200 1300 1400 1500
T A FA FN T N
Well Fit
[image:5.595.91.526.335.545.2]Poorly Fit
Figure 1. Response Time as a Function of Different Conditions in the SVT for Linguistic (Well-Fit) and Visual (Poorly-Fit) Groups. From Matthews et al. (1980).
Matthews et al. (1980) argued that their well-fit group used the linguistic strategy and that the plot of their mean verification response times in the different conditions of the SVT matched almost exactly the plot one would expect on the basis of the constituent comparison model (K, K+1, K+4, K+5). The poorly-fit group, on the other hand,
strategy. A high correlation between the experimental conditions and the K, K+1, K+1, K model, on the other hand, indicates that the subject is following a visual strategy. The technique basically involves checking to see how well the plot of each subject’s mean verification response times in the four experimental conditions displays a linear or a quadratic trend (e.g. Marquer & Pereira, 1990).
Hunt and his co-workers also showed that although most subjects can change their representational strategy in response to instructions, individuals have a preferred strategy and this can be detected by plotting their mean response times in the different conditions of the SVT. Hunt (1978) argued that the preference is shaped by background strengths in verbal and spatial abilities. That is, we develop characteristic ways of thinking which accentuate our cognitive capabilities. Coney (1988) followed the research line of Hunt and his colleagues and also found that spatial ability was the most significant determinant of strategy selection for SVT performance. Typically, high verbal ability subjects and low spatial subjects chose a linguistic strategy whilst those with high spatial ability tended to adopt a pictorial strategy (Coney, 1988; MacLeod et al., 1978; Mathews et al., 1980). Coney (1988) also confirmed an earlier finding by Tversky (1975) that a pictorial strategy is more likely to be followed as the interval between presentation of sentence and picture is increased.
Despite the interest in modes of processing, and what seems to be a variety of ways of measuring individual tendencies, the fact is that the measurement of preference is something of a problem. Many researchers have acknowledged the need for an acceptable instrument for assessing modality preference (eg. Moore, 1986; Evans, 1990; Marquer, 1990) but seem unsure of the direction to take. The two main options appear to rest with the use of processing-time measures derived from experimental tasks on the one hand and self report measures on the other. Aylwin (1985) clearly favoured the self-report
technique, arguing that language is a viable means of expressing the content of thought. Marquer and Pereira (1990) found contradictions between the results obtained from chronometric data and those based on verbal protocols. They supported the use of verbal protocols but felt that experimental tasks where measures of processing time formed the dependent variable should be used as a validity check. Evans (1989, 1990) was more critical of the use of verbal reports, citing their troubled history in psychological research.
An interesting aspect of the research literature in this area is that it has generated three quite different techniques for measuring what is essentially the same psychological construct. The Paivio and Richardson group use self-report questionnaires, Aylwin uses a projective technique based upon free association, and, finally, Hunt and co-workers use processing-time measures. All three groups also made the claim that processing
Method
Participants
A total of 156 subjects were used in this study. Of these, 110 were recruited from the surrounding community in a middle-sized town in Queensland, Australia. The remaining 46 were third year Psychology students at the University of Southern Queensland who participated to obtain course credit. Overall, there were 100 females and 56 males, with an overall mean age of 26.25 years. The mean age of the females was 25.29 years, with an age range from 17 to 56 years. The males had a mean age of 27.96 years, with an age range from 17 to 57 years.
Materials
Verbaliser-Visualiser Questionnaire
Richardson's (1977) Verbaliser-Visualiser Questionnaire (VVQ) measures an individual's preference for verbal or visual coding forms. It consists of 15 true-false items from Paivio's (1971) Ways of Thinking questionnaire (WOT). A typical item for verbal preference looks like this: “I enjoy doing work that requires the use of words”; and a typical item for assessing visual preference: “My dreams are extremely vivid”. The scale is usually scored as though it measured visual preference. Thus, a “true” response to the verbal preference item shown above would be scored as 0 whilst a “false” response would be scored as 1. A true response to a visual preference item, on the other hand, would be scored as 1 and a false response as 0. This results in a single total score indicative of preference for visual processing. Richardson reported a test-retest coefficient of .91 and an internal consistency estimate of .54 for this scale. An alternative method of scoring involves treating the two scales as independent. Internal consistency estimates are improved when this method is used (Childers, Houston & Heckler, 1985) and there is strong empirical evidence that it reflects better the underlying structure of the VVQ (McGrath et al., 1989; Boswell & Pickett, 1991). This was the approach adopted in this study. Separate total scores were obtained for the verbal (Vvqsay) and the visual (Vvqsee) items.
Modes of Thought Questionnaire
Aylwin's (1985) Modes of Thought Questionnaire (MOTQ) was used as a projective measure of an individual's representational bias. The MOTQ consisted of 170 stimulus-response pairs where a stimulus word was presented and the subjects asked to do one of three things: a) to say the word to themselves; b) to form a mental image of the object named by the word; or c) to imagine themselves being whatever was indicated by the word. After a short pause, a response word was presented and the subject was asked to rate the likelihood of that particular response word coming to mind. The rating scale was as follows:
(1) no likelihood - wouldn't have thought of the second word at all if it hadn't been suggested;
(2) unlikely - but it would perhaps come along in the end;
(3) eventually - not immediate but it would come along after some thought; (4) likely - it would be in the first few ideas;
(5) certain - it would be the first idea that would come to mind. A typical item for the “See” scale looked like this:
where the subject tried to form a picture in his/her mind's eye of a “train”, allow for any associated words/ideas to come to mind and then to rate “station” for its likelihood of being among them. The rating scale ranged from 1, indicating no likelihood, to 5,
indicating certainty of the association being formed. Scores on the different types of items were added to yield three separate scale scores. The first scale (Mtqsay) reflects the individual’s tendency to use verbal encoding, the second scale (Mtqsee) reflects a
tendency for visual encoding, and the third scale (Mtqbe) is indicative of an enactive form of encoding. Only the first two were of interest to this study and although Mtqbe scores were calculated, they were not used in any of the analyses. Some example items of each scale are included as an appendix to this paper.
Because the MOTQ had not been validated in an Australian context, it was first trialled on 34 third year Psychology students. As a consequence, ten items were altered. Most of these changes had to do with the substitution of familiar stimulus words for unfamiliar words (eg. “tap” to replace “faucet”). Data from these 34 subjects were not included in the final data set.
Sentence Verification Task
The sentence-picture verification task (SVT) as developed by Clark and Chase (1972), was used as a chronometric basis for assessing processing strategy choice. The stimuli for the SVT were identical to those used in the study conducted by MacLeod et al (1978) and consisted of repetitions of 16 sentence-picture pairs shown earlier. Each of these pairs was presented at random in five separate blocks, giving a total of 80 trials altogether; a much smaller number than used by MacLeod et al.. Prior to testing, there were 20 practice trials. The task was computer-based. After presentation of the
instructions and practice items, the first sentence appeared on the screen. Subjects read the sentence, pressed a key to indicate that they comprehended the sentence, studied the picture which then appeared on the screen, and pressed either the “T” (true) or “F” (false) key to indicate the truth status of the original sentence. The SVT instructions were based on those of the MacLeod et al. (1978) study where the importance of being accurate was stressed but no attempt was made to influence the strategy used by the subjects. That is, subjects were simply told to read the sentence, press the key when they were ready for the picture, and press the response key to verify the sentence. A lot of data can be gathered in this task. Accuracy data is typically used only as a validation check. Subjects with high error rates are usually discarded on the assumption that, since the task is easy, they have somehow misunderstood the nature of the task or failed to follow instructions. A 10% cutoff was used in this study. Overall comprehension and verification times were
collected for all conditions (TA, FA, FN, TN). The most important measures derived from this task were the two fit indices: the first a measure of how well each subject’s data fitted the linguisitic processing model (Svtsay); the second a measure of how well the data fitted the visual processing model (Svtsee). Following the approach used by MacLeod et al. (1978) and Mathews et al. (1980), these measures were obtained by simply correlating response times in each condition with the hypothesised number of constituent
Psychometric Measures
The Verbal Reasoning and Space Relations tests from the Differential Aptitude Test (DAT) series (Bennett, Seashore & Wesman, 1989) were administered to measure individual differences in verbal and spatial ability, respectively. Both scales have reliability estimates in the .85 to .90 range and are supported by a large number of validation studies (Bennett et al., 1989). The Verbal Reasoning (Datvr) tests employs a verbal analogies item format and contains 50 items. The Space Relations test (Datsr) contains 60 items that require manipulation of objects in three-dimensional space.
Procedure
MOTQ forms were given to subjects and they were taken through the practice items to ensure task demands on each of the SEE, SAY and BE items were clearly understood. This involved familiarising subjects with the likert-type rating scale provided. They were then asked to take the form home and complete it before attending the SVT testing session which took place within three weeks. Testing for the SVT was conducted on IBM compatible personal computers at the University of Southern Queensland (USQ) over a two-month period. After completion of the MOTQ and SVT testing, all subjects were administered the DAT scales and the VVQ in group testing sessions1. There were between five and thirty people present at each testing session, held over a one week period at the university or in a controlled testing environment. Total testing time was approximately one hour.
Statistical Analyses
The instruments used in this study were quite different in format and the scores derived from each had to be reduced to a common metric before comparisons were possible. For this reason, the analyses for each instrument were treated separately, at least up to the point where scores were compared. The purpose of this stage of the analysis was to establish the validity of the data obtained with each instrument. In most cases this was done by comparing data obtained in this study with that obtained in previous validation studies. The second stage of analyses employed correlational and both exploratory and confirmatory factor analyses to check the underlying structure of the whole test battery.
Results
Sentence Verification Task (SVT)
One hundred and ten participants completed the SVT2. Although it is possible to analyse both time and accuracy data from the SVT, it is more common to focus on time measures and to delete subjects who have made a certain proportion of errors. In this study, all subjects with an overall error rate higher than 10% were excluded, leaving 104 subjects in the SVT data set. The mean error rate for these remaining subjects was 5.55%. Preliminary analysis of the SVT data showed that many of the usual effects noted with the SVT task were also present here. The list is actually quite lengthy, so we will mention just a few of the more important replications associated with the verification times (VRT). A within subjects two-way ANOVA was conducted on VRT’s with true-false and
last finding was not predicted by the Carpenter and Just (1985) constituent comparision model but it does correspond with the findings of MacLeod et al. (1978). The median correlation between verification response times in the four experimental conditions and the constituent comparisons corresponding with the linguistic model was quite high (r = .85) but coefficients ranged from 1.00 to -.67 across the 104 subjects. This suggested that the pattern of VRT’s for some subjects did not correspond with the predictions of the constituent comparison model. A second correlational analysis was carried out to measure the goodness of fit to the quadratic model. The constituent comparisons for this model were K, K+1, K+1, and K. Thus, the analysis of the SVT data resulted in two scores for comparison with other measures. The first (Svtsay) indicated how well the subject’s data fitted the verbal processing model, the second (Svtsee) indicated how well the data fitted the visual processing model. As a check against the results obtained by Mathews et al. (1980), two extreme groups were formed by taking those whose Svtsay scores were above .90 (N = 21) and those whose Svtsee scores were above .90 (N = 14). When plotted, the results shown in Figure 1 were replicated almost perfectly. In addition, the group
identified as fitting the visual processing model had a significantly higher mean score on the Space Relations test. There were no differences between the groups on Verbal Reasoning.
As a final check on the validity of the SVT data, mean verification and
comprehension times were correlated with the DAT verbal and spatial measures (Datvr and Datsr). Verbal ability is important in both stages of the task for some of the subjects. They form a linguistic representation of the sentence and do the same for the picture. Verbal ability was significantly related to both comprehension and verification response times (-.27 and -.38, p<.01). That is, people who had high verbal ability took less time to respond. Spatial ability is important for another group of subjects but mostly in the verification stage where they match the mental and physical images. In the present study, spatial ability was unrelated to comprehension time but was significantly related to verification time (-.19 and -.56).
Modes of Thought Questionnaire (MOTQ)
It is possible to obtain a range of sub-scale scores from the MOTQ but the most important for the purposes of this study were the scores on the two broad scales Mtqsay and Mtqsee. The Mtqbe scale was not relevant for the purposes of this study, which is concerned only with visualising and verbalising tendencies, and was not included in the following analyses. A high score on the Mtqsay scale indicated that subjects tended to make linguistic associations quite easily. A high score on the Mtqsee scale indicated that they formed imaginal associations. Rather than report total scores on these two scales, the average rating for the Mtqsay and Mtqsee scales are shown in Table 1.
Verbaliser-Visualiser Questionnaire (VVQ)
The seven items which assessed liking for verbal material in the VVQ were added to form a “Vvqverb” scale. The internal consistency reliability estimate for this scale (Cronbach’s alpha) was .57. The eight items assessing liking for visual material were added to form a “Vvqvis” scale. The reliability estimate for this scale was .63. These internal consistency estimates are very similar to those reported by Childers, Houston, & Heckler (1985) who gave figures of .66 for Vvqsay and .64 for Vvqsee. In the present study, of the seven items in the VVQverb scale, all but item 10 made some contribution to the reliability. In the case of the VVQvis scale, all but items 8 and 9 made some
either of the factors identified in the McGrath et al. study. The evidence from both studies, however, suggested that these items do not work against the rest of the scale. Rather, it appears that they have weak loadings on their respective factors (McGrath et al., 1989) and are weakly correlated with total scale scores (present study). Therefore, we retained these items in all analyses involving the VVQ. It should be noted, however, that the internal consistency estimates for the scales were rather low.
Combined Analyses
The combined analyses were conducted on the data generated by the 104 participants - 65 females, 39 males - who completed all tasks. The outcome of the separate analyses with individual assessment devices was a set of eight measures, four measuring verbal preference and four measuring visual preference. The MOTQ
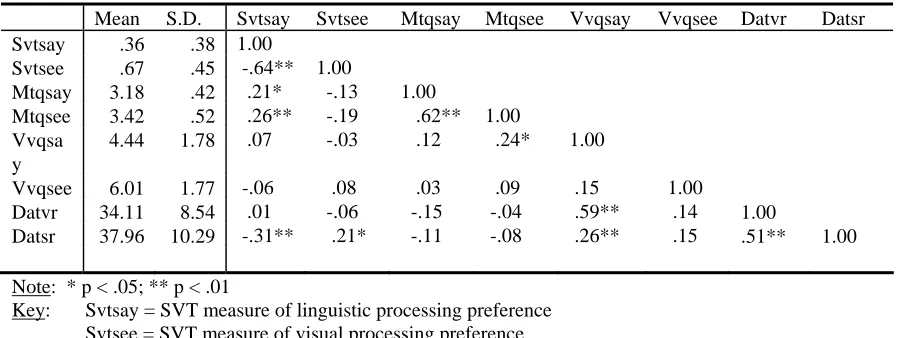
[image:11.595.84.533.414.583.2]contributed two measures of processing preference: Mtqsay and Mtqsee, obtained from their ratings of the likelihood of visual and verbal images coming to mind. The SVT contributed two measures: Svtverb, which measured the extent to which individual plots of mean response times under the four conditions of the SVT reflected a linear trend, and Svtvis, which measured the extent to which the plots reflected a quadratic trend. The VVQ also yielded two measures of processing preference: Vvqverb and Vvqvis, obtained from the items measuring these separate tendencies. Finally, the DAT yielded a measure of verbal ability, designated Datvr, and a measure of spatial ability, designated Datsr. Descriptive statistics and correlations for all eight measures are shown in Table 1.
Table 1
Descriptive Statistics And Correlations Among All “Preference” Variables (N=104)
Mean S.D. Svtsay Svtsee Mtqsay Mtqsee Vvqsay Vvqsee Datvr Datsr Svtsay .36 .38 1.00
Svtsee .67 .45 -.64** 1.00
Mtqsay 3.18 .42 .21* -.13 1.00
Mtqsee 3.42 .52 .26** -.19 .62** 1.00 Vvqsa
y
4.44 1.78 .07 -.03 .12 .24* 1.00
Vvqsee 6.01 1.77 -.06 .08 .03 .09 .15 1.00
Datvr 34.11 8.54 .01 -.06 -.15 -.04 .59** .14 1.00 Datsr 37.96 10.29 -.31** .21* -.11 -.08 .26** .15 .51** 1.00
Note: * p < .05; ** p < .01
Key: Svtsay = SVT measure of linguistic processing preference Svtsee = SVT measure of visual processing preference Mtqsay = MOTQ measure of verbal processing preference Mtqsee = MOTQ measure of visual processing preference Vvqsay = VVQ measure of verbal processing preference Vvqsee = VVQ measure of visual processing preference Datvr = Verbal Reasoning test from the DAT
Datsr = Space Relations test from the DAT
norms are available. Although an effort was made to recruit subjects from outside the university environment, the sample would have to be described as young and quite intelligent. The mean score on the Datvr (34.11) places the sample in the top 20% of the Australian population for verbal reasoning whilst the mean score on Datsr (37.96) places them in the lower 50% for spatial ability (Bennett et al., 1989). The sample is best described as high verbal and low spatial. Turning to the correlational data, it can be seen that there is not high agreement among the measures. The -.31 (p < .01) correlation between Datsr and Svtsay suggests that people with low spatial ability tend to prefer linguistic representations. This was in line with our expectations, as was the positive correlation between Datsr and Svtsee (.21, p<.05). The .59 correlation (p < .01) between Datvr and Vvqsay was also in line with expectations. Otherwise, there was little evidence in the correlation matrix itself that the variables were measuring two underlying
dimensions. With the exception of the correlation between Datsr and Svtsee, the highest correlations were between measures from the same test.
Before proceeding with the testing of structural models underlying this correlation matrix, the issue of gender differences was explored. This was done by splitting the sample into male and female sections and using the multi-sample comparison procedures described in LISREL8 (Joreskog & Sorbom, 1993) to test for equality in the correlation matrices developed from the two sections. The test was not significant with Chi Square equal to 35.1 (df = 36, p = .516), indicating that there is no reason to treat the
correlational data for the genders differently. The correlation matrix shown in Table 1 was therefore used in the analyses which follow.
Table 2
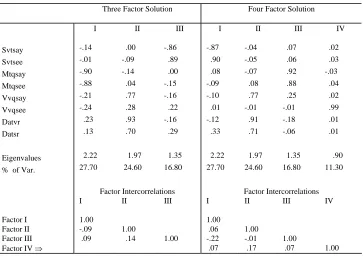
Pattern Matrices for Principal Components Analysis of All Eight Measures Three Factor Solution Four Factor Solution I II III I II III IV
Svtsay -.14 .00 -.86 -.87 -.04 .07 .02
Svtsee -.01 -.09 .89 .90 -.05 .06 .03
Mtqsay -.90 -.14 .00 .08 -.07 .92 -.03
Mtqsee -.88 .04 -.15 -.09 .08 .88 .04
Vvqsay -.21 .77 -.16 -.10 .77 .25 .02
Vvqsee -.24 .28 .22 .01 -.01 -.01 .99
Datvr .23 .93 -.16 -.12 .91 -.18 .01
Datsr .13 .70 .29 .33 .71 -.06 .01
Eigenvalues 2.22 1.97 1.35 2.22 1.97 1.35 .90 % of Var. 27.70 24.60 16.80 27.70 24.60 16.80 11.30
Factor Intercorrelations Factor Intercorrelations I II III I II III IV Factor I 1.00 1.00
Factor II -.09 1.00 .06 1.00
Factor III .09 .14 1.00 -.22 -.01 1.00
Factor IV ⇒ .07 .17 .07 1.00 Note: Loadings above .29 underlined.
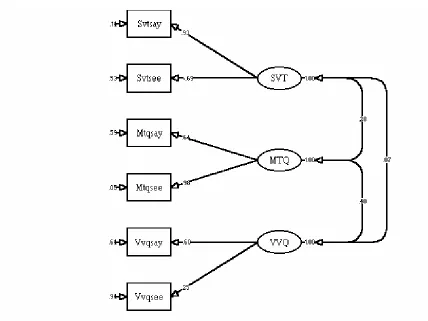
It can be seen from Table 2 that there is a strong tendency for measures from the same instrument to define the same dimension and there is little overall evidence of two underlying dimensions corresponding to verbalising and visualising tendencies. The three and four factor solutions are extremely similar with the extra fourth factor picking up some of the variance associated with the Vvqsee variable. To provide a stronger test of the hypothesis that measures of verbal and visual processing preference tap the same latent traits, the LISREL8 statistical package (Joreskog & Sorbom, 1993) was used to test a model incorporating two correlated latent traits. The structural model was very
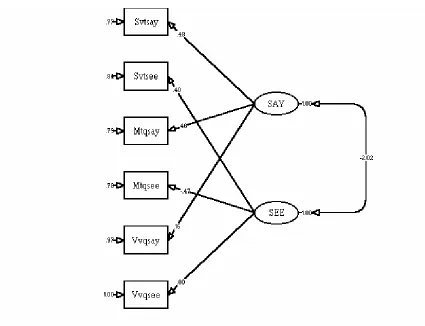
Figure 2. Structural Model Emphasising the Role of Trait Variance. --
Figure 3. Structural Model Emphasising the Role of Method Variance.
This time, the fit was satisfactory with a Chi Square of 1.92 (df = 6, p = .93). This model clearly gives a better account of the relations among these measures than the first model. A third logical step in the analysis would have been a test of a model that allowed both trait and method variance. The ratio of indicator variables to hypothesised latent traits would not permit this test in the present case, so the relative contributions of trait and method variance are best judged by the two analyses reported above.
Despite the evidence that these measures of processing preference had little in common, the relation of each with the ability measures was still of interest. The exploratory factor analysis suggested that Datsr had something in common with SVT measures and that Datvr shared variance with Vvqsay. For the most part, however, the ability measures appeared to show the same tendency as the other measures used in this study. That is, they had more in common with one another than with other variables in the battery. A third structural model was proposed which was identical to the second except in that Datvr and Datsr were added as indicators of a fourth latent trait. The fit to this model was acceptable with a Chi Square value of 20.28 (df = 14, p = .12). Adding a path from SVT to Datsr increased the fit significantly with Chi Square now equal to 13.78 (df = 13, p = .95).
Discussion
A Comment on Each of the Measures
been used in this country before, prior to the commencement of this study it was trialled on a separate group of 34 subjects and some items were substituted. Deletion of items with low item-total correlations in the present study left three scales with approximately 30 items each, all of which had high internal consistency reliability estimates (> .90). Apart from these changes, test administration procedures described in Aylwin (1985) were followed and there is no reason to suspect that test adaptations or administration procedures had any influence on the outcome of this study.
One of the important findings to emerge in connection with the MOTQ was the observation of a high correlation between the MOTQ verbal and visual scales. People who reported finding it easy to form verbal associations also reported finding it easy to form visual associations. That is, when asked whether they would have thought of a certain word in response to the stimulus word, they tended to rate the probability of the association highly regardless of whether a linguistic or an imaginal association was involved. This would argue against the notion of processing preferences for most of the subjects. A possible explanation is that response bias was operating and that subjects displayed a tendency to agree with the rating question regardless of whether the item was visual or verbal. In order to control for possible response sets associated with the use of the rating procedures, raw data were transformed using a procedure recommended by Bond (1988). This involved converting each subject's ratings for all items to standard scores based on that subject's distribution of ratings. Mean standardised item ratings were then obtained for the Mtqverb and Mtqvis items. Transforming the data in this fashion, however, had no effect on the relations between the MOTQ scales and the other tests in the battery. The only tangible outcome was an unavoidable negative correlation between Mtqverb and Mtqvis brought about by the now ipsative nature of the scale. There is another way of controlling for this type of response bias in the MOTQ. The instrument contains a “Cross-modal” scale that can be used to partial out response bias. Controlling for the Cross-modal score, however, left the correlation between Mtqsay and Mtqsee unchanged in the present study.
It is concluded, therefore, that the MOTQ relations obtained in the present study were quite reliable. As part of the validation process, Aylwin (1985) reported correlations between the verbal and visual scales and measures of verbal and spatial ability. In fact, these correlations were not robust in Aylwin’s original work and there is no evidence in the present study that the MOTQ verbal and visual scales are related in a systematic way to verbal and visual abilities3. Similarly, there is little evidence that they are related in a systematic way to the other supposed measures of processing preferences used in this study. Discussion of these overall trends, however, is deferred for the time being.
The Vvqverb and Vvqvis scales fared little better than the MOTQ scales. Although there was evidence that people with high verbal abilities reported favouring a verbal strategy, there was no corresponding link between visual abilities and preference for imaginal processing. A possible criticism of the treatment of the VVQ in the present study is that two independent scales were obtained rather than the single bipolar scale used by Richardson (1977). The two-scale interpretation was adopted following the study by McGrath et al. (1989) indicating that this was the proper structure of the VVQ.
The SVT can be administered in a variety of ways. The mode used here could best be characterised as a cut-down version of the free strategy condition (Mathews et al., 1980). The analyses conducted on the Comprehension and Verification parts of the SVT under the different conditions (TA, FA, FN, TN) suggest that all of the usual effects have been obtained implying, again, that there is nothing unusual about the way we used this task. One notable departure from the method employed by Mathews et al. (1980),
however, concerned the generation of two measures of fit: one to measure a tendency to employ a linguistic strategy (Linear), the other measuring a tendency to employ a visual strategy (Quadratic). The alternative was to use a single bipolar measure of fit as an index of verbalising-visualising tendency. The two-measure approach was necessary because the lack of a high correlation with the linear trend model did not necessarily indicate a quadratic fit; any departure from the linear model reduced the correlation coefficient. High correlations with the quadratic model, on the other hand, indicated that subjects were using a strategy that produced the same shaped curve as MacLeod et al. described for the visualising group. Without going into a debate over the relative merits of the two approaches, suffice it to say that once again it made no difference. We reported the correlations with Linear (Svtsay) and Quadratic (Svtsee) measures but also calculated a single measure of fit and retained it until the final stages of analysis. The results were the same so we reported the independent scales solution, which we favour. The one major weakness of the SVT measures - one which could not have been avoided by resorting to a single index of fit - was that subjects who recoded negatively-worded statements into affirmative statements before moving to the verification stage of the task produced response time curves that are identical to those supposedly reported by visualisers
(Mathews et al. ,1980; Marquer & Pereira, 1990). This contaminates the Svtsee measure. As far as we can tell, however, the Svtsay measure should still have indicated a
preference for verbal processing.
There is little to be said about the DAT Verbal Reasoning and Space Relations tests. These two tests were not designed to measure processing preference but it has been claimed that the best predictors of verbal and visual encoding preferences are tests of verbal and spatial ability (e.g. Mathews et al., 1980). Hence their inclusion in this study. They were adminstered according to the instructions in the manual. Although employing different content, both tests can be used as measures of reasoning ability. The correlation between the two tests (.54, p < .01) was very close to the value reported in the manual (.56). Again, there is every reason to believe that the data obtained with these two measures were quite reliable and in line with expectations.
Relations Among the Scales
The major finding to emerge in this study was that these measures did not define two factors corresponding to verbal and visual processing preference. The exploratory factor analytic solutions suggested that method rather than trait variance was the prime reason for correlations among these variables. There was some evidence of trait variance but it was relatively minor and in line with expectations. The variable Vvqsay, for
with a measure of verbal reasoning. The visual items from the VVQ (Vvqvis) did not correlate with any other scale used in this study. If, as suggested by Childers et al. (1985), these items tap some ability dimension, then that ability dimension was not strongly represented here. A further question that must be considered in relation to the VVQ is whether the scale should be treated as unidimensional with a high score indicating visual preference and a low score verbal preference, or whether it is best treated as a composite of two separate scales, as done here. The first point that we would make is that it does not affect the outcomes of this study. Although not reported, when the VVQ was scored as a single, unidimensional scale, it correlated with Datvr (.26) and nothing else. The second point is that factor analyses failed to find any evidence for the argument that this scale is unidimensional. Thus, it is unlikely that the VVQ measures processing preference,
regardless of whether the scale is treated as unidimensional or two-dimensionsal. In other work presently in progress (Burton and Fogarty, unpublished), it appears that these items tap aspects of imagery and verbal abilities as well as higher-order intelligence constructs.
The MOTQ does not fare any better. Internal consistency estimates for the Mtqverb and Mtqvis were high but it is not clear what the MOTQ measures other than a self-rated ability to form associations, both verbal and visual. The free association technique employed in the MOTQ does have a certain degree of plausibility. It is indeed probable that people with a preference for visual processing might well demonstrate a tendency to form visual associations whilst people with a verbal processing preference might form linguistic assocations, but the MOTQ does not appear to capture this tendency. One possible problem is the actual format of each item wherein the subject is presented with the association and asked to rate its likelihood. Perhaps people end up judging the “goodness” of the association, rather than its probability of occurrence for them. Our own impression when administering this questionnaire is that it might be better to provide the stimulus word and allow the subject to offer the response word, although this would introduce word frequency effects. Aylwin (1977) used this technique to begin with but later abandoned it in favour of the current format.
the possibility that the plots of response times - especially the quadratic trend - are not necessarily indicative of a particular strategy (Marquer & Pereira, 1980).
Conclusion
The findings of this study do not challenge the dual code theory proposed by Paivio, nor even the notion that there are strong individual differences in preference for a verbal or visual form of encoding. What they do is raise doubts about some instruments which have been claimed to be measures of processing preference. An ideal outcome in the present study would have been the demonstration of convergent validity within the set of measures of verbalising preference, a similar finding for the visual measures, and clear associations with verbal and spatial abilities. Had even two of the three measures
converged, the way forward would be a little clearer. That was not the case and we must face the possibility that we are still a long way from being able to operationalise the construct of processing preference. The evidence of the present study is compelling: when looked at individually, each instrument behaved in a consistent way, returning
psychometric and experimental data that matched data generated by previous studies; when looked at together, the various instruments appear to have little in common and, despite previous claims, the links with underlying verbal and spatial abilities are tenuous. This was made quite apparent by the LISREL analyses where the best fitting model was one which made allowance only for sources of method variance. Exploratory factor analyses yielded similar findings. What these measures have in common is method - not trait -variance. This was the most important finding to emerge from the study.
There are undoubtedly factors which could have affected the validity of the study. A greater range of ability levels might have strengthened the correlations somewhat and the inclusion of introspective reports could have served as a validation check on response patterns assumed to indicate use of certain strategies. It is doubtful, however, that the results would have been altered in a dramatic way. The outcome of the present study is unlikely to have been forced by such issues. It is more probable that there are difficulties in the approach itself.
One possibility is that, as Ahsen (1984) and others (e.g., Aylwin, 1985; Bugelski, 1987) have claimed, two codes are not sufficient to represent the complexity and richness of cognitive encoding. If this is true, attempts to explain variance in processing
preferences in terms of just two underlying dimensions will always fail. One of the
measures used in the present study (MOTQ) did allow for a third (enactive) dimension but the enactive and visual scores were so highly correlated that the enactive scores were not used in further analyses. The high correlation, however, does not necessarily mean that the two constructs are identical. It may be that they are difficult to separate using
correlational methodology. Carroll (1993), in his mammoth analysis of the factor analytic literature on cognitive abilities, described styles as lying somewhere between abilities and strategies and observed that structural analyses of cognitive styles (he included the
verbaliser-visualiser dimension as one of these) have not been very successful over the years.
Ahsen’s approach to the question of processing preferences suggests one reason why this might be the case. For Ahsen, whether a person’s response is verbal or visual is not an issue of individual differences except that the same person who was verbal at one point may become image-oriented at another point. What appears as individual
any preferences they might have are weakly formed and very difficult to detect through standard measuring instruments. As Mathews et al. (1980) noted, we can all use verbal processing strategies and although high spatial people are certainly quicker to adopt a visual strategy when required to do so, we can probably all use visual strategies too. Perhaps the clue to progress in this area lies not in normative studies, such as we have pursued here, but in the detailed study of individuals who do not appear to be able to employ one or other of these encoding mechanisms or who appear to be extraordinarily slow in adapting to circumstances which require a switch in strategy.
References
Ahsen, A.A. (1984). ISM: The Triple Code Model for imagery and psychophysiology. Journal of Mental Imagery, 8(4), 15-42.
Bugelski, B.R. (1987). Open peer commentary on Image Psychology and the empirical method. Journal of Mental Imagery, 11(3&4), 39-43.
Aylwin, S. (1977). The structure of visual and kinaesthetic imagery: A free association study. British Journal of Psychology, 68, 353-360.
Aylwin, S. (1981). Types of relationship instantiated in verbal, visual and enactive imagery. Journal of Mental Imagery, 5(1), 67-84.
Aylwin, S. (1985). Structure in thought and feeling. New York: Methuen. Aylwin, S. (1990). Imagery and affect: big questions, little answers. In
P.J.Hampson, D.F. Marks, & J.T.E. Richardson (Eds.), Imagery: Current developments. London: Routledge
Bennett, G.K., Seashore, H.G., & Wesman, A.G. (1989). Australian manual for the Differential Aptitude Tests: Forms V and W. Australia: The Psychological Corporation.
Bond, M.H. (1988). Finding universal dimensions of individual variation in multicultural studies of values: The Rokeach and Chinese value survey. Journal of Personality and Social Psychology, 55 (6), 1009-1015.
Bruner, J.S. (1964). The course of cognitive growth. American Psychologist, 19, 1-15. Boswell, D.L., & Pickett, J.A. (1991). A study of the internal consistency and factor
structure of the Verbaliser-Visualiser Questionnaire. Journal of Mental Imagery, 15 (3&4), 33-36.
Carpenter, P.A., & Just, M.A. (1975). Sentence comprehension: A psycholinguistic processing model of verification. Psychological Review, 82, 45-73.
Carroll, J. (1993). Human cognitive abilities. Cambridge: Cambridge University Press. Childers, T.L., Houston, M.J., & Heckler, S.E. (1985). Measurement of individual
differences in visual versus verbal information processing. J. of Consumer Research, 12, 125-134.
Clark, H. H., & Chase, W.G. (1972). On the process of comparing sentences against pictures. Cognitive Psychology, 3, 472-517.
Coney, J. (1988). Individual differences and task format in sentence verification. Current Psychology: Research and Reviews, 7(2), 122-135.
Cooper, L. A. (1982). Strategies for visual comparison and representation: Individual differences. In R.J. Sternberg (Ed.), Advances in the psychology of human intelligence volume 1. Hillsdale, New Jersey: Lawrence Erlbaum.
Edwards, J.E., & Wilkins, W. (1981). Verbaliser-Visualiser Questionnaire: Relationship with imagery and verbal-visual ability. Journal of Mental Imagery, 5, 137-142. Ernest, C.H., & Paivio, A. (1971). Imagery and verbal associative latencies as a function
of imagery ability. Canadian Journal of Psychology, 25, 83-90.
Evans, J. St B.T. (1989). Bias in human reasoning: Causes and consequences. Hove & London: Lawrence Erlbaum Associates Ltd.
Evans, J. St B.T. (1990). Verbal reports of cognitive strategies: A note on Marquer and Pereira. The Quarterly Journal of Experimental Psychology, 42A(1), 169-170. Glusko, R.J., & Cooper, L.A. (1978). Spatial comprehension and comparison processes in
verification tasks. Cognitive Psychology, 10, 391-421.
Hunt, E. (1978). Mechanics of verbal ability. Psychological Review, 85 (2), 109-130. Hunt, E. (1980). Intelligence as an information-processing concept. British Journal of
Psychology, 71, 449-474.
Joreskog, K. G., & Sorbom, D. (1993). LISREL 8: Structural equation modeling with the SIMPLIS command language. Chicago: Scientific Software.
Katz, A.N. (1987). Individual differences in the control of imagery processing: Knowing how, knowing when, and knowing self. In M.A. McDaniel & M. Pressley (Eds.), Imagery and related mnemonic processes: Theories, individual differences, and
applications. New York: Springer-Verlag, 1987.
MacLeod, C.M., Hunt, E.B., & Mathews, N.N. (1978). Individual differences in the verification of sentence-picture relationships. Journal of Verbal Learning and Verbal Behaviour, 17, 493-507.
Marquer, J. (1990). Reaction times and verbal reports in the study of cognitive
strategies: A reply to Evans. The Quarterly Journal of Experimental Psychology, 42A(1), 171-172.
Marquer, J., & Pereira, M. (1990). Reaction times in the study of strategies in sentence-picture verification: A reconsideration. The Quarterly Journal of Experimental Psychology, 42A(1), 147-168.
Mathews, N.N., Hunt, E.B., & MacLeod, C.M. (1980). Strategy choice and strategy training in sentence-picture verification. J. of Verbal Learning and Verbal Behaviour, 19, 531-548.
McGrath, R.E., O'Malley, W.B., Dura, J.R., & Beaulieu, C. (1989). Factor analysis of the verbaliser-visualiser questionnaire. Journal of Mental Imagery, 13(1), 75-78. Moore, D.K. (1986). Modality preference: Prediction via the visual aural digit span test?
Journal of Psychoeducational Assessment, 4, 263-272.
Paivio, A. (1971). Imagery and verbal processes. New York: Holt, Rhinehart, & Winston. Paivio, A., & Harshman, R. (1983). Factor analysis of a questionnaire on imagery and
verbal habits and skills. Canadian Journal of Psychology, 37, 461-483.
Parrott, C.A. (1986). Validation report on the verbaliser-visualiser questionnaire. Journal of Mental Imagery, 10(4), 39-42.
Richardson, A. (1977). Verbaliser-Visualiser: A cognitive style dimension. Journal of Mental Imagery, 1, 109-126.
Richardson, A. (1983). Imagery: Definition and types. In A.A. Sheikh (Ed.), Imagery: Current theory, research and application. New York: John Wiley & Sons, 1983. Sullivan, G.L., & Macklin, M.C. (1986). Some psychometric properties of two scales for
the measurement of verbaliser-visualiser differences in cognitive style. Journal of Mental Imagery, 10(4), 75-86.
Young, R.M. (1978). Strategies and the structure of a cognitive skill. In G. Underwood (Ed.), Strategies in information processing. London: Academic Press.
Appendix
The following are example items from Aylwin’s (1985) Modes of Thought Questionnaire (MOTQ) in each of the three different modes of representation.
Verbal Subscales Basis for Association
say WIDE --- narrow (Opposite)
say SCARLET --- fever (Phrase Completion)
say REGAL --- legal (Rhyme)
say ALUMINIUM --- metal (Superordinate)
Visual Subscales
see BOAT --- harbour (Environment)
see HANDKERCHIEF ---square (Attribute)
see PENSIONER --- strolling (Intransitive Action)
see KETTLE ---spout (Part)
Enactive Subscales
be DESTROYING --- gone (Consequence)
be GREEDY --- tummy ache (Affective Consequence)
be TELEPHONIST --- curious (Affective)
be LEOPARD --- catches gazelle (Transitive Action) be SECRETARY --- could kick boss (Conditional Action)
The modified version of Aylwin's MOTQ is available on request from the authors.
1
A different procedure was followed for the 46 third year Psychology students - who were visiting the campus for a residential school. These students completed the DAT, VVQ, and MOTQ forms in one sitting but were unable to complete the SVT. Thus, complete data were available for only 110 participants.
2
The 46 third year Psychology students were not able to attend the individual testing sessions - see earlier footnote.
3
In Aylwin’s validation studies, the enactive scale - which was not analysed in the present study of verbal and visual tendencies - had the highest correlation with psychometric variables.
4