A
A
N
N
A
A
L
L
Y
Y
T
T
I
I
C
C
A
A
L
L
M
M
E
E
T
T
H
H
O
O
D
D
D
D
E
E
V
V
E
E
L
L
O
O
P
P
M
M
E
E
N
N
T
T
A
A
N
N
D
D
V
V
A
A
L
L
I
I
D
D
A
A
T
T
I
I
O
O
N
N
O
O
F
F
D
D
E
E
X
X
K
K
E
E
T
T
O
O
P
P
R
R
O
O
F
F
E
E
N
N
T
T
A
A
B
B
L
L
E
E
T
T
S
S
B
B
Y
Y
R
R
P
P
-
-
H
H
P
P
L
L
C
C
D issertation submitted toTHE TAMILNADU Dr.M.G.R MEDICAL UNIVERSITY,
CHENNAI
I n partial fulfillment for the requirement for the award of the degree of MASTER OF PHARMACY
IN
PHARMACEUTICAL ANALYSIS
Submitted by [Reg. No. 261330352]
U nder the guidance of
Dr.M.PALANIVELU,M.Pharm,Ph.D.,
PRINCIPAL, Dept of Pharmaceutical analysis
Arulmigu Kalasalingam College of Pharmacy,
Anand Nagar, Krishnankoil – 626 126,
Tamilnadu,
CERTIFICATE
Dr.M.PALANIVELU,M.Pharm,Ph.D., PRINCIPAL,
Dept.of Pharmaceutical Analysis, A.K.College of Pharmacy,
Krishnankoil – 626 126.
This is to certify that the investigation described in the dissertation entitled “ANALYTICAL METHOD DEVELOPMENT AND VALIDATION OF DEXKETOPROFEN IN TABLET DOSAGE FORM BY RP-HPLC” submitted by Reg.No:261330352 was carried out in the Department of Pharmaceutical Analysis, Arulmigu Kalasalingam College of Pharmacy, Anand Nagar, Krishnankoil. which is affiliated to The Tamil Nadu Dr. M.G.R. Medical University, Chennai, under my supervision and guidance for the partial fulfillment of degree of MASTER OF PHARMACY in PHARMACEUTICAL ANALYSIS.
Date: Dr.M.PALANIVELU,M.Pharm,Ph.D.,
Place:Krishnankoil PRINCIPAL, [GUIDE]
Dept. of Pharmaceutical Analysis
CERTIFICATE
Dr.M.PALANIVELU,M.Pharm,Ph.D., PRINCIPAL,
A.K.College of Pharmacy, Krishnankoil – 626 126
This is to certify that the investigation described in the dissertation entitled “ANALYTICAL METHOD DEVELOPMENT AND VALIDATION OF DEXKETOPROFEN IN TABLET DOSAGE FORM BY RP-HPLC” submitted by Reg.No:261330352 was carried out in the Department of Pharmaceutical Analysis, Arulmigu Kalasalingam College of Pharmacy, Anand Nagar, Krishnankoil-626 126,
which is affiliated to The Tamil Nadu Dr. M.G.R. Medical University, Chennai, under the supervision and guidance of Dr.M.PALANIVELU,M.Pharm,Ph.D., principal, Dept of Pharmaceutical Analysis for the partial fulfillment of degree of MASTER OF PHARMACY in PHARMACEUTICAL ANALYSIS.
CERTIFICATE
This is a bonafide dissertation entitled AANNAALLYYTTIICCAALL MMEETTHHOODD D
DEEVVEELLOOPPMMEENNTT AANNDD VVAALLIIDDAATTIIOONN OOFF DDEEXXKKEETTOOPPRROOFFEENN IINN TTAABBLLEETT D
DOOSSSSAAGGEE FFOORRMM BBYY RRPP--HHPPLLCC done by (Reg.NO:261330352). The work mentioned in this dissertation was done in the Department of analysis in ARULMIGU KALASALINGAM COLLEGE OF PHARMACY, Anand Nagar, Krishnankoil under the supervision and guidance of Dr.M.PALANIVELU,M.Pharm,Ph.D., principal Department of Pharmaceutical analysis.
EXAMINERS:
1.
Affectionately
dedicated to
My beloved
Acknowledgement
“Success is how high you bounce when you hit bottom”
“If you can dream it, you can do it
”
The completion of my M. Pharmacy is not only fulfillment of my
dreams but also the dreams of my parents who have taken lots of pain for
me in completion of my higher studies. I solicit my deep sense of
appreciation and love to my wonderful parents and consider my
self-privilege to have seen an entity of almighty in them.
It is fathomless gratitude that I express my benevolent thanks to my
reverend guide
Dr.M.PALANIVELU,M.Pharm,Ph.D,
Principal, Dept.
of Pharmaceutical Analysis, Arulmigu Kalsalingam college of Pharmacy,
Krishnankovil. Not only giving excellent guidance, unabated inspiration
but also for his never ending willingness to deliver generous research
methodologies, timely attention and kind interest since beginning of my
course. I shall forever remain indebted to him for having inculcated in me
quest for excellences; honesty and respected for the moral and ethics.
I
take this opportunity to express again my gratitude to my teacher
Mr.V.RAJAMANICKAM
M
.Pharmacy
Professor,
Dept
of
Pharmaceuticl analysis,
Mr.J.VINOD M.Pharmacy Asst. Professor of
I am very thankful for the Caplin point family for giving me an
opportunity to carry out part of my dissertation work in their company. I
thank
Mr.Gopi
, HR Department and
Mr.Maasi
, &
Mr.A.Vairamani,
Head Analytical Department
. For their immense help during the project.
I
thank
Mr.Mailkumaran,
MrSugumar,
Mr.Prabhu,
Mr.Balamurugan, Mr.Salim, Mr.Prakash, Mr.Suresh, Mr.Rajkumar
,
Mrs.Amirtham, Ms.Aswini, and all
of the Caplin point family for their
cooperation during my project work.
I am thankful to my Friends
Mr.C.Chandrasekar, Mr.S.Karthik,
Mr.L.Haran, Mr.K.Madankumar, Mrs.Kaaleeswari
for their support and
cooperation during completion of thesis book.
I express my Deepest Affection & thanks to my supporters.
Yes! My thesis is the sensible team effort of all these people, mentioned
or non-mentioned here, still, it is too less to express my deep sense of
thanks to them.
Last… but not the least, I wish to express my gratitude towards “God”
and my parents, who gave me the strength and courage to fulfill my
dream and has showered upon me his choicest blessings.
Place :Krishnankoil
Date : Regd. No-261330352
Arulmigu kalasalingam college of pharmacy
LIST OF ABBREVATIONS
A Absorbance
API Active Pharmaceutical Ingredient
A
s Asymmetry Factor
AUC Area Under Curve
C
p Viscosity
F Flow Rate
GLC Gas Liquid Chromatography
GPC Gel Permeation Chromatography
GSC Gas Solid Chromatography
h Peak Height
HETP Height Equivalent to a Theoretical Plate
HPLC High Performance Liquid Chromatography
i.d. Internal Diameter
IUPAC International Union of Pure and Applied Chemistry
k Retention Factor or Capacity Factor
L Length of Column
LOD Limit of Detection
LOQ Limit of Quantitation
N Plate Number
n Noise
ODS Octadecylsilane
PDA Photo Diode Array
Rs Resolution
RP-HPLC Reverse phase high performance liquid chromatography
S Signal
Tf Tailing Factor
TLC Thin Layer Chromatography
tM Void Time
tR Retention Time
Arulmigu kalasalingam college of pharmacy
UV Ultra Violet
V0 Intraparticle Volume
VC Empty Column Volume
VE Interstitial Volume
VM Void Volume
VR Retention Volume
Wb Peak Width
CHAPTER
NO. TITLE PAGE. NO.
1 INTRODUCTION 1-26
2 LITERATURE REVIEW 27-31
3 DRUG PROFILE 32-33
4 AIM OBJECTIVE and PLAN OF WORK 34
5 EXPERIMENTAL WORKS 35-41
6 METHOD VALIDATION 42-73
7 RESULTS AND DISCUSSION 74-75
9 CONCLUSION 76
10 SUMMARY 77
Arulmigu kalasalingam college of pharmacy 1
1.0 INTRODUCTION
[1-5]Analytical chemistry, like other areas of chemistry and science, has gone
through drastic changes and growth. Analytical chemistry may defined as the “Science and art of determining the composition of materials in terms of the elements or compounds contained”. In analytical chemistry it is of prime importance to gain information about the qualitative and quantitative composition of substances and chemical species, that is to find out what a substance is composed of and exactly how much .
Analytical method is a specific application of a technique to solve an analytical problem. The use of instrumentation is an exciting and fascinating part of chemical analysis that interacts with all areas of chemistry and with many other areas of pure and applied science. Analytical instrumentation plays an important role in the production and evaluation of new products and in the protection of consumers and the
environment. This instrumentation provides the lower detection limits required to assure safe foods, drugs and water. The manufacture of materials, whose composition must be known precisely such as substances used in integrated circuit chips, is monitored by analytical instruments.
Instrumental or physicochemical methods are based on the theory of
relations between the content and the corresponding physicochemical and physical properties of the chemical system being analyzed. Changes in the system properties are either detected or recorded through the measurement of current, electrode potential, electrical conductivity, optical density, refractive index etc. with suitable
and sensitive instruments. In instrumental analysis physical property of substance is measured to determine its chemical composition.
Measurements of physical properties of analyte such as conductivity,
electrode potential, light absorption or emission, mass to charge ratio, and fluorescence, began to be used for quantitative analysis of variety of inorganic and biochemical analyses. Highly efficient chromatographic and electrophoretic techniques began to replace distillation, extraction, and precipitation for the separation of components of complex mixtures prior to their qualitative or quantitative
determination.
Arulmigu kalasalingam college of pharmacy 2
1.1
PRINCIPAL TYPES OF CHEMICAL INSTRUMENTATION
Spectroscopic Techniques
1) Ultraviolet & visible Spectrophotometry
2) Fluorescence & Phosphorescence Spectrophotometry 3) Atomic Spectrometry (Emission & absorption) 4) Infrared Spectrophotometry
5) Raman Spectroscopy
6) Radiochemical techniques including activation analysis
7) Nuclear Magnetic Resonance Spectroscopy 8) Electron Spin Resonance Spectroscopy
Electrochemical Techniques
1) Potentiometry
2) Volta metric techniques 3) Amperometric techniques 4) Coulometry
5) Electrogravimetry 6) Conductance techniques
Chromatographic Techniques
1) High Performance Liquid Chromatography 2) Gas chromatography
Miscellaneous Techniques
1) Thermal analysis
2) Mass Spectrometry 3) Kinetic techniques
Hyphenated Techniques
1) GC-MS (Gas Chromatography – Mass Spectrometry)
Arulmigu kalasalingam college of pharmacy 3
1.2 INTORDUCTION TO CHROMATOGRAPHY
[5-7]Chromatography was first invented by Michael Tswett, a Russian botanist in
1906 in Warsaw for the separation of colored substance into individual component.
Chromatography is defined as a procedure by which solutes are separated
by a dynamic differential migration process in a system consisting of two or more
phases, one of which moves continuously in a given direction and in which the
individual substances exhibit mobilities by reason of differences in adsorption,
partition, solubility, vapour pressure, molecular size or ionic charge density. The
individual substances thus obtained can be identified or determined by analytical
methods.
Chromatography was invented nearly 100 years ago, but it is only in the past few years that the development of the technique and associated instrumentation has reached a level that might be called the ‘steady state’.
Separation Process:
The Chromatographic method of separation, in general, involves the following steps:
Adsorption or retention of substance or substances on the stationary phase.
Separation of the adsorbed substances by the mobile phase.
Recovery of the separated substances by the continuous flow of the mobile
phase.
Arulmigu kalasalingam college of pharmacy 4
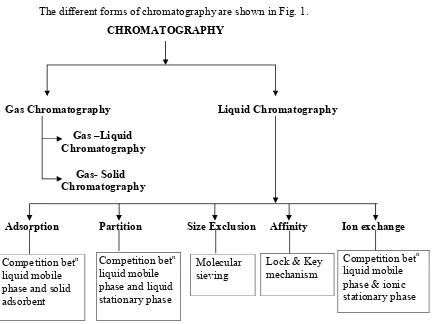
1.2.1 DIFFERENT FORMS OF CHROMATOGRAPHY
The different forms of chromatography are shown in Fig. 1.
CHROMATOGRAPHY
Gas Chromatography Liquid Chromatography
Gas –Liquid Chromatography Gas- Solid Chromatography
Adsorption Partition Size Exclusion Affinity Ion exchange
[image:14.612.121.553.86.410.2]
Fig 1: Different Forms Of Chromatography
1.3 HIGH PERFORMANCE LIQUID CHROMATOGRAPHY
8High performance Liquid Chromatography (HPLC), also known as high pressure liquid chromatography, is essentially a form of column Chromatography in
which the stationary phase consists of small particle (3-50 μm) packing contained in a column with a small bore (2-5mm), one end of which is attached to source of pressurized liquid eluent (Mobile phase).
In High Performance Liquid Chromatography, the mobile as well as the stationary phase compete for the distribution of the sample components. In case of HPLC, separation is based on:
Partition : Separation due to differences in solubility characteristics between
two phases. Competition betn
liquid mobile phase and solid adsorbent
Competition betn liquid mobile phase and liquid stationary phase
Molecular sieving
Lock & Key mechanism
Arulmigu kalasalingam college of pharmacy 5
Adsorption : Separation due to difference in interaction with the surface of the
stationary phase.
Ion Exchange: Due to differences in the affinity of ions for the ion exchanger.
Size Exclusion: Due to differences in molecular weight and size of the molecules
to be separated.
Today, HPLC is the most widely used analytical separation method. The method is popular because it is non-destructive and may be applied to thermally labile
compounds (unlike GC); it is also very sensitive technique since it incorporates a wide choice of detection methods. With the use of post-column derivatization methods to improve selectivity and detection limits, HPLC can easily be extended to trace determination of compounds that do not usually provide adequate detector response. The wide applicability of HPLC as separation method makes it a valuable separation
tool in scientific fields.
1.3.1
MODES OF SEPARATION IN HPLC
There are different modes of separation in HPLC. They are Normal Phase Chromatography (NPC);
Reversed Phase Chromatography (RPC);
Ion Exchange Chromatography;
Ion Pair Chromatography;
Size Exclusion Chromatography; and
Affinity Chromatography
1.3.2 METHODS USED IN HPLC
1) Normal phase chromatography
For a polar stationary bed like silica we need to choose a relatively non polar mobile phase. This mode of operation is termed as Normal phase chromatography.
Arulmigu kalasalingam college of pharmacy 6
practice to saturate the mobile phase with water before using it as eluent in Normal phase chromatography. It is mainly used for separation nonionic, nonpolar to medium
polar substances.
2) Reverse phase chromatography
For hydrocarbon type or nonpolar stationary phase, we need to choose a polar mobile phase. This mode of partition chromatography is called as Reverse phase chromatography.Here the most polar component elutes first. Increasing mobile phase
polarity leads to decrease in elution time. Common solvents used in this mode include Methanol/Acetonitrile/Isopropanol etc. Control of pH is another way to control resolution. In the case of an aromatic acid, a low pH buffer will suppress the ionization, and will increase the capacity factor, while with a high pH buffer, the capacity factor will decrease. Small amounts of modifiers like sodium phosphate/
sodium acetate reduce peak tailing, and increase the separation efficiencies. Mostly used for separation of ionic and polar substances.
3) Ion- Pair Chromatography
Ion-pair and RP- HPLC have several similar features. The column and mobile phase used for both these separation techniques are similar, differing mainly in the addition of an ion-pair reagent to the mobile phase for ion-pair chromatography (IPC). If RPC method development is unable to provide an adequate separation due to poor band spacing, IPC provides selectivity option.
1.3.3 Elution Techniques
(a) Isocratic elution:
A separation in which the mobile phase composition remains constant throughout the procedure is termed isocratic (meaning constant composition).
(b) Gradient elution: The mobile phase composition does not have to remain constant. A separation in which the mobile phase composition is changed during the separation process is described as a gradient elution. One example is a gradient starting at 10%
methanol and ending at 90% methanol after 20 minutes. The two components of the mobile phase are typically termed "A" and "B"; A is the "weak" solvent which allows the solute to elute only slowly, while B is the "strong" solvent which rapidly elutes the
Arulmigu kalasalingam college of pharmacy 7
In isocratic elution, peak width increases with retention time linearly according to the equation for N, the number of theoretical plates. This leads to the
disadvantage that late-eluting peaks get very flat and broad. Their shape and width may keep them from being recognized as peaks.
Gradient elution decreases the retention of the later-eluting components so that they elute faster, giving narrower (and taller) peaks for most components. This also improves the peak shape for tailed peaks, as the increasing concentration of the
organic eluent pushes the tailing part of a peak forward. This also increases the peak height (the peak looks "sharper"), which is important in trace analysis. The gradient program may include sudden "step" increases in the percentage of the organic component, or different slopes at different times - all according to the desire for optimum separation in minimum time.
In isocratic elution, the selectivity does not change if the column dimensions
(length and inner diameter) change - that is, the peaks elute in the same order. In gradient elution, the elution order may change as the dimensions or flow rate change.
The driving force is originated in reversed phase chromatography in the high
order of the water structure. The role of the organic mobile phase is to reduce this high order by reducing the retarding strength of the aqueous component.
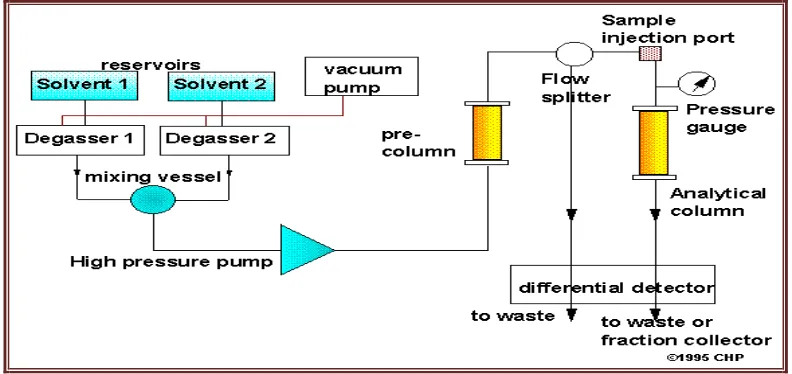
1.3.4 HPLC Instrumentation
A liquid chromatography consists of a reservoir containing the mobile phase, a pump to force the mobile phase through the system at high pressure, an injector to introduce the sample into the mobile phase, a chromatographic column, a detector, and a data collection device such as a computer, integrator, or recorder. Short, small bore
columns containing densely packed particles of stationary phase provide for the rapid exchange of compounds between the mobile and stationary phases. In addition to receiving and reporting detector output, computers are used to control chromatographic settings and operations, thus providing for long periods of
unattended operations.9-10
Arulmigu kalasalingam college of pharmacy 8
Fig. 2: High Performance Liquid Chromatography (Schematic).
1.4 HPLC METHOD DEVELOPMENT
1.3.1 METHOD DEVELOPMENT
9-10Today the development of a method of analysis is usually based on prior art or existing literature, using the same or quite similar instrumentation. It is rare today that
an HPLC based method is developed that does not in some way relate or compare to existing, literature based approaches. The development of any new or improved method usually tailors existing approaches and instrumentation to the current analyte, as well as to the final needs or requirements of the method.
Method development usually requires selecting the method requirements and
deciding on what type of instrumentation to utilize and why. In the development stage, decisions regarding choice of column, mobile phase, detectors, and method of quantitation must be addressed. In this way, development considers all the parameters pertaining to any method.
There are several valid reasons for developing new method of analysis:
There may not be suitable method for a particular analyte in the specific sample
matrix.
Existing method may be inaccurate, artifact , and /or contamination prone, or they
may be unreliable (have poor accuracy or precision)
Existing methods may be too expensive, time consuming or energy intensive, or
Arulmigu kalasalingam college of pharmacy 9
Existing methods may not provide adequate sensitivity or analyte selectivity in
samples of interest.
Newer instrumentation and techniques may have evolved that provide
opportunities for improved methods, including improved analyte identification or detection limits, greater accuracy or precision , or better return on investment. There may be a need for an alternative method to confirm for legal or scientific
reasons analytical data originally obtained by existing methods.
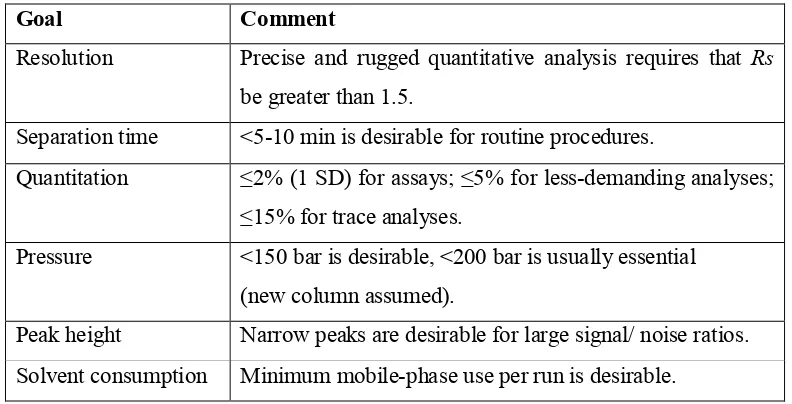
Separation Goals And Steps Involved In HPLC Method Development
The major steps involved in the methods development are shown in the Fig. 3 and the separation goals in HPLC method development are shown in Table 1.
Goal Comment
Resolution Precise and rugged quantitative analysis requires that Rs be greater than 1.5.
Separation time <5-10 min is desirable for routine procedures.
Quantitation ≤2% (1 SD) for assays; ≤5% for less-demanding analyses;
≤15% for trace analyses.
Pressure <150 bar is desirable, <200 bar is usually essential (new column assumed).
Peak height Narrow peaks are desirable for large signal/ noise ratios.
[image:19.612.123.519.280.482.2]Solvent consumption Minimum mobile-phase use per run is desirable.
Arulmigu kalasalingam college of pharmacy 10 HPLC method development is based on few basic steps includes: 11-12
Fig 3: Steps in HPLC Method Development
Once the instrumentation has been selected, based on the criteria suggested
above, it is important to determine “Analyte Parameters” of interest. To develop a method it is necessary to consider the properties of analytes of interest that may be advantageous to establish optimal ranges of analyte parameter values. It is important that method development may be performed using only analytical standards that have
1. Information on sample, define separation goals
2. Need for special HPLC procedure, sample pre-treatment, etc?
3. Choose detector and detector setting
4. Choose LC method; preliminary run, estimate best separation conditions
5. Optimize separation conditions
6. Check for problems or requirement for special procedures
7a. Recover purified material
7c. Qualitative
method 7b. Quantitative calibration
Arulmigu kalasalingam college of pharmacy 11
been well identified and characterized, and whose purity is already known. Such precautions will prevent problems in the future and will remove variables when one is
trying to optimize or improve initial conditions during method development.
1.3.2 Step-by-Step HPLC method development13-16
Documentation starts at the very beginning of the method development
process, a system for full documentation of the development studies must be established. All data relating to these studies must be established. All data relating to
these studies must be recorded in laboratory notebooks or an electronic database. Different steps used in method development are:
1. Literature collection
Search the literature (USP, EP, JP, IP, Chromatography journals, patents,
internet etc.) for available/ existing HPLC methods for the given molecule or
molecules having similar structures.
Check the suitability of reported literature methods and see if the requirements
are met. If required, modify the method to meet the requirements such as resolution of possible impurities as per the synthetic process.
Specify the components to be evaluated in the HPLC method considering all
the possible impurities that can be present in drug substance which could be intermediates, raw materials, process related impurities and degradants.
Collect samples, standards and all possible impurities of each stage, if
available.
2. Chemical structure and other information
Obtain information on analyte solubility, the pKa values (if available) and
functional groups since it is a prerequisite for effective method development.
Based on the structure and the functional group present it can be determined
whether the compound is basic, acidic or neutral.
3. Polarity
Depending on the solubility and nature (acid/base/ionic/non-ionic) of the
molecule select the appropriate mode given below.
Reversed phase chromatography - acids, bases and non-ionic sample
Ion-pair chromatography - ionic samples.
Arulmigu kalasalingam college of pharmacy 12 Normal phase chromatography - isomers, non-polar/non-ionic samples, chiral
molecules.
Size exclusion chromatography - high molecular weight samples such as
proteins.
4. pH/pka Value of compounds
Based on pH/pKa values, the nature of the compound (acidic, basic or neutral
in nature) and polarity of the compound can be assumed.
Note:if the compound is acidic, acidic mobile phase is preferable. For a basic compound, low pH and basic mobile phase is preferable. For a neutral compound neutral mobile phase is suitable.
5. Solubility
Check the solubility of the sample in solutions like mobile phase, mobile phase
organic mixtures, water-organic mixtures and mixtures of acids like perchloric acid, phosphoric acid etc.
Note: If the analyte is soluble in polar solvents like water, methanol, chloroform, acetonitrile or tetrahydrofuran, the method development should be
initiated in reversed phase chromatography. If the analyte is soluble in non-polar solvents like ethyl acetate, n-hexane, dioxane etc. then the method development can be initiated in normal phase chromatography.
6. Column selection
Reversed phase
Column containing C4, C8, C18, Cyano and phenyl, amino stationary
phases comes under reversed phase category and can be used against a more polar mobile phase. The retention of non-polar compounds increases as the length of the alkyl ligand (C4, C8, C18 etc.) increases.
Normal phase
Columns containing cyano, phenyl and silica stationary phases come
Arulmigu kalasalingam college of pharmacy 13 7. Selection of detector
Select a suitable detection technique based on the structure and nature of the
molecule.
UV detectors :compounds having chromophores
Fluorescence Detector : Compounds having Fluorescence properties
Electrochemical Detector : Easily oxidizable compounds
RI Detector: Universal Detector: but cannot be used with gradient elution. This
detector is used for compounds which do not contain chromophores.
ELSD: Universal Detector, but can be used with gradient analysis with higher
sensitivity.
8. Mobile phase selection
Choice of solvents for reversed phase chromatography
The solvents like Water, Methanol, Acetonitrile, Tetrahydrofuran, Isopropyl alcohol, Ethanol etc.
Note: when THF is used as mobile phase component, the content should not be more than 20%.
Organic modifiers
Triethylamine, Diethyl amine, Trifluoroacetic acid, Phosphates, Perchlorates, Chlorides, Bromides, Nitrates etc.
Choice of buffering agent
Phosphates of sodium, potassium, ammonium etc, perchlorates of ammonium, sodium, potassium etc., ammonium acetate etc. Buffering agent
should be selected appropriately in their buffering range to maintain a constant pH of the mobile phase.
Choice of solvents for normal phase chromatography
Solvents like Isopropyl alcohol, Ethanol, n-hexane, Dioxin, Chloroform etc.
Organic modifiers used with normal phase chromatography: Triethylamine, Diethyl amine, Trifluoroacetic acid, Formic acid and Acetic acid.
Ionic compounds
Arulmigu kalasalingam college of pharmacy 14
pair chromatography is preferred because it can be run on the conventional reversed phase columns such as C8, C18 etc. with mobile phase additives.
Ion pair reagents (sodium lauryl Sulphate, heptane Sulphonic acid, Tetra butyl ammonium hydroxide, etc.) of concentrations 0.001%-0.5% can be added to the mobile phase to get optimum retention, peak symmetry and separations.
Note: Concentrations more than specified range should be justified for acidic compounds cationic ion pair reagents like tetra butyl ammonium hydrogen sulphate,
tetra methyl ammonium bromide, sodium per chlorate, can be used as additives in the mobile phase at suitable pH.
For basic compounds, anionic ion pair reagents like sodium salt of butane, pentane, hexane or octane sulphonic acid, per chlorates etc. can be used as additives in the mobile phase at suitable pH.
9. Instrument set up and Initial Studies:
a) Set up the required instrumentation. Verify installation and operational and
performance qualifications of instrumentation using laboratory standard operating procedures (SOP’s).
b) Always use new consumables (e.g. solvents filters and gases). For example never
start method development on an HPLC column that has been used before.
c) Prepare the analyte standard in a suitable injection / introduction solution and in known concentration and solvents. It is important to start with an authentic, known
standards rather than with a complex sample matrix. If the sample is extremely close to the standard (eg. Bulk drug), then it is possible to start work with actual sample.
d) Begin the analysis using the analytical conditions described in the existing
literature.
e) Evaluate feasibility of method with regard to the analytical figures of merit obtained
10) Optimization
During optimization change one parameter at a time, and isolate set of conditions, rather than use a trial and error approach. . Work from an organized, methodical plan, and document every step (Keep a lab notebook) in case of dead
Arulmigu kalasalingam college of pharmacy 15 11) Demonstration of analytical figures of merit
Document the originally determined analytical figures of merit [limit of
quantitation (LOQ), limit of detection (LOD), linearity, time per analysis, cost, sample preparation etc]
12) Evaluation of method development with actual samples
Ensure that the sample solution leads to unequivocal, absolute identification of the analyte peak of interest apart from all other matrix components.
13) Determination of percent recovery of actual sample and demonstration of
quantitative sample analysis
Determine percent recovery of spiked, authentic standard analyte into sample matrix that is shown to contain no analyte. Show reproducibility of recovery (average ± standard deviation) from sample to sample and whether recovery has been
optimized. It is not necessary to obtain 100% recovery as long as the results are reproducible and known with a high degree of certainty.
1.3.4 Chromatographic Parameters :
A) RETENTION TIME B) RETANTION VOLUME C) SEPERATION FACTOR
D) CAPACITY FACTOR E) ASYMMETRIC FACTOR F) THEORETICAL PLATES. G) RESOLUTION
A) RETENTION TIME (Rt): It is the difference in time between the point of injection and the appearance of peak maxima. Retention time is the time required for 50 % of a component to be eluted from a column. It is measured in minutes or
seconds.
B) RETENTION VOLUME (Vr): It is the volume of carrier gas required to elute 50 % of the component from the column.
Arulmigu kalasalingam college of pharmacy 16 C) SEPERATION FACTOR: Separation factor is the ratio of partition - co-efficient of the two components to be separated.
Kb Ka (tb – t o) S = = =
Ka Kb (ta – t o) Where, to = Retention time to unretained substance Kb, Ka = Partition Coefficient of b and a tb, ta = Retention time of substance b and a
S = depends on liquid phase, column temperature.
D) CAPACITY FACTOR: It is generally required to be calculated by the difference in the retention time of main peak and the retention time of uracil injected to the retention time of the main peak.
K’ = Rt-Ru
Rt
Where, Rt : is the retention time of main peak,
Ru: is the retention time of uracil.
K’: is the capacity factor
It is one of the important factor need to be determined while performing method
development of multi formulation, it should be always less then 2.
E) ASSYMETRIC FACTOR: A chromatographic peak should be symmetrical about its center and said to follow Gaussian distribution. But due to some factors, the peak is not symmetrical and shows tailing and fronting.
FRONTING: It is due to the saturation of stationary phase and can be avoided by
using less quantity of sample.
TAILING: It is due to more active adsorption sites and can be eliminated by
support pretreatment, more polar mobile phase, increasing the amount of liquid phase.
F) THEORETICAL PLATES (PLATE THEORY): A theoretical plate is an imaginary or hypothetical unit of a column where distribution of solute between stationary and mobile phase has attained equilibrium. A theoretical plate can also be called as a functional unit of the column.
Arulmigu kalasalingam college of pharmacy 17
1.4 METHOD VALIDATION
16-18Validation is defined as follows by different agencies
Food and Drug administration (FDA): Establishing documentation
evidence, which provides a high degree of assurance that specific process, will
consistently produce a product meeting its predetermined specification and
quality attributes.
World Health Organization (WHO): Action of providing that any
procedure, process, equipment, material, activity, or system actually leads to the
expected results.
European Committee (EC): Action of providing in accordance with the
principles of good manufacturing practice, that any procedure, process,
equipment material, activity or system actually lead to the expected results. In
brief validation is a key process for effective Quality Assurance.
Analytical method validation
Analytical monitoring of a pharmaceutical product or of specific
ingredients within the product is necessary to ensure its safety, efficacy
throughout all phases of its shelf life. Such monitoring is in accordance with the
specifications elaborated during product development.
Analytical method validation is the corner stone of process validatio n
without a proven measurement system it is impossible to confirm whether the
manufacturing process has done what it purports to do. All new analytical
methods developed are validated.
Steps followed for validation procedures
1.Proposed protocols or parameters for validations are established
2.Experimental studies are conducted
3.Analytical results are evaluated
4.Statistical evaluation is carried out
Arulmigu kalasalingam college of pharmacy 18
1.4.1 VALIDATION PARAMETERS
Analytical methods are required for the identification, batch analysis and storage stability data for active constituents of Pharmaceutical product, and for post-registration compliance purposes. Analytical method development as a first step is carried out to ensure that the API used and the dosage forms that are developed and manufactured for human consumption are meeting the regulated quality norms. Every newly developed method must be validated prior to sample analysis. Validation must also be repeated if a parameter has been modified or if the validation was strongly
performed in another laboratory, to ensure that the methods are transferable. A verification is necessary if the analyst or instrument have been changed, or if the sample type has been modified.
The objective of validation of an analytical method is to demonstrate that the procedure, when correctly applied, produces results that are fit for purpose. Method
validation is a practical process designed and experimentally carried out to ensure that an analytical methodology is accurate, specific, reproducible and rugged over the specified range of analysis. Validation provides both assurance and reliability during normal use and documented evidence that the method is ‘fit for purpose’.
Method validation ensures the validity of a measurement before it is carried out
and is essential part of quality assurance procedures. The process of method validation provides information on the critical factors affecting the method output, thus enabling suitable quality control procedures to be implemented to ensure data quality. The extent of method validation will vary with applications, sector and regulatory compliance.
Typical validation characteristics which should be considered are listed below
Accuracy
Precision
Specificity
Detection limit
Quantitation limit
Linearity
Range
Robustness etc.
Arulmigu kalasalingam college of pharmacy 19
[image:29.612.123.523.518.726.2]1.4.2 ICH VALIDATION PARAMETERS
19,20Table 2 : Data Elements Required For Validation According To ICH
- signifies that this characteristic is not normally evaluated
+ signifies that this characteristic is normally evaluated
(1) In cases where reproducibility has been performed, intermediate
precision is not needed
(2) Lack of specificity of one analytical procedure could be
compensated by other supporting analytical procedure(s)
(3) May be needed in some cases
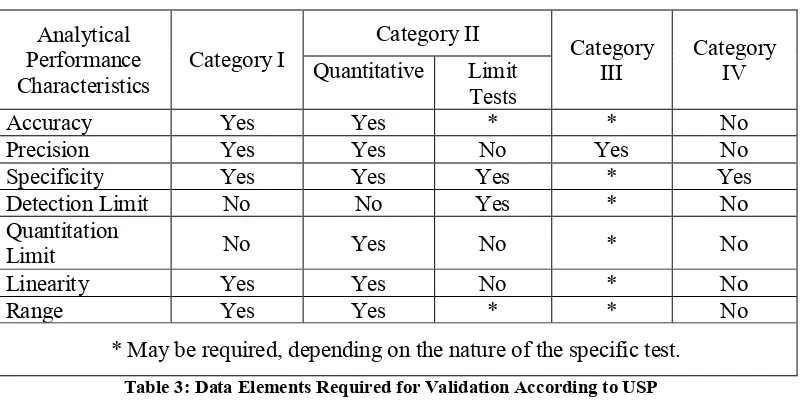
1.5.3
USP VALIDATION PARAMETERS
19,20Analytical Performance Characteristics Category I Category II Category III Category IV Quantitative Limit
Tests
Accuracy Yes Yes * * No
Precision Yes Yes No Yes No
Specificity Yes Yes Yes * Yes
Detection Limit No No Yes * No
Quantitation
Limit No Yes No * No
Linearity Yes Yes No * No
Range Yes Yes * * No
* May be required, depending on the nature of the specific test. Table 3: Data Elements Required for Validation According to USP Type of analytical
procedure
Identification
Testing for impurities Assay-dissolution (measurement only)
- content/potency Characteristics Quantitation Limit
Accuracy - + - +
Precision Repeatability Interm. Precision - - + (1) - - + + (1)
Specificity (2) + + + +
Detection Limit - (3) + -
Quantitation Limit - + - -
Linearity - + - +
Arulmigu kalasalingam college of pharmacy 20 1) Accuracy
The accuracy of an analytical method is defined as the degree to which the
determined value of analyte in a sample corresponds to the true value. Accuracy may be measured in different ways and the method should be appropriate to the matrix. The accuracy of an analytical method may be determined by any of the following ways:
Analyzing a sample of known concentration and comparing the measured value
to the ‘true’ value. However, a well characterized sample (e.g. reference standard) must be used.
Spiked-placebo (product matrix) recovery method. In the spiked-placebo
recovery method, a known amount of pure active constituent is added to formulation blank (sample that contains all other ingredients except the active ingredient), the resulting mixture is assayed, and the results obtained are compared with the expected result.
Standard addition method. In the standard addition method, a sample is
assayed, a known amount of pure active constituent is added, and the sample is again assayed. The difference between the results of the two assays is compared with the expected answer.
In both methods (spiked-placebo recovery and standard addition method), recovery is defined as the ratio of the observed result to the expected result expressed
as a percentage.
The accuracy of a method may vary across the range of possible assay values and therefore must be determined at several different fortification levels. The accuracy should cover at least 3 concentrations (50%, 100% and 150%) in the expected range.
Accuracy may also be determined by comparing test results with those
obtained using another validated test method. Acceptance criteria:
The expected recovery depends on the sample matrix, the sample processing procedure and on the analyte concentration. The mean % recovery should be within
the following ranges: For assay: 98%-102%
2) Precision
Arulmigu kalasalingam college of pharmacy 21
Precision may be considered at three levels:
System Precision (Repeatability)
Method Precision (Reproducibility)
Intermediate precision (Ruggedness)
The precision of an analytical procedure is usually expressed as the variance, standard deviation or coefficient of variation of a series of measurements. A minimum of 6 replicate sample determinations should be made together with a simple statistical
assessment of the results, including the percent relative standard deviation. The following levels of precision are recommended.
Acceptance criteria: For an assay the %RSD should be NMT 2%
3) Specificity 21-23
It signifies the instruments, ability to measure or identify the analyte without
any interference from sample matrix, impurities, precursors or degradation product.
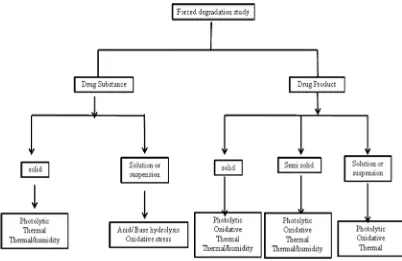
Forced degradation
Forced degradation provides useful information about the degradation pathways and degradation products during the product storage. The information thus obtained will facilitate pharmaceutical development in areas such as formulation development, manufacturing, and packaging, where knowledge of chemical behavior can be used to improve the quality of drug product.
HPLC methods should be able to separate, detect, and quantify the various drug-related degradants that can form on storage or manufacturing, plus detect and quantify any drug-related impurities that may be introduced during synthesis. Forced degradation studies (chemical and physical stress testing) of new chemical entities and
drug products are essential to help develop and demonstrate the specificity of such stability-indicating methods. In addition to demonstrating specificity, forced degradation studies can be used to determine the degradation pathways and degradation products of the APIs that could form during storage, and facilitate
formulation development, manufacturing, and packaging. Procedures for the preparation of specific degradation products needed for method validation often
emerge from these studies.
For marketing applications, current FDA and ICH guidance recommends inclusion of the results, including chromatograms of stressed samples, demonstration of the stability indicating nature of the analytical procedures, and the degradation
Arulmigu kalasalingam college of pharmacy 22
of significant degradation products and the associated procedures for their isolation and/or characterization are also expected to be included in the filing. The experimental
protocol for performing forced degradation studies will depend on the active ingredients and formulation involved because the chemistry of each compound is different. In general, a target of approximately 10-30% degradation of the API during forced degradation, or exposure to energy in slight excess of what is typically used in accelerated storage is recommended. In this way, the “worst-case” degradation
products can be studied. The following will provide some suggestions for performing forced degradation studies based upon available guidance from the ICH and FDA.
Stress testing is likely to be carried out on a single batch of the drug substance. The testing should include the effect of temperatures [in 10°C increments (i.e., 50°C, 60°C) above that for accelerated testing], humidity (i.e., 75% relative humidity or
greater) where appropriate, oxidation, and photolysis on the drug substance. The testing should also evaluate the susceptibility of the drug substance to hydrolysis across a wide range of pH values when in solution or suspension.
The stress studies should assess the stability of the drug substance in different pH solutions, in the presence of oxygen and light, and at elevated temperatures and humidity levels. The guidance does not specify pH, temperature ranges, specific oxidizing agents, or conditions to use, the number of freeze-thaw cycles, and so on. In
Arulmigu kalasalingam college of pharmacy 23
[image:33.612.126.528.110.371.2]Different forced degradation conditions to be used for drug substances & products16
Fig 4: Different Forced Degradation Conditions To Be Used For Drug Substances & Products
However, for small pharmaceutical molecules for which acceptable stability limits of 90% of label claim is common, pharmaceutical scientists have agreed that approximately 10% degradation is optimal for use in analytical validation. In designing forced degradation studies, it must be remembered that more strenuous
conditions than those used for accelerated studies (25°C/60% RH or 40°C/75% RH) should be used.
It must be noted that a forced degradation study is a “living process” and should be done along the developmental time line as long as changes in the stability-indicating methods, manufacturing processes, or formulation changes are ongoing. Forced degradation is only considered complete after the manufacturing process is
finalized, formulations established, and test procedures developed and qualified. At a minimum, the following conditions should be investigated:
1. Acid and base hydrolysis 2. Hydrolysis at various pH 3. Thermal degradation
Arulmigu kalasalingam college of pharmacy 24 4) Detection limit
The detection limit of an analytical procedure is the lowest amount of an
analyte in a sample that can be detected, but not necessarily quantitated as an exact value.
The LOD may be determined by the analysis of samples with known concentrations of analyte and by establishing the minimum level (lowest calibration standard) at which the analyte can be reliably detected. The lowest calibration
standard which produces a peak response corresponding to the analyte should be measured ‘n’ times (normally 6-10). The average response (X) and the standard deviation (SD) calculated.
The LOD = 3.3 * SD/ Slope of Calibration curve SD = Standard Deviation
5) Quantitation limit
The limit of quantitation is the lowest amount of the analyte in the sample that can be quantitatively determined with defined precision under the stated experimental conditions. The limit of quantitation is a parameter of quantitative assays for low levels of compounds in sample matrices and is used particularly for the determination of impurities and/or degradation products or low levels of active constituent in a product. The LOQ may be determined by preparing standard solutions at estimated
LOQ concentration (based on preliminary studies). The solution should be injected and analyzed ‘n’ times (normally 6-10). The average response and the standard deviation (SD) of the n results should be calculated and the SD should be less than 20%. If the SD exceeds 20%, a new standard solution of higher concentration should
be prepared and the above procedure repeated.
The LOQ = 10 * SD/ Slope of Calibration curve SD = Standard Deviation
6) Linearity
The linearity of an analytical method is its ability to elicit test results that are directly proportional to the concentration of analytes in samples within a given range
Arulmigu kalasalingam college of pharmacy 25
Linearity is determined by series injections of whose concentrations span 50-150 percent of the expected concentration range. The response should be directly
proportional to the concentrations of the analytes or proportional by means of a well-defined mathematical calculation. A linear regression equation applied to the results should have an intercept not significantly different from zero (0). If a significant nonzero intercept is obtained, it should be demonstrated that this has no effect on the accuracy of the method.
7) Range
The range of an analytical method is the interval between the upper and lower levels (including these levels) that have been demonstrated to be determined with precision, accuracy and linearity using the method as written. The range is normally expressed in the same units as the test results (e.g. percentage, parts per million)
obtained by the analytical method.
For assay tests, the ICH requires the minimum specified range to be 80 to 120 percent of the test concentration, and for the determination of an impurity, the range to extend from the limit of quantitation, or from 50 percent of the specification of each impurity, whichever is greater, to 120 percent of the specification.
8) Robustness
Robustness tests examine the effect that operational parameters have on the
analysis results. For the determination of a method’s robustness, a number of method parameters, for example, pH, flow rate, column temperature, injection volume, detection wavelength or mobile phase composition, are varied within a realistic range, and the quantitative influence of the variables is determined. If the influence of the
parameter is within a previously specified tolerance, the parameter is said to be within the method’s robustness range.
Obtaining data on these effects helps to assess whether a method needs to be revalidated when one or more parameters are changed, for example, to compensate for
column performance over time. In the ICH document, it is recommended to consider the evaluation of methods robustness during the development phase, and any results
Arulmigu kalasalingam college of pharmacy 26 9) Ruggedness
Ruggedness tests examine the effect that operational parameters have on the
analysis results. The ruggedness was determined by changing the column same manufacture but different lot numbers and Analyst variability and system to system variability. In all the ruggedness conditions the method parameters shall meet the system suitability criteria.
10) Solution stability
Solution stability was determined by Preparing the samples and standard solutions at room temperature and inject at initially and after 1 day, 2day, 3day if possible Similarly Prepare the mobile phase and keep it at room temperature in well closed condition and inject into HPLC system. Evaluate the all the system suitability parameters.
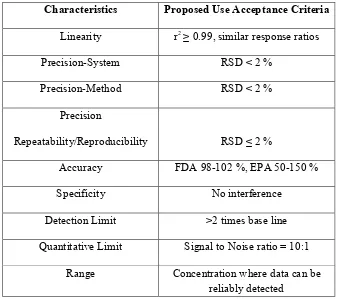
Proposed Acceptance Criteria for the Different Characteristics of Validation by
ICH 18 ,20
Table 4: Proposed ICH Acceptance Criteria For The Different Characteristics Of Validation
Characteristics Proposed Use Acceptance Criteria
Linearity r2≥ 0.99, similar response ratios
Precision-System RSD < 2 %
Precision-Method RSD < 2 %
Precision
Repeatability/Reproducibility RSD ≤ 2 %
Accuracy FDA 98-102 %, EPA 50-150 %
Specificity No interference
Detection Limit >2 times base line
Quantitative Limit Signal to Noise ratio = 10:1
[image:36.612.153.492.361.660.2]Arulmigu kalasalingam college of pharmacy 27
CHAPTER 3
REVIEW OF LITERATURE
The following methods have been reported for the estimation of Dexketoprofen
individually and in combination with other drugs.
1) M.T.Harde et al
23A simple, fast, accurate and precise method has been developed for the
simultaneous determination of thiocolchicoside and dexketoprofen from
pharmaceutical formulation by reversed-phase high performance liquid
chromatography. The separation was carried out on C18 column using mobile phase
consisting of a mixture of methanol: phosphate buffer and pH adjusted to 4.5 with
orthophosphoric acid inthe ratio (65:35 v/v). The flow rate was maintained at 1.0
ml/min. The UV detection was carried out at a wavelength of 260 nm. The retention
time for thiocolchicoside and dexketoprofen was found to be 3.02 min and 8.91 min
respectively. Linear response obtained for thiocolchicoside was in the concentration
range 4-
24 μg/ml (r2 = 0.9998) and dexketoprofen in the range 5
-3
0 μg/ml (r2 =
0.9990). The relative standard deviation in the tablets was found less than 2% for
six replicates. The method was validated according to theICH guidelines with
respect to linearity, precision, accuracy, limit of detection, limit of quantification
and robustness. Thus, proposed method can be successfully applicable to the
pharmaceutical preparationcontaining the above mentioned drugs without any
interference of excipients.
2) Rao J R
et al
24An accurate, simple, sensitive and precise reverse phase high performance liquid
chromatographic (RP-HPLC) method for the determination of paracetamol and
dexketoprofen trometamol was developed and validated in the bulk drug and in
tablet dosage form. Thermo Hypersil ODS–C18 (250 mm × 4.6 mm, 5.0
μ) used as
stationary phase and methanol: ammonium acetate buffer (65: 35 v/v) as mobile
Arulmigu kalasalingam college of pharmacy 28
retention time for paracetamol and dexketoprofen trometamol was found to be 3.20
and 5.94 min, respectively. Proposed method was validated for precision, accuracy,
linearity range and robustness.
3) Dhaneshwar et al
25In the present study, comprehensive stress testing of Dexketoprofen trometamol
was carried out according to ICH guideline Q1A (R2). Dexketoprofen trometamol
is subjected to stress conditions of hydrolysis, oxidation, photolysis and neutral
decomposition. Additionally, the solid drug is subjected to 50 °C for 60 days in
dry-bath, and to the combined effect of temperature and humidity, with and without
light, at 40°C/75% RH. The drug was found to degrade significantly in oxidative
and photo condition whereas it is found to be stable in acidic, alkaline and neutral
condition. The drug is relatively stable in the solid-state, except formation of minor
products under accelerated conditions. Successful separation of drug from
degradation products formed under stress conditions is achieved on a Thermo
Hypersil BDS–C
18
(250 mm × 4.6
mm, 5.0 μ) from Germany with isocratic
conditions and simple mobile phase containing methanol: acetate buffer pH
adjusted to 4 with glacial acetic acid (65: 35) at flow rate of 1 mL/min using UV
detection at 255 nm. The method is validated according to ICH guidelines. The
developed method is found to be precise, accurate, specific and selective
.4) D. V. Pokharkar et al 26
A simple, specific, accurate and stability-indicating reversed phase high
performance liquid chromatographic method was developed for the simultaneous
determination of Dexketoprofen trometamol and Paracetamol from tablet dosage
form using a Hypersil BDS, C18 column (5μ, 4.5mm x 250 mm) column and
mobile phase composed of 0.01m Potassium Dihydrogen Phosphate:acetonitrile
(75:25 v/v) pH 6.0 adjusted with Triethylamine, at flow rate of ml/min. The
retention time of Dexketoprofen Trometamol and Paracetamol were found to be
Arulmigu kalasalingam college of pharmacy 29
concentration range of 50-
150μg/ml. The percentage recoveries of Dexketoprofen
Trometamol and Paracetamol were found to be in the range of 98.12%-101.82%
and 98.15%-101.8% respectively. Detection was carried out at wavelength 254nm
using photodiode array detector. The separation was carried out at 400
oC
temperature. Both the drugs were subjected to acid, alkali, neutral hydrolysis,
oxidation, dry heat, and UV degradation. The degradation studies indicated
Dexketoprofen trometamol and Paracetamol showed degradation in acid and alkali.
The degradation products of Dexketoprofen trometamol and Paracetamol in acidic
and alkali were well resolved from the pure drug with significant differences in
their retention time values. This method can be successfully employed for
simultaneous quantitative analysis of Dexketoprofen trometamol and Paracetamol
in tablet
formulations.5) Krunal Pandya et al
27The study is focused to developed and validate a UV-Spectroscopic method and
HPLC Method for simultaneous estimation of Dexketoprofen Trometamol from
their dosage form. Equation is applied in spectroscopic method, in which
wavelengths, 260nm has been been selected. At this wavelength drug have
considerable absorbance. The method was found to be linear in range of 2-
12μg/mL
for Dexketoprofen Trometamol. The accuracy and precision were determined and
validated statistically.
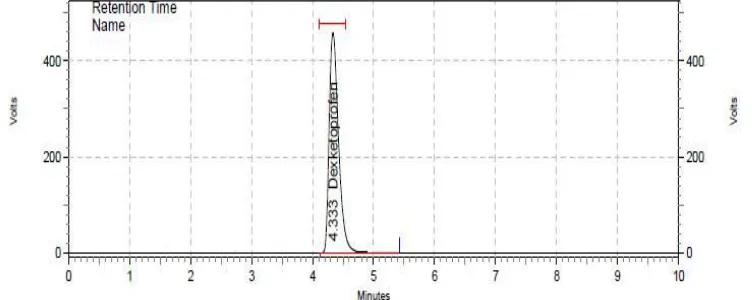
A simple Reverse Phase Liquid Chromatographic method has been developed and
validated for determination of Dexketoprofen Trometamol. The separation was
carried out using mobile phase consisting of Phosphate buffer: Methanol (30:70).
The column was used Luna 5u C18 (2) 100A of size 0.25m *4.6mm with flow rate
of 1.0 mL/min using 260nm as detector. The describe method was linear over
concentration range of 10-50 ppm for assay of Dexketoprofen Trometamol. The
retention time of Dexketoprofen Trometamol was found to be 4.31. Result of
analysis was validated statistically. Both the method shows good reproducibility
and recovery with less than 1%. All the test above mentioned studies were found to
Arulmigu kalasalingam college of pharmacy 30
accurate and can be successfully applied for the routine analysis of Dexketoprofen
Trometamol bulk and marketed dosage form.
6) Santosh V.Gandhi et al
28This paper describes a simple, sensitive, accurate, and validated reverse-phase
high-performance liquidchromatographic (RP-HPLC) method for the simultaneous
quantification of these compounds as the bulk drug andin tablet dosage forms.
Separation was carried out on Jasco HPLC system equipped with HiQ sil C18 HS
colum(250 × 4.6 mm i.d.) and PDA detector using Methanol: Sodium acetate buffer
(70:30, v/v) with pH adjusted to 5with Glacial acetic acid as the mobile phase and
detection was carried out at 265 nm
.
Results were linear in therange of 5-
30 μg
mL
−1 for Dexketoprofen and 1
–
10 μg mL−1 for Thiocolchicoside. The method
was successfully applied for the analysis of drugs in pharmaceutical formulation.
Results of the analysis were validated statistically and by recovery studies.
7) Chaudhari et al
29Two simple spectrophotometric methods have been developed for simultaneous
estimation of Thiocolchicoside and Dexketoprofen trometemol from pharmaceutical
dosage form. Method-I involved simultaneous equation method and Method-II is
the Q-absorbance method. For simultaneous equationmethod, the absorbances of
the standard solutions were taken at two wavelengths 368 nm (
λ
-max of
Thiocolchicoside) and 258 nm (λ
-max of dexketoprofen trometamol). For
Q-absorbance method, the Q-absorbances of the standard solutions were taken at two
wavelengths
258 nm (λ
-max of dexketoprofen trometamol) and 281 nm
(Isoabsorptive point), in methanol. Linearity range was found to be 2-
24 μg/ml
for
dexketoprofen trometamol and Thiocolchicoside in both methods based on the ratio
of the two drugs in combined dosage form. The accuracy and precision of the
methods were determined and validated statistically. Both methods showed good
reproducibility and recovery with RSD less than 2. Proposed methods were found to
be rapid, specific, precise and accurate and can be successfully applied for the
Arulmigu kalasalingam college of pharmacy 31
pharmaceutical dosage form
8)
Kadamet al
30The Literature survey indicates several methods for the determination of
Dexketoprofen trometamol. So an attempt was made to develop and validate a
simple, precise, accurate, and economical RP-HPLC method as per ICH guidelines
for the estimation of Dexketoprofen trometamol in bulk and pharmaceutical dosage
forms. A simple reverse phase HPLC method was developed for the determination
of Dexketoprofen trometamol present in pharmaceutical dosage forms.C18 (4.6ID x
250mm) in an gradient mode with mobile phase Acetonitrile: Methanol (25:75) was
used. The flow rate was 0.9ml/min and effluent was monitored at 262nm. The
retention time was 2.9 min for Dexketoprofen trometamol. The linearity ranges
were found to be 30-
70μg/ml
9) Selvadurai Muralidharan
et al
31Simple, economic, precise, rugged, sensitive and validated RP-HPLC method has
been developed to determine dexketoprofen (DKP) tablet. Chromatographic
separation was achieved isocratically on Thermo, C18column (250mm × 4.6
mm,5
μ
m and acetonitrile: ammonium acetate buffer (pH 5.0) in the ratio of 400:60
(v/v) using mobile phase, at a flow rate of 1.0 ml/min. Detection was carried out at
225 nm. The retention time for DKP was found to be 4.25 min respectively. The
method was validated as per ICH guidelines. The method was linear in the
concentration range of 100-600 ng/ml for with correlation coefficient of 0.99
respectively. The mean recoveries obtained for DKP was 98.14 % respectively. The
correlation coefficients for all components are close to 1. The present developed
and validated method was found to be more accurate, precise, selective, rapid and
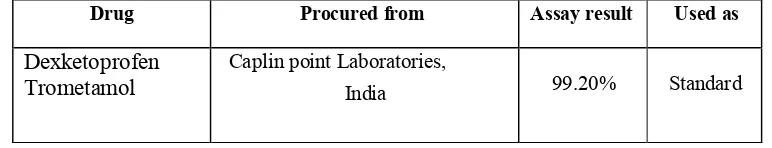
Arulmigu kalasalingam college of pharmacy 32 DRUG PROFILE 21, 22, 23
DEXKETOPROFEN :
Structure :
Chemical name : (2S)2 [3(benzoyl) phenyl] propanoic acid
Description : White or almost white crystalline powder.
Molecular formula : C16H14O3
Molecular weight : 254.280g/mol
Melting point : 94°C (201.2°F)
Solubility : Freely soluble in water and sparingly soluble in methanol.
Category : Analgesic
Half life : 1.54±0.63
Pharmacology
Indication:-
Short-term treatment of mild to moderate pain including dysmenorrhoea.
Pharmacodynamics:-
Dexketoprofen is a propionic acid derivative and an isomeric form of
ketoprofen. The drug inhibits prostaglandin biosynthesis by inhibition of
cyclooxygenase pathway (COX-1 and COX-2)
Mechanism of action:-
Dexketoprofen belongs to a class of medicines called non-steroidal anti
-inflammatory drugs (NSAIDs). Prostaglandins are produced in response to injury or
certain diseases and would otherwise go on to cause swelling, inflammation and pain.
By blocking cyclo-oxygenase, dexketoprofen prevents the production of
prostaglandins and therefore reduces inflammation and pain. Along with Peripheral
Arulmigu kalasalingam college of pharmacy 33 Absorption:-
Dexketoprofen is highly lipophilic. Absorption is controlled by diffusion
through membranes. After the adminstrartion absorption is rapid.
Metabolism:-
Deketoprofen is metabolized by liver. The major metabolic pathways involves
at least two cytochrome p450 enzyme. Dexketoprofen trometamol mostly conjucated to
an acyl glucronide.
Route of elimination:-
Deketoprofen was eliminated