Impact of Entertainment on Regional Shopping Centre Image: Implications for Youth Shopper Segmentation
Jason Sit and Dawn Birch, University of Southern Queensland
Abstract
Entertainment is increasingly an integral part of the shopping centre experience, and can create a base of strategic differentiation for regional shopping centres. However, limited studies have examined the impact of entertainment on regional shopping centre image. Moreover, using entertainment as a means of identifying youth shopper segments has not been explored. In this study, an inventory of attributes that impact upon shopping centre image was developed, including entertainment attributes. Based on this inventory of image attributes, four segments of youth shoppers were identified, and these were labelled as the ‘convenience’ shopper, the ‘experiential’ shopper, the ‘apathetic’ shopper, and the ‘serious’ shopper. Based on their emphasis on the importance of entertainment, the ‘experiential’ youth shopper, which comprised almost 50% of total responses, is identified as the entertainment
segment, whereas the other three groups of youth shoppers are less concerned with entertainment, and thus collectively form a non-entertainment segment.
Introduction
Given the intensifying competition in the shopping centre industry, the integration of entertainment into the shopping experience has become a popular strategy both to attract shoppers to regional shopping centres and to get them to spend more time in the centre (Evans 1999). Regional shopping centres are defined as a shopping centre that comprises a full-line department store, a full-line discount department store, a supermarket and around 100 specialty stores (Property Council of Australia 1999). Also, regional shopping centres generally house a range of entertainment facilities, such as a cinema complex, video arcade or a bowling alley. Indeed, several regional shopping centres in Australia have been constructed with substantial floorspace being allocated to entertainment, such as Harbour Town at the Gold Coast (Smith 2003). Regional shopping centres make a significant contribution to the economy of Australia. For example, in 2000, regional shopping centres generated an estimated $3.4 billion retail sales and employed approximately 30,000 people in the state of Queensland, Australia (Dimasi and Rutherford 2001).
The ‘Big Four’ Attributes of Shopping Centre Image
A review of the shopping centre literature reveals that shopping centre image has been dominated by four key attributes, namely merchandise mix, accessibility, services and atmospherics (Dennis, Marsland and Cockett 2001; Finn and Louviere 1996; Frasquet, Gil and Molla 2001). Merchandise mix reflects merchandise assortment, quality, pricing, and styling or fashion (Dennis, Marsland and Cockett 2001; Finn and Louviere 1996; Frasquet, Gil and Molla 2001). Accessibility simply refers to the ease of getting in and out of the shopping centre (Levy and Weitz 1998). The services of a shopping centre are commonly measured by the behaviour of retail employees, including courtesy, knowledge, and friendliness, and thus could be classified as personal services (Lovelock, Patterson and Walker 1998). The atmospherics of a shopping centre refer to ambience, colour, décor, music and layout (Smith and Burns 1996).
Shopping Centre Entertainment. The dominance of the ‘big four’ attributes in shopping centre studies reveals that entertainment has been neglected (Evans 1999; Hazel 2002). In Australia, shopping centre entertainment can be divided into three categories, namely specialty entertainment, special event entertainment, and food (Barreto and Konarski 1996). The key distinction between these types of entertainment is their frequency and durability (Haynes and Talpade 1996). That is, special event entertainment (e.g. fashion shows or mini concerts) is offered on an occasional and temporary basis. Conversely, specialty entertainment (e.g. cinemas and video arcades), and food entertainment (e.g. eateries and cafés) are more permanent and durable aspects of the tenant mix of a shopping centre (Barreto and Konarski 1996).
Limited studies have explored the contribution of shopping centre image and entertainment attributes to the segmentation of youth shoppers (Bellenger, Robertson and Greenberg 1977; Dennis, Marsland and Cockett 2001; Reynolds, Ganesh and Luckett 2002). However, segmentation of youth shoppers is essential as these segments are not homogenous in terms of the benefits they seek from a regional shopping centre (Steenkamp and Wedel 1991). Moreover, regional shopping centre segmentation should not be confined to the ‘big four’ attributes (merchandise, accessibility, services and atmospherics) because the entertainment attributes appear to be particularly relevant for segmenting youth shoppers (Sit, Merrilees and Birch 2003).
Research Methodology
Based on the literature and preliminary investigations, a pool of thirty-three items were generated to measure the image of a regional shopping centre in South East Queensland, Australia. This regional shopping centre comprises various cafés, a considerably large food court, and an eight-screen cinema. A questionnaire was mailed to 500 households to measure the thirty-three items on Likert-type scales. Households were randomly selected using an area sampling technique, and only youth shoppers aged between 15 and 24 in the household were qualified to respond. One hundred and twelve usable questionnaires were returned, representing a 22.4 percent response rate.
Results of Data Analysis
rotation. Due to low correlation between the total set of items representing the five dimensions, items were factor analysed separately revealing nine factors, as summarised in Table 1 (Tabachnick and Fidell 1989). Only factors with eigenvalues greater than 1.0 were retained. The Kaiser-Meyer-Olkin (KMO) measure of sampling adequacy was rated 0.70 and above, and also Bartlett’s test of sphericity was high and significant (Kaiser 1958). The
[image:3.595.61.529.276.745.2]second stage of data analysis involved k-means clustering (a non-hierarchical clustering) to determine distinct youth segments. K-means clustering has been found to be both exceptionally robust and unaffected by data idiosyncrasies (Punj and Stewart 1983). The cluster analysis was based on the set of nine factors. To determine optimal number of clusters, 4-cluster, 5-cluster, and 6-cluster solutions were performed and examined. The 4-cluster solution was chosen as it produced most meaningful and contrasting segments of youth shoppers, as presented in Table 2.
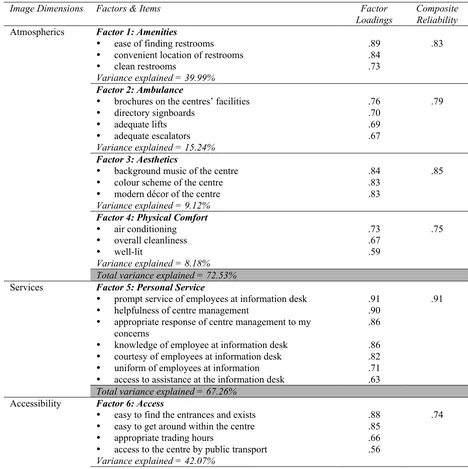
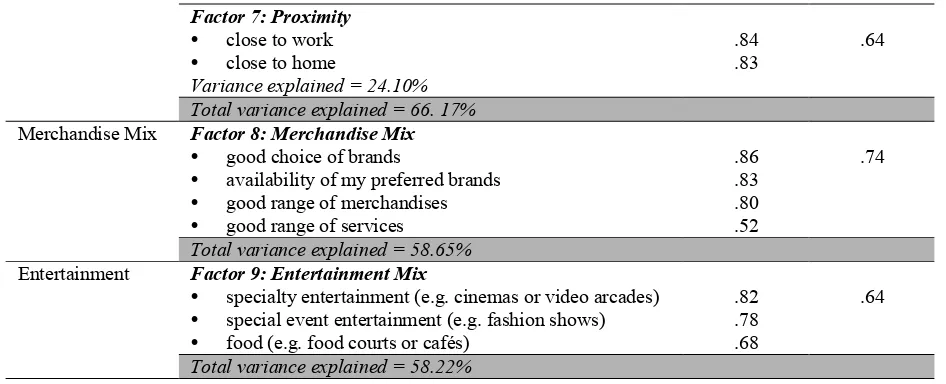
Table 1: Factor Loadings of Regional Shopping Centre Image
Image Dimensions Factors & Items Factor
Loadings
Composite Reliability Factor 1: Amenities
ease of finding restrooms
convenient location of restrooms
clean restrooms
Variance explained = 39.99%
.89 .84 .73
.83
Factor 2: Ambulance
brochures on the centres’ facilities
directory signboards
adequate lifts
adequate escalators Variance explained = 15.24%
.76 .70 .69 .67
.79
Factor 3: Aesthetics
background music of the centre
colour scheme of the centre
modern décor of the centre Variance explained = 9.12%
.84 .83 .83
.85
Factor 4: Physical Comfort
air conditioning
overall cleanliness
well-lit
Variance explained = 8.18%
.73 .67 .59
.75 Atmospherics
Total variance explained = 72.53% Factor 5: Personal Service
prompt service of employees at information desk
helpfulness of centre management
appropriate response of centre management to my concerns
knowledge of employee at information desk
courtesy of employees at information desk
uniform of employees at information
access to assistance at the information desk
.91 .90 .86 .86 .82 .71 .63 .91 Services
Total variance explained = 67.26% Accessibility Factor 6: Access
easy to find the entrances and exists
easy to get around within the centre
appropriate trading hours
access to the centre by public transport Variance explained = 42.07%
.88 .85 .66 .56
Factor 7: Proximity
close to work
close to home
Variance explained = 24.10%
.84 .83
.64
Total variance explained = 66. 17% Factor 8: Merchandise Mix
good choice of brands
availability of my preferred brands
good range of merchandises
good range of services
.86 .83 .80 .52
.74 Merchandise Mix
Total variance explained = 58.65% Factor 9: Entertainment Mix
specialty entertainment (e.g. cinemas or video arcades)
special event entertainment (e.g. fashion shows)
food (e.g. food courts or cafés)
.82 .78 .68
.64 Entertainment
[image:4.595.62.535.69.261.2]Total variance explained = 58.22%
Table 2: Youth Clusters of Regional Shopping Centres
Mean scores*
Cluster 1 Cluster 2 Cluster 3 Cluster 4
Image Factors
Convenience Experiential Apathetic Serious
1. Amenities 2.85 3.65 2.89 3.39
2. Ambulance 1.78 2.82 0.50 2.78
3. Aesthetic 1.09 2.50 0.56 1.59
4. Physical comfort 2.62 3.49 1.33 3.38
5. Personal services 2.19 3.15 3.43 3.04
6. Access 2.14 3.24 1.83 2.59
7. Proximity 2.39 2.66 2.50 1.20
8. Merchandise mix 2.73 3.42 3.25 3.35
9. Entertainment mix 2.08 2.77 1.00 2.04
% of membership 23.21 46.43 2.68 27.68
*0=not at all important; 1=not so important; 2=neutral; 3=fairly important; 4=very important
Factor Solution of Regional Centres. Atmospherics (the first dimension) comprised four factors: amenities (the locality and cleanliness of restrooms); ambulance (the ease with which shoppers can navigate or move within the centre); aesthetics (the centre design); and physical comfort. These four factors, also known as the ‘silent salespeople’ communicate the quality of the centre to the customer (Merrilees and Miller 2001). Services (the second dimension) revealed one factor that was labelled ‘personal services’. This factor concerns the attitude of employees and shopping centre management in handling customers’ enquiries. Accessibility (the third dimension) comprised two factors, namely access and proximity. Access refers to the ease with which the consumer could navigate within the centre, and proximity emphasises the distance between the centre and the consumer’s place of work and residence. Merchandise mix (the fourth dimension) comprised one factor and was labelled ‘merchandise mix’ and concerned the assortment of brands, merchandise and services. The final dimension, entertainment, also consisted of one factor and was labelled ‘entertainment mix’ which concerned food courts, specialty entertainment, and special event entertainment.
are essential to regional centres in delivering the merchandise to the customer, whereas
supporting attributes add value to the shopping experience (Merrilees and Miller 1996). For example, personal services and directory signboards facilitate navigation within the regional centre, and thus enable youth shoppers to reach a destination outlet more efficiently. However, during the shopping process, youth shoppers may be pleasantly distracted by a mini-concert (entertainment mix) being held at the centre, thus leading to a more exciting shopping experience.
Youth Shopper Segments. The second objective of this study was to identify distinct youth shopper segments. Based on the nine image factors, four youth shopper segments were revealed, as summarised in Table 2. These four segments were labelled the ‘convenience’ shopper (23.2%), the ‘experiential’ shopper (46.4%), the ‘apathetic’ shopper (2.7%), and the ‘serious’ shopper (27.7%). Convenience shoppers placed less importance on aesthetics and entertainment, and higher importance on proximity, physical comfort and amenities. This segment appears to perceive shopping as a responsibility and their main concern is to fulfil this responsibility conveniently and comfortably. Unlike the convenience shopper, the large
‘experiential’ shopper segment emphasised the total shopping experience at regional centres, as indicated by the highest ratings of all clusters on all factors. Conversely, the small
‘apathetic’ shopper segment reported the lowest ratings on almost all factors. This youth shopper segment appears to have very little intrinsic interest in shopping and perceives shopping to be a chore. The ‘serious’ shopper placed higher importance on almost all factors, expect for aesthetics and entertainment. Similar to the convenience shopper, this youth shopper segment appears to perceive shopping to be ‘serious business’, and thus is more concerned with utilitarian than hedonistic attributes. Moreover, serious shoppers appear to be more willing to travel longer distances in order to visit their preferred shopping centre, as indicated by lesser importance on proximity.
The emergence of these four distinct youth shopper segments has provided support for the utility of entertainment as a means of shopper segmentation. The experiential segment is much more interested in entertainment than the other three segments. However, as almost fifty percent (46.4%) of youths in this survey are experiential shoppers, this would indicate that entertainment is a key attribute for attracting youth shoppers to regional shopping centres.
Limitations, Conclusion and Implications
The findings of this study were confined to one regional shopping centre in South East Queensland. Further research is required to examine the validity and reliability of the image attributes uncovered in this study when applied to other regional shopping centres, as well as other types of shopping centre. This study was confined to youth shoppers, aged 15 to 24, and thus the pattern and weighting of image attributes may differ across other demographic categories. Further, there may be some significant within-group differences, assuming that younger members of the youth shopper segment may have different attitudes with respect to the entertainment aspects of regional shopping centres than older members of the youth segment. Future research could be conducted to address within-group differences of the youth segment.
for competitive advantage (Evans 1999). Moreover, this study has indicated the utility of entertainment as a means of youth shopper segmentation by distinguishing the largest ‘entertainment’ segment (the experiential shopper) from segments who are less interested in entertainment (the convenience shopper, the serious shopper, and the apathetic shopper). Identification and understanding of these segments will assist regional shopping centre management to target the youth shopper by providing appropriate entertainment. For example, in targeting the experiential youth shoppers, centre management could create a more exciting shopping environment by offering a food court, mini-concerts or innovative video arcades.
References
Anonymous (2002), Landmark Melb project passes halfway mark, Inside Retailing, no. 1443, pp. 11.
Baker, M. (2002), Still heading for the mall [Online], Available:
http://www.icsc.org/srch/sct/sct/0602/page35.html, [11 September 2002].
Barreto, C. d. B. and Konarski, J. (1996), Shopping centres and entertainment: a typology, In
Entertainment in Shopping Centres: A Compendium of ICSC Information Resources
(Ed, ICSC) International Council of Shopping Centres, New York, pp. 3-10.
Bellenger, D., Robertson, D. and Greenberg, B. (1977), Shopping centre patronage motives,
Journal of Retailing, vol. 53, no. 2, pp. 29-38.
Dennis, C., Marsland, D. and Cockett, T. (2001), The mystery of consumer behaviour: market segmentation and shoppers' choices of shopping centres, International Journal of New Product Development & Innovation Management, vol. September/October, pp. 223-239.
Dimasi, T. and Rutherford, D. (2001), Jebb Holland Dimasi, Australia, Melbourne.
Evans, M. (1999), Let us entertain you, Journal of Property Management, vol. March/April, pp. 54-58.
Finn, A. and Louviere, J. (1996), Shopping centre image, consideration, and choice: anchor store contribution, Journal of Business Research, vol. 35, pp. 241-251.
Frasquet, M., Gil, I. and Molla, A. (2001), Shopping-centre selection modelling: a
segmentation approach, International Review of Retail, Distribution and Consumer Research, vol. 11, no. 1, pp. 23-38.
Haynes, J. and Talpade, S. (1996), Does entertainment draw shoppers? The effects of entertainment centres on shopping behaviour in malls, Journal of Shopping Centre Research, vol. 3, no. 2, pp. 29-48.
Hazel, D. (2002), How one megamall changed the industry [Online], Available:
http://www.icsc.org/srch/sct/current/page20.html, [29 May 2002].
Kaiser, H. F. (1958), The varimax criterion of analytic rotation in factor analysis,
Psychometrika, vol. 23, pp. 187-200.
Levy, M. and Weitz, B. (1998), Retailing Management, 3rd edn, McGraw-Hill, United States. Lovelock, C., Patterson, P. and Walker, R. (1998), Services Marketing: Australia and New
Zealand, Prentice Hall, Sydney, Australia.
Merrilees, B. and Miller, D. (1996), Retailing Management: A Best Practice Approach, RMIT Press, Victoria, Australia.
Merrilees, B. and Miller, D. (2001), Superstore interactivity: a new self-service paradigm of retail service?, International Journal of Retail & Distribution Management, vol. 29, no. 8, pp. 379-389.
Punj, G. and Stewart, D. (1983), Cluster analysis in marketing research: review and suggestions for application, Journal of Marketing Research, vol. 20, pp. 134-148. Reynolds, K. E., Ganesh, J. and Luckett, M. (2002), Traditional malls vs. factory outlets:
comparing shopper typologies and implications for retail strategy, Journal of Business Research, vol. 55, pp. 687-696.
Sit, J., Merrilees, B. and Birch, D. (2003), Entertainment-seeking shopping centre patrons: the missing segments, International Journal of Retail & Distribution Management, vol. forthcoming.
Smith, J. (2003), Harbour Town owners cry foul over council denial, Inside Retailing, no. 1477, pp. 8-9.
Smith, P. and Burns, D. (1996), Atmospherics and retail environments: the case of the 'power aisle', International Journal of Retail & Distribution Management, vol. 24, no. 1, pp. 7-14.
Steenkamp, J. B. and Wedel, M. (1991), Segmenting retail markets on store image using a consumer-based methodology, Journal of Retailing, vol. 67, no. 3, pp. 300-321. Tabachnick, B. G. and Fidell, L. S. (1989), Using Multivariate Statistics, 2nd, Harper Collins