EXPLORING USER SATISFACTION WITH INFORMATION SYSTEMS IN A
REGIONAL SMALL BUSINESS CONTEXT
Gerard Fogarty
University of Southern Queensland
Department of Psychology University of Southern Queensland
Toowoomba, QLD Email: fogarty@usq.edu.au
Bruce Armstrong Julian Dimbleby Southern Cross University
School of Multimedia and Information Technology Southern Cross University
Coffs Harbour, NSW Email: jdimbleb@scu.edu.au
Don Dingsdag University of Western Sydney
School of Environment and Agriculture University of Western Sydney
Richmond, NSW Email: d.dingsdag@uws.edu.au
Abstract
In 1996 Seddon and Kiew undertook a partial test of DeLone and McLean's (1992) model of Information Systems (IS) success in small business, albeit with some changes to the underlying theoretical assumptions. This paper reports the findings of a study that used the model proposed by Seddon and Kiew as the basis for a survey of small businesses on the Mid North Coast Region of New South Wales in Australia. The path model provided a good fit to the data and accounted for 42 percent of the variance in perceived system usefulness and 67 percent of the variance in user satisfaction. Implications for IS success in small business operations are discussed.
Keywords
INTRODUCTION
Rapid advances in information technologies and benefits obtainable through efficient and effective use of these technologies are rarely realised by small businesses. The managers tend to avoid the cutting edge of technology because they generally don't have the time, resources, or expertise to examine options and develop appropriate plans to incorporate technologies into their business operations (Yap et al, 1992; Thong, Yap, 1995; Burgess et al, 1997). The importance of small business to economies at all levels is well documented and the subject of considerable research (ABS, 1995; Reid, 1993; Hettihewa, 1997; Bastian & Houghton, 1997). Identifying the factors that help to determine successful adoption of information systems (IS) in small business is therefore a matter of economic significance. Before attempting to explore this research question, however, one must be sure of just what is meant by the term “IS success”.
The most obvious approach to this question is to use a variety of financial indicators to judge the extent to which the introduction of computer technology into a business has increased the profit of the business or improved its chances of success in some other way. However, the measurement of such indicators is usually confounded with many other things that are happening in the business and this approach has not really been all that successful. Ives et al. (1983, 1984) stated that this view is too simplistic to be applied to the determination of the success of information systems. They identified intangible costs and benefits, the disparate and ad hoc nature of some system types (e.g., DSS, AI), and unavailability of data on extent of system use as additional major issues that need to be addressed when examining IS success.
As an alternative to economic indicators, researchers have resorted to attitudinal scales. Such scales have a long history in the social sciences where they have been shown to have reliable relationships with objective outcome variables such as absenteeism, accident rates, workers’ compensation claims, and job turnover. There is no reason why well-constructed attitudinal scales should not prove to be equally efficacious in judging the success of IS in small business. However, the literature on this topic is small and the field becomes even smaller when the focus is shifted to IS success in small regional and rural businesses. The present study attempted to address this gap in the literature by applying a model of IS success developed in a large organizational context to a regional small businesses context. The origins of the model are described in the paragraphs that follow.
[image:2.612.142.419.547.661.2]DeLone and McLean's (1992) model of perceived success of Information Systems (IS) in small business has been used as the basis of a number of studies that examined various aspects of IS in small business. The particular contribution of these researchers was to identify the attitudinal dimensions that needed to be measured to gain an accurate picture of IS success. The six dimensions were: System Quality, Information Quality, System Use, User Satisfaction, Individual Impact, and Organizational Impact. DeLone and McLean arranged these dimensions in the form of a conceptual model showing how the dimensions interacted. The model, however, was purely conceptual. Seddon and Kiew took the model a step further when they recast it as a structural model (also called a path model). The advantage of a path model is that it can be empirically tested. With the two impact variables removed, the model is reproduced in Figure 1.
Figure 1: DeLone and McLean’s (1992) Model of IS Success
User Satisfaction System Use
The model shows System Quality and Information Quality having direct and indirect effects on System Use and User Satisfaction. The latter two variables have reciprocal effects on each other. In path analysis terms, we are talking about a non-recursive model.
In addition to recasting DeLone and McLeans conceptual model into a form that is amenable to statistical testing, Seddon and Kiew also used their judgement to make some minor changes to the model. These changes are easier to explain by comparing the graphic representations of the models. Seddon and Kiew’s model is shown in Figure 2.
Seddon and Kiew (1996) revised the DeLone and McLean model by incorporating an additional input variable which they labelled Importance of the System. This construct was introduced to enable researchers to control for task importance. The rationale provided for this change was that "systems that perform more important tasks are perceived as more useful, irrespective of the quality of the actual system" (Seddon & Kiew, 1996, p. 92). A second change involved switching the emphasis from System Use to System Usefulness. The rationale for this change was that a useful system may not have a high level of use but could still be important in a specific task context. The third change was the deletion of the reciprocal link between Usefulness and User Satisfaction. In this model (Figure 2), User Satisfaction is treated as a final outcome variable among this set of success indicators. Seddon and Kiew justified this change to the model by claiming that Satisfaction is a general measure of IS success. It was a change that made more sense when one considers that they also altered System Use to Usefulness.
A further contribution by Seddon and Kiew was the operationalisation of these five constructs. Using a variety of existing instruments, they constructed a 35-item questionnaire. The reader is referred to their article for a description of the development of this questionnaire. To test their path model, they administered their survey to 159 users of the DAS, a proprietary departmental accounting system used by their University. Results indicated that the model explained 62 percent of the variance in Usefulness and 74 percent of the variance in User Satisfaction. Fit statistics for the model, however, were poor.
Importance of the system
System Quality
Usefulness
Information
[image:3.612.121.474.201.417.2]Quality User Satisfaction
Some features of the Seddon and Kiew study suggested that it needed replication. In particular, although they used established test instruments, they combined them in a novel way and it is always important to re-establish the factorial validity of the component scales when this is done. A measurement model shown as Figure 4 in their paper suggests that the factorial validity of their scales may have been satisfactory, but not enough information is provided for the reader to judge with any certainty. A second reason for replicating the Seddon and Kiew model testing process was our own observation from the fit statistics provided in the article that the model did not provide a good fit to the data (e.g., RMSEA = .19). Indeed, the specific hypotheses that were embedded in their model seemed of greater interest to Seddon and Kiew than the overall test of the fit of their model. A third reason for replication was to assess whether their model generalised to other software packages. They examined a specific proprietary system whereas the current study examined a broader Computer-Based Information System (CBIS), which included management and planning applications, accounting applications, Small Office Home Office (SOHO) applications, internet, e-commerce and email. A fourth and final reason for replication was our interest in regional small businesses and the desire to see whether a model that was generated in a bigger organisational setting would apply to small businesses where, as noted above, the dynamics appear to be very different.
METHODOLOGY AND DATA COLLECTION
The questionnaire included many of the items used by Seddon and Kiew (1996), but the items were recast in general terms, rather than targeting a particular software package, as was the case in their study. A separate paper deals with the validation of the questionnaire used for the current study (Armstrong, Dinsdag, Fogarty, & Dimbleby, under review), so we will refrain from a detailed description here. Some general features are noted below.
Questionnaire Construction
Demographics
The questionnaire began with a series of items relating to demographic characteristics of small business. These items were used both to differentiate the sample by industry classification and to ensure that all businesses included in the sample were in fact ‘small’ as per the definition of the ABS.
System Quality (to be re-named System Usage Characteristics)
To measure System Quality, four of the items with the highest factor loadings from the Seddon and Kiew study were selected plus three additional items intended to broaden this scale to include aspects of costs and benefits.
Information Quality
Seddon and Kiew used 10 items for the measure of Information Quality. We reduced the number of items to six on the basis of factor loadings shown in their paper.
System Usefulness
Seddon and Kiew used six items to assess this construct. Inspection of factor loadings suggested a high degree of overlap among these items, so we implemented the first three and then added two new items which assessed whether the system saved time and money.
Importance of the System
Importance of the System was one of the new scales introduced by Seddon and Kiew to assess the perceived importance of the accounting function. Given the broader scope of our own instrument, we extended this section to include management and planning applications, accounting applications, SOHO applications, internet, e-commerce and email.
User Satisfaction
There were 3 items selected for inclusion in the survey as being representative of CBIS User Satisfaction in small business. Two of the questions were taken from Seddon and Kiew’s questionnaire.
Pilot Testing of Questionnaire
A trial version of the revised instrument was tested on a group of local businesses who gave feedback on the intelligibility of the questions, suitability of question format, method of administration, and so forth. Minor changes were introduced as a consequence of this pilot testing process.
Description of Sampling Process
The study targeted small wholesaling and manufacturing businesses on the Mid North Coast Region of New South Wales. They were selected from the Business Enterprise Register (BER), a database of over 13,500 businesses in the region. The Australian Bureau of Statistics (ABS) definition of small business (1995) was adopted for this study. This definition describes small manufacturing businesses as having
f
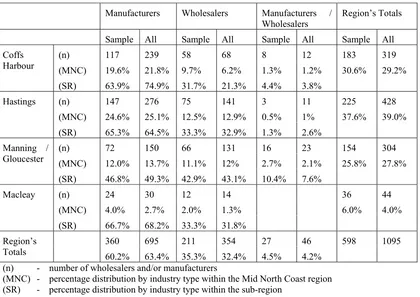
ewer than 100 employees and small wholesaling businesses as having fewer than 20 employees. The BER contained details of the number of employees. Suitable businesses were selected by listing all wholesalers and manufacturers that fell within the definition of 'small' as per the ABS. Table 1 shows the distribution of the small manufacturers and wholesalers that responded to the survey and the distribution of all manufacturers and wholesalers across the region. The Table demonstrates that the sample was representative of the population of manufacturers and wholesalers from the BER.Manufacturers Wholesalers Manufacturers /
Wholesalers Region’s Totals
Sample All Sample All Sample All Sample All
(n) 117 239 58 68 8 12 183 319
(MNC) 19.6% 21.8% 9.7% 6.2% 1.3% 1.2% 30.6% 29.2%
Coffs Harbour
(SR) 63.9% 74.9% 31.7% 21.3% 4.4% 3.8%
(n) 147 276 75 141 3 11 225 428
(MNC) 24.6% 25.1% 12.5% 12.9% 0.5% 1% 37.6% 39.0%
Hastings
(SR) 65.3% 64.5% 33.3% 32.9% 1.3% 2.6%
(n) 72 150 66 131 16 23 154 304
(MNC) 12.0% 13.7% 11.1% 12% 2.7% 2.1% 25.8% 27.8%
Manning / Gloucester
(SR) 46.8% 49.3% 42.9% 43.1% 10.4% 7.6%
(n) 24 30 12 14 36 44
(MNC) 4.0% 2.7% 2.0% 1.3% 6.0% 4.0%
Macleay
(SR) 66.7% 68.2% 33.3% 31.8%
360 695 211 354 27 46 598 1095
Region’s
Totals 60.2% 63.4% 35.3% 32.4% 4.5% 4.2%
(n) - number of wholesalers and/or manufacturers
[image:5.612.90.510.256.553.2](MNC) - percentage distribution by industry type within the Mid North Coast region (SR) - percentage distribution by industry type within the sub-region
Table 1: Distributions of Sample Population of Wholesalers and Manufacturers by Region and Sub Regions Using a type of stratified sampling technique, businesses were selected sequentially from the BER by organisation number, but ensuring that the number selected in each sub-region reflected the distribution of the total number of businesses. The main survey was administered by sending a pre-advice letter to those businesses selected to be in the sample. This letter advised them of the study and informed them that a representative of the research team would be contacting them sometime within a fortnight of their receipt of the let
t
er. Each business that was sent a pre-advice letter was contacted to ascertain its willingness to participate in the survey and to confirm that it used a CBIS to support its business functions. Businesses that indicated their willingness to participate and used a CBIS were each mailed a survey package. A total of 240 businesses from the 598 selected from the database were sent survey packages. From these businesses, 171 surveys were returned.RESULTS
included in the present study to measure Importance of the System were not unidimensional but defined three factors: Importance of Accounts, Importance of Small Home Office Operations (SOHO), and Importance of Mgmt. Apps. These three factors were retained as independent indices of system importance. Each of the factors met the base criteria for retention as follows:
• Items defining the various factors all had communalities greater than 0.25 (that is 25% or more of their variance was explained by the underlying factor);
• Extracted factors accounted for greater than 50% of the variance in their sets of items (Fornell & Larker, 1980);
• All factors had eigen-values greater than 1.0 (Loehlin, 1987); • All item loadings were greater than 0.30 (Tabachnik & Fidell, 1996); • All factors were clearly interpretable (Gorsuch, 1974).
Scales were then formed by calculating the average response at the item level and Cronbach internal consistency reliability estimates computed. Descriptive statistics and reliability estimates are reported in Table 2.
Scale Name Observations No. of Items Cronbach α Mean Std. Dev.
Information Quality 100 10 0.95 4.66 1.29
169 5 0.91 5.24 1.07
System Usefulness 101 6 0.99 3.92 1.87
169 5 0.92 5.01 1.37
System Quality 101 7 0.94 4.21 1.46
System Usage
Characteristics 169 3 0.85 4.86 1.21
System Importance 100 5 0.89 4.76 1.42
Importance of Accounts Importance of SOHO Importance of Mgmt Apps
169 169 169
6 4 3
0.78 0.73 0.78
4.30 2.81 1.16
1.79 1.63 1.53
User Satisfaction* 101 4 0.92 4.67 1.58
169 3 5.47 1.00
Key:
[image:6.612.88.524.241.512.2]Statistics from the study by Seddon and Kiew (1996) Statistics from the current study
Table 2: Descriptive Statistics and Reliabilities for Current Study Compared with Seddon & Kiew (1996) Commenting on these descriptive statistics, it can be seen that all scales had satisfactory reliability estimates. This was expected because of the prior application of factor analysis to assist with item analysis but it was nevertheless encouraging to achieve satisfactory internal consistency reliability with such small numbers of items per scale. It is also worth commenting on the summary statistics. Given that the maximum score on these scales was 7.0 and the midpoint was 4.0, we can see that the IS in these small businesses were rated as above average on Information Quality, System Usefulness, System Usage Characteristics, and User Satisfaction. They were rated as about average on Importance of Accounts and below average on Importance of Home Office Applications (SOHO) and Importance of Management Applications. These last two ratings suggest that System Importance in this study has really come down to the importance of accounts, which brings it even closer to the Seddon and Kiew study where accounting was the only function being assessed under the heading of System Importance.
TESTING THE SEDDON AND KIEW (1996) MODEL OF CBIS SUCCESS
• Seddon and Kiew modelled the individual survey items as observed variables of latent traits whereas the current study used exploratory factor analysis (EFA) to derive reliable scales that were then incorporated as observed variables.
• Seddon and Kiew drew on a construct called Importance of the System derived from specific survey items about a single system (the DAS) that was the focus of their study. We obtained three factors from the items intended to measure System Importance, one of which was Importance of Accounts. Therefore Importance of the System in the Seddon and Kiew study was theoretically equivalent to Importance of Accounts in the present study. Accordingly, it was the only one of these three scales retained for further analysis.
[image:7.612.88.487.241.425.2]• System Quality was renamed System Usage Characteristics in the current study as a more accurate description of the items comprising this scale. However we regard it as the same construct referred to as System Quality by Seddon and Kiew.
Table 3 shows the Pearson Product-Moment correlation coefficients among the scales for the current study compared with those obtained by Seddon and Kiew.
1 2 3 4 1 System Usage Characteristics /
System Quality
2 Information Quality .58
.55 3 Importance of Accounts /
System Importance
.06 .41
.19 .32
4 System Usefulness .54
.64
.57 .55
.31 .62
5 User Satisfaction .61
.71
.74 .75
.32 .44
.68 .71 BOLD - values from the current study (n = 169).
Normal - values from Seddon and Kiew (n = 94).
Table 3: Comparison of Pearson Correlation Coefficients with Seddon & Kiew (1996)
In general, despite the measurement differences noted above, there was a very high degree of similarity in the observed correlations across the two studies. Fisher Z tests were used to check for differences between correlations obtained from different samples; the only two coefficients that were different involved Importance of Accounts (.06 versus .41 and .31 versus .62). We interpret these differences in combination with the generally lower correlations for Importance of Accounts as evidence that it may not be the same construct as Seddon and Kiew’s System Importance.
Importance of Accounts/
System Importance Information
Quality
System Usage Characteristics/
System Quality
.42
System Usefulness
.67
User Satisfaction .57
.16
.14
.44 .20
.28 .22 .33
.34
[image:8.612.99.388.76.405.2]e1 e2
Figure 3: Structural Equation Model - CBIS Success
This model resulted in an excellent fit (cmin/df = 0.707). Alternative goodness-of-fit ratios also indicated very good model fit (GFI = .99, CFI = 1.000, TLI = .99, RMSEA = 0.00). All path coefficients were significant. The model explained 67% of the variance in User Satisfaction and 42% of the variance in System Usefulness. Before concluding the analyses of the Seddon and Kiew model, we also thought it worthwhile seeing how the model performed without Importance of Accounts, the dimension introduced by Seddon and Kiew to control for system relevance. The model is saturated without this variable and its associated pathways, so we could not test the fit. We do note, however, that the model explained just as much of the variance in the two outcome variables without Importance of Accounts being included. In other words, there was no incremental validity associated with this variable.
.66
Information Quality
.48
System Usage Characteristics/
System Quality
.55
System Usefulness
.83
User Satisfaction e1
e2
e3
e4
General Success .81
.69
.74
[image:9.612.103.418.94.326.2].91
Figure 4: Measurement Model for CBIS Success
Fit statistics for this model were excellent: cmin/df = 1.26; GFI = .99, CFI = .99, TLI = .99, RMSEA = .04. All factor loadings were significant.
CONCLUDING REMARKS
One of the dilemmas faced by information systems researchers is the identification of appropriate dependent variables measuring IS success. Despite changes to the questionnaire and some exploratory alterations to the model, we have finished up with more or less the same configuration advocated by DeLone and McLean, formalised as a statistical model by Seddon and Kiew (1996), and now tested on a new data set in a completely different setting. The consistencies between the studies, despite minor changes to measurement operations, means the model can be taken forward as a reliable measure of CBIS success in small business.
Our study leaves open the question of including a measure of system importance. Differences in the way in which this variable was measured in the present study and differences noted in its pattern of correlations with other variables suggests that we have not tapped the same construct. We point out, however, that neither this study nor the Seddon and Kiew study found any incremental validity associated with System Importance. The logic for its inclusion is sound but there is not yet experimental evidence to warrant its inclusion in models of CBIS success. The DeLone and McLean (1992) model is probably sufficient.
Our final set of analyses serves to remind the reader that all four DeLone and McLean variables can be reconceptualised as indicators of an underlying success trait. The logic of this conceptualisation is the logic that underlies the whole latent trait approach: the latent trait itself represents what the indicators have in common and will generally be a better measure of the construct than any single measure. Having said that, we also concede that User Satisfaction was the variable with the strongest loading in this measurement model and we would support its choice if a researcher was forced to pick a single variable as a measure of CBIS success.
REFERENCES
ABS (1995) ANZSIC Coder, ABS Catalogue No. 1290.0, Version 1994/1, Canberra, Australian Government Printing Service.
Arbuckle, J. L. (1999). Amos for Windows. Analysis of moment structures. Version 4.01. Chicago, IL: Smallwaters Corporation.
Armstrong, B., Dingsdag, D., Fogarty, G., Dimbleby, J. (2003) Information Systems Success in Small Business: Validation of Survey Instrument, unpublished paper.
Bastian, R., Houghton, K. (1997) "Building the Employment Base; Small Business Issues in Regional Australia", Proceedings of SEAANZ '97, Annual Conference, CoffsHarbour: NSW, Norsearch Ltd. Burgess, S., Belcher, B., Paull, S., Singh, M. (1997) "Information Technology and Australian Small Business
Enterprises", Proceedings of SEAANZ '97, Coffs Harbour, NSW, Norsearch Ltd.
Delone, W. H., McLean, E.R. (1992) “Information Systems Success: The Quest for the Dependent Variable”, Institute of Management Sciences.
Fornell C., Larcker (1980) ‘The Use of Canonical Correlation Analysis in Accounting Research’ Journal of Business Finance and Accounting, Vol. 7(3), pp. 455-473.
Gorsuch R.L. (1974) Factor Analysis, Philadelphia : W.B. Saunders Company.
Heikkila, J., Saarinen, T., Saaksjarvi, M. (1991). “Success of Software Packages in Small Business: An Exploratory Study.” European Journal of Information Systems 1(3): 159-169.
Ives, B., Olson, M.H., Baroudi, J.J. (1983). “The Measurement of User Information Satisfaction.” Communications of the ACM 27(10): 785-793.
Ives, B., Olson, M.H. (1984). “User Involvement and MIS Success: A Review of Research.” Management Science 30(5): 586-603.
Loehlin, J.C. (1987) Latent Variable Models: An Introduction to Factor, Path and Structural Analysis, Lawrence Erlbauin Associates: Hillsdale, New Jersey.
Reid, G. C. (1993). Small Business Enterprise: An Economic Analysis. London, Routledge.
Seddon, P. B., Kiew, M.Y. (1996). “A Partial Test and Development of DeLone and MacLean's Model of IS Success.” Australian Journal of Information Systems 4(1).
Tabachnick, B.G., Fidell, L.S. (1996) Using Multivariate Statistics, 3rd Edition, Harper Collins College Publishers, California State University: Northridge.
Thong, J. Y. L., Yap, C.S. (1995). “CEO Characteristics, Organisational Characteristics, and Information Technology Adoption in Small Business.” Omega - International Journal of Management Science 23(4): 429-442.
Yap, C. S., Soh, C.P.P., Raman, K.S. (1992). “Information Systems Success Factors in Small Business.” Omega - International Journal of Management Science 5(6): 597-609.