COMPUTERIZED CEPHALOMETRIC PROGRAMS NEMOCEPH, ONYX AND FACAD WITH CONVENTIONAL HAND TRACING METHOD
Dissertation submitted to
THE TAMILNADU DR. M.G.R.MEDICAL UNIVERSITY
In partial fulfillment for the degree of
MASTER OF DENTAL SURGERY
BRANCH V
ORTHODONTICS AND DENTOFACIAL ORTHOPAEDICS
I would like to take this opportunity to express my gratitude to everyone who has helped me through this journey.
I would like to acknowledge with a deep sense of gratitude, my respected and
beloved professor, Dr.G Rajasekar BSc M.D.S, Professor & Head, Department of
Orthodontics, Sree Mookambika Institute of Dental Sciences, Kulasekaram. I
consider myself extremely lucky to have had the opportunity to study under his
guidance. I thank him for his valuable guidance and suggestions, tireless pursuit
for perfection, immense and constant support, encouragement and keen
surveillance for the minute details throughout this dissertation.
I gladly utilize this opportunity to express my deep sense of gratitude and
indebtedness to my respected Professor Dr.P. Anilkumar, MDS, for his
everlasting inspiration, incessant encouragement, constructive criticism and
valuable suggestions conferred upon me without which this dissertation would not
have come true.
I am grateful and sincerely thankful to my teacher Dr. Shino P.Mathew, MDS,
(Reader), for his vehement personal interest, wise counsel and never ending
willingness to render generous help to me in carrying out this work from its
(Reader) for being a constant source of support and silent strength, for the gentle
reprimands and encouragement which stimulated, enthused and encouraged me in
the preparation of this main dissertation. Without his encouragement, this
dissertation would not have been completed.
Words seem less to express my deep sense of gratitude to my teacher, Dr. Ashwin
Varghese Thomas MDS (Senior Lecturer) Department of Orthodontics, for his valuable suggestions, immense and constant support and encouragement
throughout this dissertation. I thank him for all the help that has extended during
the work of the dissertation
My sincere thanks to Dr.Velayudhan Nair MS, Chairman & Dr.Rema V Nair
MD, Director, Sree Mookambika Dental College for providing me with an
opportunity to utilize the facilities available in this institution in order to conduct
this study.
I would like to gratefully acknowledge the support of Dr.Roopesh.S, M.D.S,
Professor & Head, Department of Orthodontics,PMS college of dental science and research, Trivandrum for his guidance, patience and support given to me.
My heartfelt thanks to my batchmate Dr.Rinosh Thomas, and my juniors
always been there as a pillar of strength and support every step of the way.. Life, as
I see it is only because of the love and support they have given me. And this study is
without a doubt, a result of all their sacrifice and prayers.
Last but not the least let me thank Almighty God for his abundant blessings that he
has showered upon me.
Thank you all….
No TITLE PAGE No
1.
LIST OF TABLES
2.
LIST OF GRAPHS
3.
LIST OF FIGURES
4.
ABSTRACT
5.
AIMS & OBJECTIVES
6.
INTRODUCTION
1 - 47.
REVIEW OF LITERATURE
5 - 178.
MATERIALS & METHODS
18 - 319.
RESULTS
32 - 4810.
DISCUSSION
49 – 5811.
SUMMARY & CONCLUSION
59 - 601. Table No.1 Mean values of linear measurements of different groups.
2. Table No.2 Mean values of linear measurements of different examiners using Facad.
3. Table No.3 Mean values of linear measurements of different examiners using NemoCeph.
4. Table No.4 Mean values of linear measurements of different examiners using Onyx.
5. Table No.5 Multiple comparisons of mean values of linear measurements of different groups.
6. Table No.6 Mean Values of angular measurements of two different examiners.
7. Table No.7 Mean Values of angular measurements of two different examiners.
8. Table No.8 Multiple comparison of mean values of angular measurements of different groups.
9. Table No.9 Multiple comparison of mean values of angular measurements of different groups.
[image:9.595.103.496.123.741.2]1. Graph No.1 Mean values of linear measurements of different groups.
2. Graph No.2 Mean values of linear measurements of different examiners using Facad.
3. Graph No.3 Mean values of linear measurements of different examiners using NemoCeph.
4. Graph No.4 Mean values of linear measurements of different examiners using Onyx.
5. Graph No.5 Multiple comparisons of mean values of linear measurements of different groups.
6. Graph No.6 Mean Values of angular measurements of two different examiners.
7. Graph No.7 Mean Values of angular measurements of two different examiners.
8. Graph No.8 Mean Values of angular measurements of different examiners using Facad.
9. Graph No.9 Mean Values of angular measurements of different examiners using Facad.
examiners using NemoCeph.
12. Graph No.12 Mean Values of angular measurements of different examiners using Onyx.
13. Graph No.13 Mean Values of angular measurements of different examiners using Onyx.
14. Graph No.14 Multiple comparison of mean values of angular measurements of different groups.
List Of Figures
1. Figure No.1 Cephalostat – Gendex DX GP 700™ 2. Figure No.2 Patient Positioning
3. Figure No.3 Printer – Fujifilm DryPix Lite 4. Figure No.4 Digital tracing done using Facad 5. Figure No.5 Digital tracing done using NemoCeph 6. Figure No.6 Digital tracing done using Onyx 7. Figure No.7 Cephalometric Landmarks 8. Figure No.8 Planes Used in the study
[image:12.595.103.495.231.491.2]The introduction of computerized cephalometric analytic program in treatment planning, is not only expected to decrease the incidence of individual error but also provide standardized, fast and accurate evaluation with high rate of reproducibility. Aims & Objectives : The aims and objective of the study are: 1) To compare the accuracy and reliability of three different computerized cephalometric programs Nemoceph, Onyx and Facad with conventional hand tracing method. 2) To evaluate the inter examiner error. Materials & Methods : The study was conducted on pre-treatment lateral cephalograms of
20 patients. A total of 9 angular and 5 linear parameters were considered in the study. The manual tracing was considered as control group and was compared with three computerized cephalomatric analytic program. Results : No statistically significant difference was found between manual tracing and the computerized tracing programs. The measurements obtained with the cephalometric analysis programs used in the study were reliable. When comparing the accuracy and reliability angular and linear measurements with the three different computerized softwares NemoCeph gave the most accurate and reliable results, which was followed by Facad and Onyx.
The aims and objective of the study are:
1) To compare the accuracy and reliability of three different computerized cephalometric programs Nemoceph, Onyx and Facad with conventional manual tracing method.
Page 1
The very essence of clinical orthodontics is the supervision, guidance and correction of the growing dento-facial structures2,4,9. With serial cephalometric radiographs, it is possible to study and predict the growth. It is also helpful in evaluating the changes between the pre-treatment and post treatment measurements. Cephalometric analysis can also be used to predict the surgical outcome which is important in treating dentofacial deformities1,12. For effecting the same, an accurate treatment plan is mandatory.
Cephalometric radiographs is considered to be an essential tool in the process of diagnosis, treatment plan and for the monitoring of the treatment process1.
Traditionally cephalometric analysis has been performed manually. This involves the placement of an acetate sheet over the radiograph recording the linear and angular measurement using a ruler and protractor.
Page 2
The most important source of error includes the variation in landmarks identification, errors in measurements, magnification errors4,10,13, reduction of three dimensional object to two dimensional object10.
In computer assisted cephalometric analysis the angles and the distance are automatically calculated, which can eliminate errors in drawing lines between landmarks and is measured with a protractor7.
The digital image can also be altered and the image can be processed and the visual appearance can be enhanced which can help in the identification of the landmarks7. The computer assisted cephalometric analysis decreases the need for data acquisition and for analysis7.
With the rapid evolution of computer radiography the conventional hand tracing has been slowly replaced by digital tracing. The computerized
Page 3
It also helps in the superimposition of images17 and provide the option for altering the size and contrast of the image and provides the ability to archive and improve access to images to overcome the problem of film deterioration.
Moreover patients benefits form decreased dose of radiation exposure and elimination of chemicals and associated environmental hazards.
There are also several drawbacks present . Here it represents the two dimensional representation of a three dimensional structure, so there will be difficulty in identifying the landmarks. There will be superimposition of the bilateral structures, the resolution of the image will be affected as the image is compressed36. This computerized cephalometric analysis also requires digital cephalometric radiographic machine as well as its software which is expensive.
Page 4
Page 5
Thomas J.Cangialosi et al11 evaluated the reliability of computerized prediction program Quick Ceph II11 of 30 patients pretreatment and post treatment cephalograms of patients who were treated during their active growth period . He found that the variables were virtually same for both the methods. The manual method of prediction gave a good graphical representation of the growth changes . However the computer prediction program offers the added advantages of quicker access to information and greater accuracy in procducing the tracing.
D.B.Forsyth et al18stated that the digital imaging have lots of advantages over the conventional cephalometry . The advantages include ease of storage , transmission and enhancement of images. It also reduces the exposure of radiation to the patients .
Darwood11 suggested that due to improved image quality18 and other advantages18 of digital radiography, the conventional radiographs will become obsolete and will be replaced by digital images.
Page 6
greater than the conventional one. So he suggested that in case of digital imaging a pixel matrix larger than 512 X 512 with more than 64 gray levels19 is required for obtaining a diagnostic quality of the original radiograph.
D.J.Rudolph et al20 used spatial spectroscopy20 for automatic computer identification of cephalometric landmarks. The result showed that there is no statistical difference in mean landmark identification error between manual identification and automatic identification using spatial spectroscopy.
Jia-Kuang liu et al22 showed that computerized cephalometric software can be used for identification of landmarks and for determination of angular measurement. From his study he suggested that the error between manual and computerized identification of landmarks were not significantly different for 5 of 13 landmarks : sella, nasion, porion, orbitlale and gnathion.
Page 7
statistically significant. Statistically significant differences of inter-observer errors between two modalities were only found for 4 of the 19 land marks.
Yoshihide et al24 developed a 3D cephalometric system that corrected not only for magnification of the image, but also 3D cephalic malpositioning during cephalogram exposure. Study was conducted and the accuracy unaffected by the cephalic revolution in any direction and standard errors was within 0.8mm in any orthodontic landmark. So it was suggested that this measure system would have sufficient accuracy for clinical application.
P.J.Turner25 evaluated the reproducibility of land mark identification using scanned cephalometric images in which cephalometric images where scanned and these images where displayed on the monitor for point identification and for subsequent analysis using software. The reproducibility of the points where compared with commonly used methods. It was found that Screenceph is sufficiently accurate to use in a clinical setting but it is not sufficiently exact for use in research projects.
Page 8
significant difference in the co-ordinates of the different landmarks and between the same landmark on different cephalograms.
Yi-Jane Chen et al29 assessed the concordance between cephalometric measurement derived from landmark identified on digitized cephalograms in comparison with those from original radiographs. It was found that the differences of all cephalometric measurement between original radiographs and their digitized counter parts were statistically significant but clinically acceptable. The interobserver errors for cephalometric measurement on our digitized cephalomteric images are generally comparable with those on the original radiographs.
Ssu-Kuang Chen et al 30 calculated the time required by a clinician to perform the analysis in a conventional manner and also estimated the time using a computerized assisted digital cephalometric analysis system, and the accuracy of the system was also checked. In conclusion it was found that the computerized assisted digital cephalometric analysis system reduces the time needed for cephalometric analysis. It can also help to reduce the human error which occurs during the manual measuring produced in the traditional cephalometric analysis.
Page 9
digital images. His study showed distortion between the original and the scanned images showed 0.8 mm vertical enlargement and 0.4 mm horizontal reduction. The printed radiographs showed had 1.1 mm vertical and 0.4 mm horizontal enlargement. All difference were statistically significant.
Although some distortion was found the relative small horizontal and vertical discrepancies were deemed clinically insignificant31.
Korkmaz et al36 evaluated the errors in analysis using hand tracing with computerized method. The lateral cephalogram was traced manually by two operators and it was also processed by the same two operators using Dolphin imaging software. The result was each operator consistent in repeated measurements. The angles, maxillary height, maxillary depth, y-axis, FMA, nasolabial angle and distance N perpendicular to point A had a wider reliability interval and lower correlation than the parameter tested.
It was concluded that the use of computer software for cephalometric analysis done in scanned images does not increase the measurement errors when compared with hand tracing36.
Page 10
Dustin Roden-Johnson38 investigated the variation of landmark identification between film and digital cephalometric tracing and compared the ability of Quick Ceph 2000 to measure the linear and angular measurement with the hand tracing method and compared the quick Ceph 2000 superimposition to the hand traced method of super imposition. It was found that there was no difference in cephalometric land mark identification made manually and digitally.
Erkan Celik et al42 evaluated the accuracy and reliability of angular and linear cephalometric measurements using computerized method with conventional hand tracing method. The digital cephalometric system used was the Vistadent 2.1 and Jiffy Orthodontics Evaluation software program.
The result was that most of the variables showed consistency between the three methods except for nasolabial angle, ANS – Me, APFH, N perpendicular – Pg, Go – Me, and U1 – NA measurements. It also indicated that most of the cephalometric measurement were highly reproducible with direct digital radiographs using Vistadent as well as with print outs using both JOE and hand tracing20.
Page 11
images of lateral cephalograms with quality factors 100, 80 & 60 did not show any alteration in the reproducibility of identification of landmarks when compare with the DICOM format.
T Sommer et al45 evaluated the precision of the cephalometric analysis using orthodontic software Orthometric45 in two mode: in fully automatic mode without any help by the user and semiautomatic with manual determination of all cephalometric landmarks. It was concluded that the fully automatic determination of the cephalometric landmarks has led to relevant erros , so its mandatory to check all automatically set landmarks and should be corrected if necessary.
Julia Naoumova et al46 compared the accuracy of cephalometric measurement made with digital tracing software FACAD with equilvalent hand traced measurement. From his study it was concluded that the results of two investigated tracing methods are similar and the computerized digital software FACAD is reliable and can be used routinely.
Page 12
No significant difference were found between the two method in the measurement of treatment changes.
Tancan Uysal et al 48 evaluated intra-examiner repeatability and inter-examiner reproducibility of landmarks using two cepholometric analyzing techniques. 11 angular and 6 linear parameters were traced and measured by two examiners using manual method and Dolphin image software. It was found that both operators were generally consistent in repeated measurements. For one examiner the difference for Na – A (p < 0.001), Na – Pog and U1 – Na (p < 0.01) distance measured were found to be statistically significant. Intra-examiner repeatability of land marks both with Dolphin and manual technique showed high correlation coefficient. While the inter-examiner reproducibility of landmark was unacceptable, measurement errors with the manual technique were generally comparable with the Dolphin technique.
Thurzo A et al49 compared the manual and digital cephalometric analyses and came to the conclusion that the validity and reproducibility of analyses carried out manually and digitally is in high mutual correlation and therefore the software analysis can be fully substitute the manual method.
Page 13
inter and intra observer results. He obtained both angular and linear measurements . From his study he concluded that confidence can be increased in tracing obtained form computer-assisted cephalometric analysis, as the discrepancies found between inter and intra observer tracing , both manual and computerized were mostly statistically significant.
Georgios Tsorovas et al51 compared hand tracing and computerized cephalometric analysis program with and without advanced features to find out the accuracy and time demands. Out of the 23 measurement he tested for each procedure L1 to NB showed better agreement with hand tracing , when the advanced features were used 20 showed good agreement with hand tracing foe both basic and advanced features. Two measurements showed poor intra – user reproducibility. The hand tracing took a significantly longer time for both basic and advanced features.
Page 14
errors for both observers. Except for SN – FH interobserver agreement was good. It was concluded that the appropriate measuring errors of cephalmetric measurements by maen of the smallest detectable difference is necessary to find the true difference between the start and end of active treatment. Depending on the magnitude of clinical significance, the measuring error was possibly clinically significant for all variables tested and therefore quesstons the use of these variables to detect the true treatment effects.
Page 15
statistically significant. The greatest amount of magnification was found at the Nasion – Menton distance which was located at the farthest distance form the central X-ray beam in the lateral cephalogram.
Mustafa Erkan et al54 compared the traditional method of manual cephalometirc tracing with four different computerized tracing program. The four computerized tracing program used are Dolphin Imaging, Vistadent, Nemoceph and Quick Ceph. It was found that no statistically significant difference was found between manual tracing and the computerized tracing program. The measurements obtained with the cephalometric analysis program used in the study were reliable.
Juliane Marcela Guimaraes da Silva et al55 compared conventional lateral cephalogram with the digital one. Ricketts cephalometric analysis was performed on both convention and digital radiographs. After statistical analysis, it was found that there was no significant difference between digital radiographs and conventional radiographs. There was high correlation between the techniques.
Page 16
cephlometric methods. His study showed a high level of reliability in 88% of the evaluated variables. The Anterior cranial length and corpus length was found to have a low level of reliability. It was concluded that computerized analysis is reliable and advantageous with respect to time, archiving and enhancement of radiographs.
Parmjit Singh et al57 compared the conventional hand tracing manual method with a picture archiving and communication system. The aim of the study was to evaluate the cephalometric measurement made on the screen using PACS compared with the conventional hand tracing method. Six angular and four linear parameters were measured. He concluded that for electronic method SNB and lower incisor angle were the only parameters found to be significantly different between the two operators for hand tracing method. All the measurements were comparable between the two methods. This study would suggest that using PACS may be an acceptable method for obtaining cephalometric measurement for treatment planning.
Page 17
of 6 weeks. The reproducibility of the methods were calculated. It was found that in both the methods of conventional and digital cephalometric analysis are highly reliable. Although the reproducibility of the two methods showed some statistically significant difference , difference were not clinically significant.
Page 18
The aim of this present study was to compare the accuracy and reliability of three different computerized cephalometric analytic program keeping the conventional manual tracing method as standardized, as well as to evaluate inter observer values.
The study was conducted on pre-treatment lateral cephalograms of 20 patients. No differentiation was made for age or gender. Only good quality radiographs without any artifacts were selected.
Page 19
THE CRITERIA’S FOR SELECTION OF LATERAL
CEPHALOGRAM
Full complement of teeth upto second molar should be essentially present.
Absence of any periapical pathologies.
The radiographs should be devoid of any artifacts .
The dentition should be in centric occlusion and the lips should be in a relaxed position
No craniofacial deformity or asymmetry.
There should not be any excess soft tissue that could potentially interfere with location of anatomical points.
CEPHALOSTAT :
The cephalostat used was Gendex DX GP 700™ provided by Gendex, Pennsylvania. The distance between the patients head and the x-ray source in cephalometric unit is 5 feet. The exposure parameters of the lateral
Page 20
I. MANUAL TRACING
a. Acetate tracing sheet of 0.003 inch thickness b. 0.5 mm lead pencil ( HB )
c. Illuminated viewing screen d. Tracing table
e. Measuring devices – ruler, sets square, protractor.
METHOD OF CONVENTIONAL HAND TRACING
Conventional hand tracing was performed in a darkened room using an illuminated viewing screen. The x-ray was secured to the surface of the viewing box and a sheet of fine transparent acetate paper of 0.003 inches was taped over the x ray.
Page 21
The following three digital computerized tracing software were used a) NemoCeph
b) Facad c) Onyx
a) NEMOCEPH NX 2006 (Nemotec, Madrid, Spain)
Configuration of the system used:
OPERATING SYSTEM - Windows 7
PROCESSOR - Intel core i3 processor
RAM - 2 GB
b) FACAD VERSION 3.3.1
Configuration of the system used:
OPERATING SYSTEM - Windows 7
PROCESSOR - Intel pentium 4 processor
Page 22
Configuration of the system used:
OPERATING SYSTEM - Windows 7
PROCESSOR - Intel® core™ i5
RAM - 6 GB
All the digital images were directly imported into software programs, which automatically generates measurements after digitizing a set of landmarks.
All the images were calibrated by digitizing two points on the ruler which is inbuilt in the cephalostat.
Once the digital images were directly imported into the software programs the landmarks were located using the cross-hair tool available with each softwares, with the help of the mouse.
Page 23
CONSTITUTION OF TEST GROUP:
In the present study, the samples were categorized into four groups:
Group I - Comprise of the mean values of hand tracing performed
by examiner I and examiner II.
Group II - Tracing performed using computerized software Facad
Group III - Tracing performed using computerized software
Nemoceph.
Group IV - Tracing performed using computerized software Onyx.
Groups Tracing
Group-I Hand Tracing (Mean of
Examiner 1 & 2)
Group-II FACAD Software
Group-III NEMO CEPH Software
Page 24
PARAMETERS USED IN THE STUDY :
The aim of this present study was to evaluate and compare the accuracy and reliability of three different computerized cephalometric analytic program keeping the conventional hand tracing method as standardized, as well as to evaluate the inter observer variation.
For evaluating this 9 angular measurements and 5 linear measurements were considered.
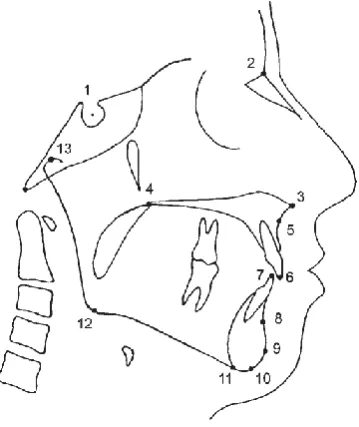
THE CEPHALOMETRIC LANDMARKS USED IN THIS STUDY:
[image:43.595.211.391.418.632.2]
Page 25
– Condylion (Co), 14 – Articulare (Ar), 15 – Porion (po), 16 – Orbitale (Or), 17 – Upper incisor axis (UI), 18 – Lower incisor axis (LI)
Planes Used In the Study:
[image:44.595.156.399.294.557.2]
Page 26
ANGULAR MEASUREMENTS
SNA Anteroposterior position of the maxilla relative to the anterior cranial base
SNB Anteroposterior position of the mandible relative to the anterior cranial base
ANB The difference between SNA and SNB angles and defines the mutual
SN – MP The angle formed between the SN plane and the mandibular plane
SN – PP The angle formed between the SN plane and the palatal plane
PP – MP The angle formed between the palatal plane and the mandibular plane
Gonial Angle The angle between mandibular plane and ramal plane Upper Incisor to SN The angle formed between the long axis of upper
central incisor and the anterior cranial base Lower incisor to
mandibular plane
Page 27
LINEAR MEASUREMENTS
Anterior Cranial Base ( N – S ) The linear distance from sella turcica and anterior point of the frontonasal suture Mandibular Body Length ( Go –
Gn)
Linear distance from gonion and gnathion
LAFH The lower anterior facial height, linear distance from ANS to menton
Upper incisor to NA Linear measurement form the labial aspect of upper incisor to NA
Lower incisor to NB Linear measurement form the labial aspect of lower incisor to NB
PICTORIAL REPRESENTS THE ANGULAR MEASUREMENTS :
a) Skeletal Angular Measurements: 1: SNA, 2: SNB, 3: ANB, 5: SN-Mandibular Plane, 6: SN-Palatal Plane, 7: PP-MP, 8: Gonial Angle. b) Dental Angular Measurements: 1: U1 – SN, 2: L1 – MP
Page 28
c
MANUAL TRACING
Page 29
Tracing was carried out using 0.5 mm HB lead pencil, landmarks were identified by a single point, in a predetermined order. For bilateral structures and double images the mid-point was chosen by construction. After point identification linear and angular measurements (tracing) were made.
Hand tracing was carried out and the by two different examiners to evaluate inter observer results. Then the linear and angular measurements were evaluated.
ELIMINATION OF INTER EXAMINER VARIATIONS:
In this study the values of hand tracing was considered as the control group. The 20 lateral cephalograms were manually traced by two examiners to prevent the inter examiner error. The data was analysed using students “ t ” test for inter group comparisons. The mean value of the two examiners were taken and was considered as the value for control group.
COMPUTERIZED DIGITAL TRACING:
Page 30
were located using the cross-hair tool available with each softwares, with the help of the mouse.
During the process of identification of the landmarks digital image enhancing functions like magnification, brightness and contrast were used. Once the landmarks were marked the software analysed the tracing and the values for nine angular and 5 linear measurements were generated. This was done for 20 x-rays with three analytical software namely Nemo Ceph, Facad and Onyx.
To evaluate the intra examiner error, the landmarks of six digital lateral cephalogram were traced by six operator using each software. The data was analysed by students “ t “ test for intergroup comparison.
ELIMINATION OF ERROR (FOR COMPUTERIZED DIGITAL
TRACING):
Page 31
Page 32
RESULTS
The present study involved the evaluation and comparison of the accuracy and reliability of three different computerized cephalometric analytic program keeping the conventional hand tracing method as standardized, as well as to evaluate the interobserver variation. For evaluating this 9 angular measurements and 5 linear measurements were considered.
In the present study, the samples were categorized into four groups:
Group I - Comprise of the mean values of hand tracing performed
by examiner I and examiner II.
Group II - Tracing performed using computerized software Facad
Group III - Tracing performed using computerized software
Nemoceph.
Page 33
used to find significant difference between the groups. ANOVA was used for statistical analysis. Post Hoc test, followed by Dunnet‟s test was used for multiple comparisons. P < 0.05 between groups was considered statistically significant at 95% of confidence interval.
The accuracy and reliability of inter group comparison (done by examiner I & examiner II) for manual tracing was statistically analyzed using student „ t „ test.
Table 1, indicates the comparison of linear measurements of examiner I and examiner II, the P value is > 0.05 which shows there is no statistically significant difference between examiner I and examiner II and the mean value of the two examiners were calculated. This is represented in graph I.
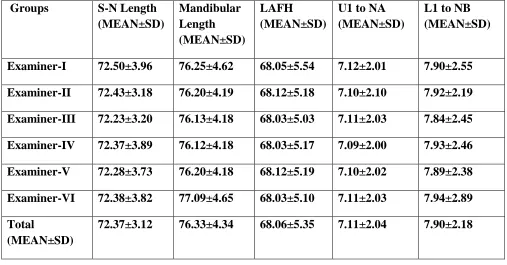
Table 2, shows the comparison of linear measurements of six examiners using the computerized software Facad. There is no statistically significant difference between the six examiners as the P > 0.05 and their mean value was compared. This is represented in Graph 2 .
Page 34
examiners using the computerized software Onyx. There is no statistically significant difference between the six examiners as the P > 0.05 and their mean value was compared. This is represented in Graph 4.
Table 5, explains multiple comparison of linear measurements of different groups. In this groups comparison the P value for all the groups was >0.05, its considered there is no significant difference between the groups. Here there was a numerical difference between the groups but it is not statistically significant difference. This is shown in Graph 5.
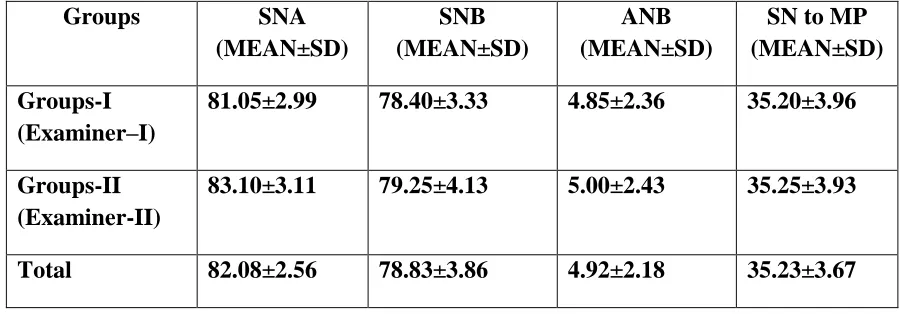
Table 6 & 7, indicates the comparison of angular measurements between two different examiners, it was observed that the P value is > 0.05 which shows there is no statistically significant difference. This is represented in graph 6 & 7.
Graph 8 & 9, shows the mean values of angular measurements of six examiners using the computerized software Facad. When the mean values are computed there was no statistically significant difference between the six examiners.
Page 35
when the P value was calculated.
Graph 12 & 13, shows the mean values of angular measurements of six examiners using the computerized software Onyx. When the mean values are computed there was no statistically significant difference between the six examiners.
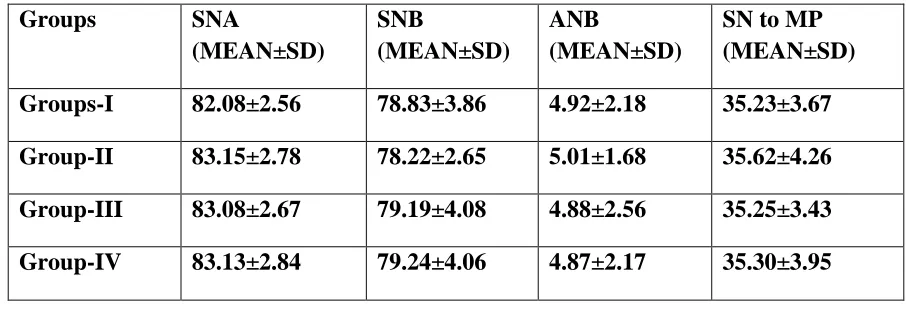
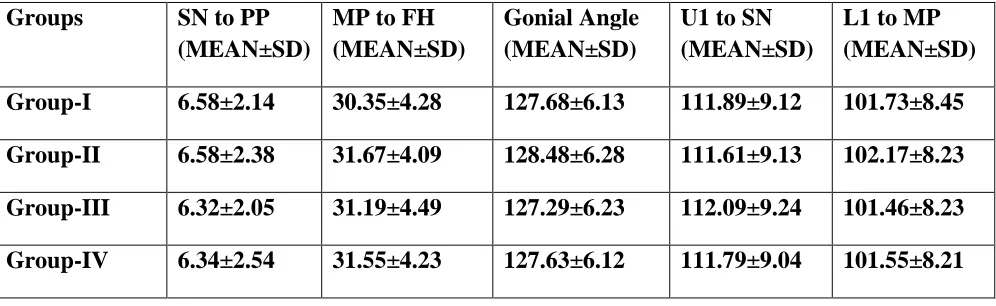
Table 8 & 9, shows the multiple comparison between manual tracing with three different computerized analytic programs, the mean values of all the groups were analysed statistically, it was observed there was no statistical difference between the groups. The P values of between the group comparison given more than 0.05 which was considered statistically insignificant at 95% confidence interval. Which is represented in graph 14 & 15.
Page 36
Graph-1: Mean values of linear measurements (mm) of different groups
Page 37
Graph-3: Mean values of linear measurements of different examiners using NEMO CEPH software
Page 38
Graph-5: Multiple comparisons of mean values of linear measurements of different groups
Page 39
Graph-7: Mean values of angular measurements of two different examiners
Page 40
Graph-9: Mean values of angular measurements of different examiners using FACAD software
Graph-10: Mean values of angular measurements of different examiners using NEMO CEPH software
Page 41
Graph-11: Mean values of angular measurements of different examiners using NEMO CEPH software
Page 42
Graph-13: Mean values of angular measurements of different examiners using ONYX software
(No significant difference compared between the examiners)
Page 43
Page 44
Table-1: Mean values of linear measurements (mm) of different groups
Groups S-N Length
(MEAN±SD) Mandibular Length (MEAN±SD) LAFH (MEAN±SD)
U1 to NA (MEAN±SD)
L1 to NB (MEAN±SD)
Group-I 71.60±3.95 75.40±4.80 67.85±5.34 7.05±1.96 7.85±2.74
Group-II 71.50±4.08 75.25±4.83 67.95±5.49 7.00±2.10 7.75±2.34
Total 71.55±3.67 75.33±4.97 67.90±5.12 7.03±1.89 7.80±2.18
Table-2: Mean values of linear measurements of different examiners using FACAD software
Groups S-N Length
(MEAN±SD) Mandibular Length (MEAN±SD) LAFH (MEAN±SD)
U1 to NA (MEAN±SD)
L1 to NB (MEAN±SD)
Examiner-I 72.50±3.96 76.25±4.62 68.05±5.54 7.12±2.01 7.90±2.55
Examiner-II 72.43±3.18 76.20±4.19 68.12±5.18 7.10±2.10 7.92±2.19
Examiner-III 72.23±3.20 76.13±4.18 68.03±5.03 7.11±2.03 7.84±2.45
Examiner-IV 72.37±3.89 76.12±4.18 68.03±5.17 7.09±2.00 7.93±2.46
Examiner-V 72.28±3.73 76.20±4.18 68.12±5.19 7.10±2.02 7.89±2.38
Examiner-VI 72.38±3.82 77.09±4.65 68.03±5.10 7.11±2.03 7.94±2.89
Total
(MEAN±SD)
[image:66.612.65.572.397.662.2]Page 45
Table-3: Mean values of linear measurements of different examiners using NEMO CEPH software
Groups S-N Length
(MEAN±SD) Mandibular Length (MEAN±SD) LAFH (MEAN±SD)
U1 to NA (MEAN±SD)
L1 to NB (MEAN±SD)
Examiner-I 71.50±4.08 75.25±4.83 67.95±5.49 7.00±2.10 7.75±2.33
Examiner-II 71.42±4.94 75.12±4.56 67.84±5.38 7.03±2.19 7.68±2.89
Examiner-III 71.52±4.19 75.20±4.19 67.90±5.32 7.00±1.04 7.67±2.10
Examiner-IV 71.23±4.00 75.31±4.89 67.34±5.23 6.99±2.95 7.34±2.01
Examiner-V 71.43±4.92 75.03±4.12 67.83±5.23 7.03±2.56 7.70±1.94
Examiner-VI 71.34±4.04 75.20±3.97 67.46±5.10 7.02±2.19 7.53±2.19
Total
(MEAN±SD)
71.41±4.89 75.19±4.05 67.72±5.18 7.01±2.78 7.51±2.05
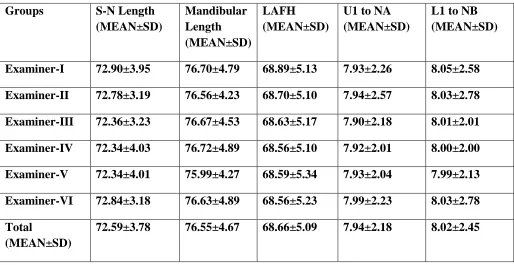
Table-4: Mean values of linear measurements of different examiners using ONYX software
Groups S-N Length
(MEAN±SD) Mandibular Length (MEAN±SD) LAFH (MEAN±SD)
U1 to NA (MEAN±SD)
L1 to NB (MEAN±SD)
Examiner-I 72.90±3.95 76.70±4.79 68.89±5.13 7.93±2.26 8.05±2.58
Examiner-II 72.78±3.19 76.56±4.23 68.70±5.10 7.94±2.57 8.03±2.78
Examiner-III 72.36±3.23 76.67±4.53 68.63±5.17 7.90±2.18 8.01±2.01
Examiner-IV 72.34±4.03 76.72±4.89 68.56±5.10 7.92±2.01 8.00±2.00
Examiner-V 72.34±4.01 75.99±4.27 68.59±5.34 7.93±2.04 7.99±2.13
Examiner-VI 72.84±3.18 76.63±4.89 68.56±5.23 7.99±2.23 8.03±2.78
Total
(MEAN±SD)
[image:67.612.67.581.438.703.2]Page 46
Table-5: Multiple comparisons of mean values of linear measurements of different groups
Groups S-N Length
(MEAN±SD) Mandibular Length (MEAN±SD) LAFH (MEAN±SD)
U1 to NA (MEAN±SD)
L1 to NB (MEAN±SD)
Group-I 71.55±3.67 75.33±4.97 67.90±5.12 7.03±1.89 7.80±2.18
Group-II 72.37±3.12 76.33±4.34 68.06±5.35 7.11±2.04 7.90±2.18
Group-III 71.41±4.89 75.19±4.05 67.72±5.18 7.01±2.78 7.51±2.05
Group-IV 72.59±3.78 76.55±4.67 68.66±5.09 7.94±2.18 8.02±2.45
Table-6: Mean values of angular measurements of two different examiners
Groups SNA
(MEAN±SD)
SNB (MEAN±SD)
ANB (MEAN±SD)
SN to MP (MEAN±SD)
Groups-I (Examiner–I)
81.05±2.99 78.40±3.33 4.85±2.36 35.20±3.96
Groups-II (Examiner-II)
83.10±3.11 79.25±4.13 5.00±2.43 35.25±3.93
[image:68.612.80.530.459.616.2]Page 47
Table-7: Mean values of angular measurements of two different examiners
Groups SN to PP
(MEAN±SD)
MP to FH (MEAN±SD)
Gonial Angle (MEAN±SD)
U1 to SN (MEAN±SD)
L1 to MP (MEAN±SD)
Group-I (Examiner-I)
6.55±2.50 30.40±4.51 127.75±6.40 111.67±9.26 101.65±8.63
Group-II (Examiner-II)
6.60±2.50 30.30±4.63 127.60±6.36 112.10±9.01 101.80±8.67
[image:69.612.78.531.463.620.2]Total 6.58±2.14 30.35±4.28 127.68±6.13 111.89±9.12 101.73±8.45
Table-8 : Multiple comparison of mean values of angular measurements of different groups
Groups SNA
(MEAN±SD)
SNB
(MEAN±SD)
ANB
(MEAN±SD)
SN to MP (MEAN±SD)
Groups-I 82.08±2.56 78.83±3.86 4.92±2.18 35.23±3.67
Group-II 83.15±2.78 78.22±2.65 5.01±1.68 35.62±4.26
Group-III 83.08±2.67 79.19±4.08 4.88±2.56 35.25±3.43
Page 48
Table-9: Multiple comparison of mean values of angular measurements of different groups
Groups SN to PP
(MEAN±SD)
MP to FH (MEAN±SD)
Gonial Angle (MEAN±SD)
U1 to SN (MEAN±SD)
L1 to MP (MEAN±SD)
Group-I 6.58±2.14 30.35±4.28 127.68±6.13 111.89±9.12 101.73±8.45
Group-II 6.58±2.38 31.67±4.09 128.48±6.28 111.61±9.13 102.17±8.23
Group-III 6.32±2.05 31.19±4.49 127.29±6.23 112.09±9.24 101.46±8.23
Page 49
DISCUSSION
Lateral cephalograms continue to be one of the orthodontic records which provide vital information about the sagittal and vertical relation of the craniofacial skeleton, soft tissue profile, dentition, airway and cervical vertebrae. The structures and their relationships to each other were scrutinized by means of linear and angular measurements as well as by the use of ratios based on the various cephalometric landmarks1.
Conventionally, cephalometric evaluation was done manually using acetate overlays on the cephalogram and measuring the linear and angular measurement manually. This technique bore some advantages in that it was easy to follow, economical and did not need any special equipment.
Page 50
manual analysis is more and depends on how comprehensive the measurements are, and on the operator‟s skill of identifying the landmarks30.
To overcome the shortcomings of the conventional tracing technique, computerized cephalometric systems were introduced into clinical orthodontics. This technique is being used extensively for diagnosis, treatment evaluation and simulation of treatment outcomes. The process requires 10% of time of a normal manual registration because it is only necessary to digitize the radiographic points directly on the cephalogram30 .The advantages the calculations are done within no time. This process removes human error except for errors of landmark identification. Ssu – kuang Chen et al30 showed that computerized analysis can reduce the human errors introduced during manual measuring procedure.
Page 51
radiation exposure with conventional and direct digital cephalometric radiography. Absorbed dose from conventional radiography was approximately 2 fold higher than digital radiographic unit. Exposure errors can be corrected and images can be enhanced using different techniques inorder to provide more precise landmark identification.
There are also several drawbacks present . Here it represents the two dimensional representation of a three dimensional structure, so there will be difficulty in identifying the landmarks. There will be superimposition of the bilateral structures, the resolution of the image will be affected as the image is compressed36. This computerized cephalometric analysis also requires digital cephalometric radiographic machine as well as its software which is expensive. Inspite of all these shortcomings
The increasing use of digital cephalometrics has highlighted the need to evaluate the accuracy of the new computerized software programs and compare them with traditional manual measurement technique. Several studies have examined the performance of commercially available software programs used for cephalometric analysis.
Page 52
accuracy of individual measurements and time demands.
Sheldon Baumrind et al3 reported that conventional cephalometric analysis have magnification, tracing, measuring, recording and landmark identification to be the major source of error. Most studies evaluating the accuracy of on-screen computer tracing software have transferred conventional cephalometric film to a digital format by scanning, a procedure that may result in image distortion. Bruntz et al35 found both vertical and horizontal distortion when analogue film was converted to digital format using a scanner and he concluded that use of digital cephalometrics in orthodontic clinics are becoming more wide spread and direct transfer of images to a computer database can be done. Ralf kurt Willy et al37 showed that effective magnification was larger for the digital images but the average difference was entirely below 1. Inorder to eliminate errors due to magnification, the present study was based on digital radiographs rather than scanned images.
Page 53
Mustafa Erkan54 inferred that inter-examiner error was greater than intraexaminer error. So the manual tracing was performed by two examiners, examiner 1 and examiner II. There angular and linear measurements and is represented in table 1 and table 6. There mean values where taken and was considered as the control group. The values of examiner I and examiner II didn‟t show statistical significance. The data was analyzed using SPSS (16.0) version. Student “t” test was used to find significant difference between the groups. P < 0.05 between groups was considered statistically significant at 95% of confidence interval.
The accuracy and reliability of inter group comparison (done by examiner I & examiner II) for manual tracing was statistically analyzed using student „ t „ test.
Table 1, indicates the comparison of linear measurements of examiner I and examiner II, the P value is > 0.05 which shows there is no statistically significant difference between examiner I and examiner II and the mean value of the two examiners were calculated. This is represented in graph I.
Page 54
The accuracy of cephalometric analysis is important for treatment planning so that the clinician can correctly assess the various treatment options. Landmark identification is highly affected by operator experience, which might be as important as the tracing method itself. As the interoperator error has been found to be greater than intraoperator error, landmark identification for six lateral cephalogram on all the three computerized cephalometric software was performed by six operators.
There angular and linear measurements was analyzed using SPSS (16.0) version. ANOVA was used for statistical analysis. Post Hoc test, followed by Dunnet‟s test was used for multiple comparisons. P < 0.05 between groups was considered statistically significant at 95% of confidence interval.
The multiple group comparison of three computerized cephalometric software is analyzed using SPSS (16.0) version. ANOVA was used for statistical analysis. Post Hoc test, followed by Dunnet‟s test was used for multiple comparisons. P < 0.05 between groups was considered statistically significant at 95% of confidence interval.
Page 55
study group. ANOVA was used for statistical analysis. Post Hoc test, followed by Dunnet‟s test was used for multiple comparisons. P < 0.05 between groups was considered statistically significant at 95% of confidence interval.
The multiple comparison of the mean values (Table 5) of linear measurements of digital tracing with Facad (group II), it showed that the mandibular length and lower anterior facial height showed much variation from the control group whereas S-N length, U1 to NA, L1 to NB didn‟t show much variation from the hand tracing. Previous studies on conventional and computerized methods have found difficulties in locating landmarks gonion and gnathion47.
Page 56
away from the mid-sagittal plane.
The multiple comparison of the mean values (Table 5) of linear measurements of digital tracing with Nemoceph (Group III), the mean values were more close to the control group. The values showed that the mandibular length and lower anterior facial height showed much variation form the control group whereas S-N length, U1 to NA, L1 to NB didn‟t show much variation from the hand tracing. But when it was compared with Group II it was found that it was more accurate and reliable. The multiple comparison of the groups are shown in graph 5.
The multiple comparisons of the mean values (Table 8 & 9) of angular measurements of digital tracing with Nemoceph (Group III), the mean values were more close to the control group. There was a greater deviation in the mean values of SN to MP, MP to FH, Gonial angle and lower incisor to MP. But when these values are compared with the values of group II it is found that it is more reliable than the group II as these values are more close to the control group.
Page 57
ANB, SN – MP, gonial angle, L1 to PM, FMA, SN-PP which showed deviation in mean values from the control group. The greatest deviation was noted for MP to FH, goinial angle, L1 to MP and SN to MP. Its because of difficulties in landmark location due to superimposition of anatomical structures. Due to image enhancement techniques available now such difficulties were not found with this study. In this study all the parameters showed a greater deviation of the mean from the control group.
The multiple comparisons of the mean values (Table 5) of linear measurements of digital tracing with Onyx (Group IV), showed a greater deviation in the mean values when compared with the control group. Significant difference was observed with a greater deviation was noted in mandibular length and lower anterior facial height. It is mainly due to the difficulty in landmarks. The deviation in mandibular length occurred due to difficulty in identifying the land marks gonion and gnathion where as the error for lower anterior facial height occurred due to difficulty in identifying the landmarks ANS and menton.
Page 58
showed significant differences in the mean values but statistically it was insignificant. The reason for significant difference with gonial angle occurred as the point gonion cannot be constructed in digital tracing as done in manual tracing. Significant difference with SNA were due to difficulty in locating point A which is located on poorly defined outline.
Time taken by the manual tracing was approximately ten times greater than all the 5 digital tracing softwares. Study by Ssu-Kuang Chen et al30 showed similar result and revealed that even an experienced clinician needed more than 25 minutes to perform entire analysis by traditional method whereas computerized method can reduce the time needed.
Page 59
The aim of the study was to evaluate and compare the accuracy and reliability of three different computerized cephalometric analytic program namely Nemoceph, Facad & Onyx. For the present study conventional hand tracing method was considered as the control group, this study also evaluates the interobserver variation. The parameters used in this study consist of 9 angular measurements and 5 linear measurements.
In the present study, the samples were categorized into four groups. Group I - Comprises of the mean values of hand tracing performed by examiner I and examiner II, Group II – consists of values of tracing performed using computerized software Facad, Group III – comprises of values of tracing performed using computerized software Nemoceph and Group IV- contains the values of tracing performed using computerized
software Onyx.
Page 60
The mean values of angular & linear measurements of Group II, Group III, and Group IV were compared with the Group I which was considered as the control group.
Dunnet’s test was used for multiple comparisons. P < 0.05 between groups was considered statistically significant at 95% of confidence interval. Multiple comparison was done with all the study group, and the result was P value > 0.05 which showed there is no statistically significance difference between the group.
From the study we come to the conclusion that all the three computerized analytic software can be used for the cephalometric analytic purpose as there is no statistically significance between the three groups.
Page 61
1) Mills J R E 1970 The application and importance of cephalometry in orthodontic treatment . The Orthodontist 2 : 32 – 42.
2) Baumrind S, Frantz R C 1971 The reliability of head film measurements 1. Landmark Identification. American Journal of Orthodontics 60 : 111 – 127
3) Sheldon Baumrind ,Robert C.Frantz ; The reliability of head film measurement , 2) Conventional angular & linear measures . AJO, Vol 60 , Num 2 , August 1971.
4) Ricketts RM. Perspectives in the clinical application of cephalometircs. The first fifty years. Angle Orthod 1981; 51:115- 150
5) Broch J , Slagsvold O , Rosler M 1981 Error in landmark identification in lateral radiographic head plates . European Journal of Orthodontics 3 : 9 – 13
6) Cohen A M 1984 Uncertainty in cephalometrics. British Journal of Orthodontics 11 : 44 – 48
7) Jackson P H, Dickson G C, Birnie D J 1985 Digital image processing of cephalometric radiographs: a preliminary report. British Journal of Orthodontics 12: 122–132.
Page 62
Aust Orthod J 1987; 10: 98–104.
10)Sandler PJ. Reproducibility of cephalometric measurements. Br J Orthod 1988; 15: 105–110.
11)Darwood.R ; Digital Radiography – A realistic prospect ? . Clinical radiology 1990; 42: 6 – 11.
12)Vig K D , Ellis E 1990 Diagnosis and treatment planning for the surgical-orthodontic patient . Dental Clinics of North America 34 : 316 – 384.
13)Cooke M S , Wei S H Y 1991 Cephalometric errors: a comparison between repeat measurements and retaken radiographs . Australian Dental Journal 36 : 38 – 43.
14) Oliver RG. Cephalometric analysis comparing five different methods. Br J Orthod 1991; 18: 277–283.
15)Thomas J. Cangialosi , Jessica M.Chung , David F.Ellioot , Malcolm E. Meistrell ; Reliability of computer generated prediction tracing , The Angle Orthodontist, Vol 65, No 4, 1995.
16) Melsen B, Baumrind S. Clinical research application of cephalometric In: Athanasiou A, editor. Orthodontic cephalometry. St Louis, MO: Mosby-Wolfe, 1995, pp 181–202.
Page 63
cephalometric radilgraphy, Part 1 : Advantages & limitations of digital imaging , The Angle Orthodontist , Vol 66, No 1, 1996.
19)D.B.Forsyth , W.C.Shaw , S.Richmond ; Digital imaging of cephalometric radiography, Part 2 : Image Quality , The Angle Orthodontist , Vol 66, No 1, 1996.
20)D.J.Rudolph , P.M.Sinclair , J.M.Coggins ; Automatic computerized radiographic identification of cephalmetric landmarks , AJODO , Feb 1998.
21) Geelen W, Wenzel A, Gotfredsen E, Kruger M, Hansson LG. Reproducibility of cephalometric landmarks on conventional film, hardcopy and monitor-displayed images obtained by the storage phosphor technique. Eur J Orthod 1998; 20: 331–340.
22)Jai-Kuang Liu , Yen-Ting , Kuo-Shen Cheng ; Accuracy of computerized automatic identification of cephalometric landmarks , AJODO, Nov 2000.
23) Chen YJ, Chen SK, Chang HF, Chen KC. Comparison of landmark identification in traditional versus computer-aided digital cephalometry. Angle Orthod 2000; 70: 387–392.
Page 64
Orthodontics, Vol 28, 2001, 143-149.
25)P.J.Turner , S.Weerakone ; An evaluation of the reproducibility of landmark identification using scanned cephalometric images , Journal of orthodontics , Vol.28 , 2001 , 221-229.
26)A.Kamoen , L.Dermaut , R.Verbeeck ; The clinical significance of error measurement in the interpretation of treatment results , European journal of orthodontics 23 (2001),569-578.
27) Ongkosuwito EM, Katsaros C, van’t Hof MA, Bodegom JC, Kuijpers-Jagtman AM. The reproducibility of cephalometric measurements: a comparison of analogue and digital methods. Eur J Orthod 2002; 24: 655–665.
28) Gregston MD, Kula T, Hardman P, Glaros A, Kula K. A comparison of conventional and digital radiographic methods and cephalometric analysis software: I. hard tissue. Semin Orthod 2004; 10: 204–211. 29)Yi-Jane Chen , Ssu-Kuang Chen , Jane Chung-Chen Yao , Hsin-Fu
Chang ; The effects of differences in landmark identification on the cephalometric measurements in traditional versus digitized cephalometry , Angle Orthodontist , Vol 74, No.2, 2004.
computer-Page 65
Vol 74, No 4 , 2004.
31)Lance Q.Bruntz , J.Martin Palomo , Sally Baden , Mark.G.Hans ; A comparison of scanned lateral cephalograms with corresponding original radiographs , AJODO , Vol 130, Number 3, 2004.
32) Cohen JM. Comparing digital and conventional cephalometric radiographs. Am J Orthod Dentofacial Orthop 2005; 128: 157–160. 33) Gossett CB, Preston CB, Dunford R, Lampasso J. Prediction accuracy
of computer-assisted surgical visual treatment objectives as compared with conventional visual treatment objectives. J Oral Maxillofac Surg 2005; 63: 609–617.
34)Power G, Breckon J, Sherriff M, McDonald F. Dolphin Imaging Software: an analysis of the accuracy of cephalometric digitization and orthognathic prediction. Int J Oral Maxillofac Surg 2005; 34: 619–626. 35) Bruntz LQ, Palomo JM, Baden S, Hans MG. A comparison of scanned lateral cephalograms with corresponding original radiographs Am J Orthod Dentofacial Orthop 2006; 130: 340–348.
Page 66
cephalometric measurements on scanned cephalometric images and conventional tracings. Eur J Orthod 2007; 29: 105–108.
38)C Szuhanek, E schiller, F Glavan ; Digital age in cephalomtric analysis, European cell & materials , Vol 16, suppl 5, 2008.
39)Dustin Roden – Johnson, Jeryl English, Ronald Gallerano ; Comparision of hand traced and computerized cephalograms : Landmark identification , measurement and superimposition accuracy. AJODO, 2008, Vol 133, number 4.
40)Polat-Ozsoy O, Gokcelik A, Toygar Memikoglu TU. Differences in cephalometric measurements: a comparison of digital versus hand-tracing methods. Eur J Orthod 2009; 31: 254–259.
41) Naoumova J, Lindman R. A comparison of manual traced images and corresponding scanned radiographs digitally traced. Eur J Orthod 2009; 31: 247–253.
42) Uysal T, Baysal A, Yagci A. Evaluation of speed, repeatability and reproducibility of digital radiography with manual versus computer- assisted cephalometric analyses. Eur J Orthod 2009; 31: 523–528. 43) Celik E, Polat-Ozsoy O, Toygar Memikoglu TU. Comparison of
Page 67
G.Dalben, E.K.Sannomiya ; Effects of image compression of digital lateral cephalograms on the reproducibility of cephalometric points. Dentomaxillofacial Radiology (2009) 38, 393 – 400.
45)T.Sommer, R.Ciesielski, J.Erbersdobler, W.Orthuber, H.Fischer-Brandies ; Precision of cephalometric analysis Via fully and semiautomatic evaluation of digital lateral cephalographs . Dentomaxillofacial Radiology (2009) 38, 401 – 406.
46)Julia Naoumova, Rolf Lindman ; A comparison of manual traced images and corresponding scanned radiographs digitally traced. European journal of orthodontics 31 (2009) 247 – 253.
47)Omur Polat-Ozsoy, Aylin Gokcelik, T.Ufuk Toygar Memikoglu ; Differences in cephalometric measurements : A comparison of digital versus hand tracing methods. European journal of orthodontics 31 (2009) 254 – 259.
Page 68
Valkovic L, Makovnik M ; Digital and manual cephalometric analysis . BratislLekListy, 2010; 111 (2): 97 – 100.
50)Priscila de Araujo Guedes, July Erika Nascimento de Souza, Fabricio Mesquita Tuji, Enio Mauricio Nery ; A comparative study of manual Vs Computerized cephalometric analysis . Dental Press Journal Of Orthod, Vol 5, No 2, Mar/April 2010.
51)Georgios Tsorovas, Agneta Linder-Aronson Karsten ; Comparison of hand-tracing and cephalometric analysis computer programs with and without advanced features – Accuracy and time demands . European journal of orthodontics 32 (2010) 721 – 728.
52)Janalt Damatra, James J.R.Huddleston Slater, Zacharias Fourie, Yijin Ren ; Reliability and the smallest detectable difference of lateral cephalometirc measurements. AJODO , Nov 2010.
53)Huseyin Olmez , Serkan Gorgulu, Erol Akin , Ali Osman Bengi, Ibrahi, Tekdemir, FAtih Ors ; Measurement accuracy of a computer-assisted three-dimensional analysis and a conventional two dimensional method. Angle orthodontist , Vol 81, No.3, 2011.
Page 69
Roberto Hiroshi Matsui, Miriam Yumi Matsui, Monica Fernandes Gomes ; Comparative study between conventional and digital radiography in cephalometric analysis. European journal of orthodontics , April 18, 2011.
56)Kenan Cavdar, Semra Ciger, Aslihan Zeynep ; A comparision of conventional and computerized cephalometric methods . Clinical dentistry and research 2011: 35(1): 33 – 40.
57)Parmjit Sihgn , Terence lan Davies ; A comparision of cephalometric measurements : A picture archiving and communication system verses the hand-tracing method – A preliminary Study . European journal of orthodontics 33 (2011) 350 – 353.
58)S.F. AlBarakati, K.S. Kula, A.A.Ghoneima ; The reliability and reproducibility of cephalometric mearurements : A comparision of conventional and digital methods. Dentomaxillofacial Rdiology (2012) 41 , 11 – 17.