University of Southern Queensland
Faculty of Engineering and Surveying
Assessment of the feasibility of a terrestrial scanner in
underground and surface mining at BHPB Cannington
mine
A dissertation submitted by
Paul Tozer
In fulfilment of the requirements of
Courses ENG4111 and ENG 4112 Research Project
towards the graduate diploma of
Geomatic Studies (Geographic Information Systems)
Abstract
Terrestrial laser scanners are becoming more and more a part of the surveying industry. The high speed, remote capture of considerable amounts of quality data has made the scanner an attractive and valuable surveying instrument.
University of Southern Queensland
Faculty of Engineering and Surveying
ENG4111 & ENG4112
Research Project
Limitations of Use
Article I. The Council of
the University of Southern Queensland, its Faculty of Engineering and Surveying, and the staff of the University of Southern Queensland, do not accept any responsibility for the truth, accuracy or completeness of material contained within or associated with this dissertation.
Persons using all or any part of this material do so at their own risk, and not at the risk of the Council of the University of Southern Queensland, its Faculty of Engineering and Surveying or the staff of the University of Southern Queensland.
This dissertation reports an educational exercise and has no purpose or validity beyond this exercise. The sole purpose of the course pair entitled "Research Project" is to contribute to the overall education within the student’s chosen degree program. This document, the associated hardware, software, drawings, and other material set out in the associated appendices should not be used for any other purpose: if they are so used, it is entirely at the risk of the user.
Prof G Baker
Dean
Certification
I certify that the ideas, designs and experimental work, results, analyses and conclusions set out in this dissertation are entirely my own effort, except where otherwise indicated and acknowledged.
I further certify that the work is original and has not been previously submitted for assessment in any other course or institution, except where specifically stated.
Paul Tozer
Student Number:
___________________________________________________
Signature
Acknowledgements
The author wishes to acknowledge the support and advice given by BHP Billiton and Lester Franks Survey and Geographic Pty Ltd.
Contents
Abstract i
Disclaimer Page ii
Certification Page iii
Acknowledgements iv
Contents v
List of Figures viii
List of Tables x
Chapter 1 Introduction
1.1 Introduction...1
1.2 Background ...1
1.3 Justification ...2
1.4 Aim ...3
1.5 Objectives ...3
1.6 Research approach ...3
1.7 Resource analysis...5
1.8 Timeline ...5
1.9 Safety Issues...6
1.10 Consequential effects ...6
Chapter 2 Literature Review 2.1. Scanner theory ...8
2.1.2 Basic Theory ...8
2.1.3 Scanner Properties...9
2.1.4 Reflectivity...10
2.2 Computing and software ...10
2.4 Uses and benefits ...11
2.5 Traditional underground survey practice ...12
2.6 Conclusion ...12
Chapter 3 Research Methods 3.1 Introduction...13
3.2 Equipment ...13
3.3 Initial problems ...16
3.4 Surveys...18
3.4.1 Stope survey...18
3.4.2 Drive survey...21
3.4.3 Surface stockpile survey ...23
3.5 Data registration and processing ...24
Chapter 4 Results and Analysis 4.1 Introduction...26
4.2 Practical function ...26
4.2.1 Survey times - Set up ...26
4.2.2 Survey times – Data gathering ...31
4.2.3 Logistics...32
4.2.4 Safety aspects...33
4.2.5 Reliability...34
4.3 Data ...35
4.3.1 Data quantity...35
4.3.2 Data accuracy and usefulness ...36
Chapter 5 Discussion and Recommendation 5.1 Discussion ...44
Chapter 6 Conclusion and Further work
6.1 Conclusion ...48
6.2 Further work...48
References...49
Appendix A Project Specification A1
Appendix B Safe work instruction B1
Appendix C Job safety analysis C1
List of Figures
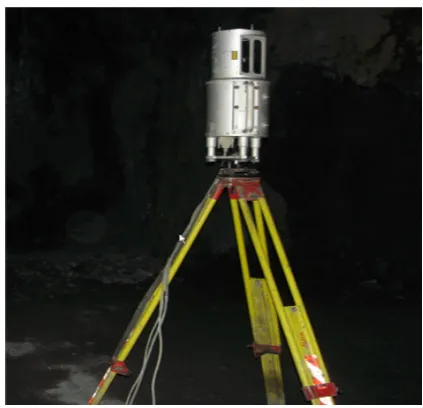
Figure 3.1 Photograph of Riegl LMS-z210
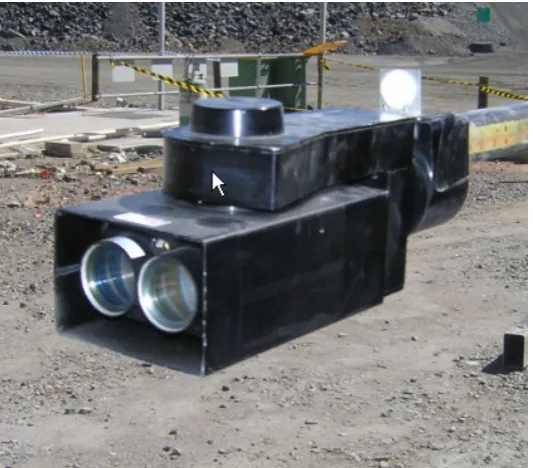
Figure 3.2 Photograph of Optech Cavity Monitoring System (CMS)
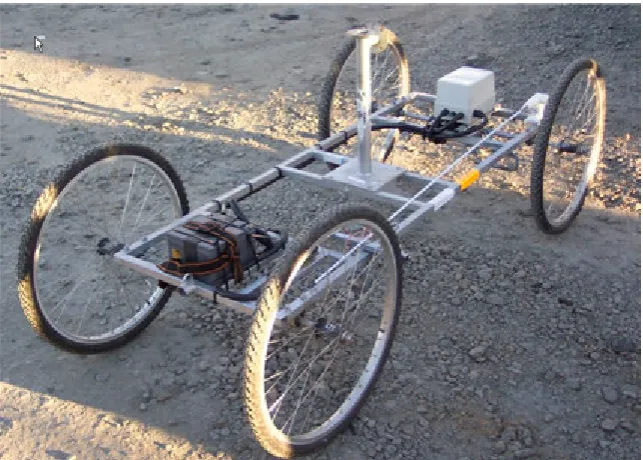
Figure 3.3 Photograph of CMS trolley
Figure 3.4 Photograph of mobile equipment bracket
Figure 3.5 Photograph of base plate
Figure 3.6 Photograph of scanner in lateral position on CMS trolley
Figure 3.7 Photograph of scanner in longitudinal position on CMS trolley
Figure 3.8 Photograph of CMS on CMS trolley
Figure 3.9 Photograph of scanner in drive 280 Level C0 XC
Figure 3.10 Photograph of scanner on surface stockpile
Figure 3.11 Voidworks screen capture of data registration
Figure 4.1 Bar graph of survey set up times
Figure 4.2 Voidworks screen capture of scan data shadow in 3597hl stope
Figure 4.3 Voidworks screen capture of scan data 280 Level C0 XC
Figure 4.4 Bar graph of survey data gathering times
Figure 4.7 Voidworks screen capture of sections of drive 280 Level C0 XC
Figure 4.8 Voidworks screen capture of extent of data capture (light vehicle)
Figure 4.9 Voidworks screen capture of drive 280 Level C0 XC ‘loop wrap’
Figure 4.10 Voidworks screen capture of x-section of drive 280 Level C0 XC
Figure 4.11 Voidworks screen capture of x-section of drive 280 Level C0 XC
Figure 4.12 Voidworks screen capture of surface stockpile survey
Figure 4.13 Voidworks screen capture of section of fibrecrete thickness
List of Tables
1.1: Project time line
4.5 Instrument weights
Chapter 1
Introduction
1.1
Introduction
As terrestrial laser scanners are decreasing in cost, albeit slowly, and software processing is improving, the quantum leap of this technology compared to traditional survey methods is starting to become feasible and attractive to surveyors. Scanners have proved that in normal operational circumstances they are incomparable to traditional survey methods, i.e. total station and GPS, in the quantity and quality of data they capture This project will look at the feasibility of using a scanner in an underground environment compared to traditional survey methods.
1.2
Background
Cannington mine is an underground lead, silver and zinc mine in north-west Queensland which produces about 3 million tones of ore a year. The method of mining is sub level open stoping which produces open stopes ( large holes underground) which are on average about 20m x 20m x 50m. There is no access to these stopes as ground conditions are too dangerous so stopes are surveyed by using a cavity monitoring system (CMS). The CMS is a very basic scanner which can be attached to booms and pushed out into the stope. Once the stope is finished and surveyed it is filled with paste (concrete and tailings) for ground control and to enable mining next to it.
Drives are surveyed to form digital terrain models (DTM) for design purposes. This survey involves the pick up, with a total station, of the drive wall, floor, and shoulders and backs (roof).
1.3 Justification
To justify the undertaking of this project the possible benefits of using a scanner need to be identified.
The CMS which is currently used to do stope surveys is comparatively slow compared to scanner data acquisition rates. The CMS will take one and a half hours to complete a single scan of a stope. During that time it gathers about fifty thousand points to an accuracy which is not much better than 0.1 m. This can cause problems with orientation of the surveyed stope where its position is needed to be known accurately for further design and reconciliation. The CMS technology is over 20 years old although it has had a few improvements over the last year but they are prone to faults and more often than not have to be returned for service. It is anticipated that a scanner will be faster and more accurate than a CMS. This will save time not only in terms of manpower but in time spent around the stope. It is also hoped that the detail and possibly reflectance of the data obtained from the scan will be of use to geotechnical engineers in terms of locating fault lines, water and paste contacts. The increased accuracy and density of the data will enable better orientation and modeling of the stope which will be of benefit to reconciliation and future design.
DTM modeling of drives is another area where a scanner may be of use. The density and detail of a scan or several scans of a drive will give vastly more detail than traditional methods and will result in improved modeling which will lead to design improvements. Again the great detail may be of use to geologists and geotechnical engineers if faults and different rock types can be detected. It is also anticipated that a scan of a drive could be used as quality assurance with regards to ground control. At Cannington, when a face is fired it is usually fibrecreted which is basically a concrete and fibre mix which is sprayed on the backs to support it. The thickness of this fibrecrete is an issue in terms of safety and cost. It is hoped that a scan before and after the fibrecrete thickness will enable an analysis of the fibrecrete to be made.
stockpiles. It is anticipated that a scanner could be used for this surface work as well as for underground surveys. It is hoped that it will decrease the time of field work therefore decreasing manpower and increase the data density and accuracy which will improve the model and volume calculation.
1.4 Aim
The aim of this project is to investigate the feasibility of using a laser scanner at BHPBilliton Cannington underground mine to replace some traditional survey methods.
1.5 Objectives
• Research scanners on the market • Select those scanners suitable for trial • Arrange for scanners to come to site
• Select and organize areas for trials to be carried out
• Carry out trials using both scanner and traditional methods • Process jobs
• Analyze and compare surveys • Discuss Results
• Conclusion and recommendation
1.6
Research approach
secured arrangements for it to travel to site will be needed. As this is a fly in fly out (FIFO) operation this will take a little planning.
As identified in the project justification, the two areas underground where a scanners capability would like to be trialed are in stope surveys and drive pickups. The best method to trial the scanner would be by a direct comparison with traditional methods. This will involve, in a stope survey, carrying out a survey with the scanner and then directly after with the CMS on the same stope. During both surveys time, safety and job difficulties will be recorded. With regards to drive pickups a section of suitable drive will be located and the same direct comparison as the stope surveys will be used. The scanner will be used and then a total station will be used to pick up the drive. Another survey will be carried out on a face before and after fibrecreting and again direct comparison will be used. A surface trial would like to be conducted on the stockpiles. Only one stockpile will be surveyed as all that is needed is an indication of its ability. Again both the scanner and a total station will be used to survey the same stockpile. If time permits a survey of the concentrate sheds will be done. This is essentially the same type of survey as a stockpile survey but it will be a good survey to test the scanner in dusty conditions.
Once the surveys have been completed the jobs will be processed and results compiled into a format where direct comparisons of data can be made i.e. the data may be looked at in its raw form or DTM’s may be created from the data which may involve data filtering and editing. Analysis and discussion of the results will be made with regard to time for survey, manpower, ease of survey, safety aspects, data quantity and quality, ease of processing and geo-referencing, size of raw data files, size of processed files, final model stope shape and usefulness of the scans. This is not a restricted list and other criteria may be noticed during the project which will need to be addressed.
1.7 Resource Analysis
It is anticipated that this project will have significant resource requirements as scanner technology is relatively expensive compared to traditional surveying methods. There are sufficient funds in the budget to cover scanner and software hire as BHP Billiton have allocated funds. However all efforts will be made to reduce costs not only from an ethical point of view but also for the validity of the project.
Obviously the major resource for this project is the scanner and software hire. There will be some planning and organization needed to locate scanners and arrange them to come to site. As mentioned Cannington is a FIFO site so there will be additional cost in freight and if personnel are to accompany the scanner then their travel and accommodation will have to be met. One source for the scanner hire has been located and arrangements have been made. Work is continuing to locate another suitable scanner for hire.
There may be the need to manufacture brackets for the scanner to sit on and other mechanical or electrical and computing problems may arise but this shouldn’t be a problem as Cannington is a self-contained site.
1.8 Timeline
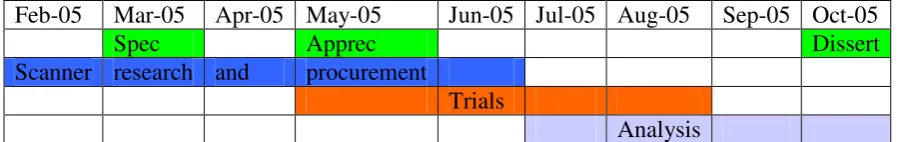
[image:16.595.106.556.609.680.2]As there is still quite a lot to organize definite timings are not possible. Figure 1 is an indication of how the project will hopefully progress and gives good notice of when the different tasks should be completed or at least well underway.
Table 1.1 Project time line
Feb-05 Mar-05 Apr-05 May-05 Jun-05 Jul-05 Aug-05 Sep-05 Oct-05
Spec Apprec Dissert
Scanner research and procurement Trials
Analysis
1.9 Safety Issues
Underground mine surveying is inherently dangerous and there are procedures and systems in place and strictly adhered to minimize these risks. For each task that will be performed underground there is a safe work instruction (SWI) refer appendix B. These are the basic procedures and tasks to perform the task safely and although they are for using traditional survey equipment the risks and hazards will be same. Before each task is begun there will be a job safety analysis (JSA) done. As mine conditions and hazards change from day to day this will be carried out a day before the surveys when location and personnel requirements are known. A JSA is included in appendix C. Immediately before each task is begun personnel must complete a ‘Take 5’. This is a simple safety procedure in place to basically get people to think of what they are about to do. It works on the initials STIPP. Stop, Think, Identify, Plan, And Proceed. There is a tick off check list to be completed as part of the Take 5.
1.10 Consequential effects
Sustainability
Mining is not really compatible with sustainability as mining is about getting as much ore out of the ground as quickly and as cheaply as you can. However there are some aspects of sustainability associated with this project. There could be a potential for scanners to reduce the labour requirements for mine surveying. While this could result in job losses it is more likely that reduction in labour requirements would mean that there would be more time for other tasks and while the physical surveying requirements are reduced processing requirements may increase.
Ethical responsibility
As surveyors there is a responsibility to develop our skills, knowledge and expertise throughout our careers. There is also a responsibility to our employers to apply our skills and knowledge with their best interests in mind. However we should only apply our skills and knowledge within our areas of competence. This project will develop our skills and knowledge but there is a responsibility to fully understand the technology. It is hoped that this new technology will improve spatial knowledge at BHPBilliton Cannington mine and in doing so improve the overall performance of the mine. However scanning technology is expensive and this project will hopefully justify whether this cost is a benefit or not to the mine.
Chapter 2
Literature Review
2.1 Scanner Theory
2.1.1 Basic Theory
Terrestrial laser scanners are for most people a new and unfamiliar technology author included. Therefore It was necessary to research and review literature on the basic theory of scanners.
A series of lectures given at the University of New South Wales 3-D laser scanning workshop by Lichti (2002) provides a fair introduction to scanners. These lectures are in an overhead format so much of it is in point format only but a reasonable portion of information can be obtained from them. Lichti gives a simple explanation of the most common type of scanner, the pulsed laser or time of flight. This type of scanner emits a brief pulse of laser light which when, it strikes a surface, part of the beam is reflected and the time of flight recorded. He goes on to explain that scanners use equal angle increment (EAI) where it deflects the emitted laser beam by means of a rotating mirror in equal increments of arc in both the horizontal and vertical plane. This together with the distance measurement produces millions of 3-D points.
A classification of terrestrial lasers is given by Fröhlich & Mettenleiter. They classify lasers according to their principle of distance measurement systems. They identify 3 types of scanner with, time of flight principle, phase measurement principle and optical triangulation as their distance measurement system. They then summarize each type of scanner into range, accuracy and manufacturer. They agree with Lichti (2002) that the most common terrestrial laser uses the pulse or time of flight principle of measurement. This is an excellent introduction to scanners as straight away you can start to eliminate, by manufacturer, scanners which do not meet or are in excess to your requirements in terms of range and accuracy.
Schulz and Ingensand (2004) offer a good definition of laser scanning. In their introduction they describe laser scanning as the deflection of a laser beam by sweeping or rotating mirrors.
Greaves (2004) has an excellent article on scanners and offers an explanation on how scanners work in simple but concise terms. He explains how the reflected laser beam is not directly reflected but only a tiny amount is reflected back to the scanner. He offers the analogy of trying to hear someone whispering across the room while a jumbo jet is taking off 50m away. This he says are why scanners are so expensive.
2.1.2 Scanner Properties
Lichti (2002) neatly sums up the salient scanner properties which are directly relevant for this project and which I list here and some are worthy of further research.
• Accuracy/ precision: Boehler et al (2003) paper on investigating scanner
accuracy gives a good introduction to the kind of errors that may be prevalent in scanners and how they can be investigated. They then go on to test a number of different scanners and show the results of these tests which provide good information for potential purchasers. According to Boehler et al (2003) factors affecting scanner accuracy depend on angular accuracy, range accuracy, resolution and edge effects. Range and angular accuracy can be tested by scanning known targets and comparing the results. Resolution refers to the ability to detect small objects in the point cloud and is dependant on the equal angle increment (EAI) of the scanner and the size of the laser point. Edge effects relate to the fact that a laser point is not a perfect point and will have some size. When this point hits an edge some of it will be reflected and some will proceed on and be reflected from something behind the edge. Kersten et al (2004) paper
describes in some detail the accuracy tests they carried out on their scanner and would be a good example to obtain ideas from for your own tests.
• Scan Extents: This refers to the field of view of the scanner. Greaves (2005)
provides a good explanation of scan extents and its importance.
• Georeferencing method: This refers to how the scan is tied into your coordinate
system.
• Laser wavelength
2.1.3 Reflectivity
As the majority of the scanning for this project is to be carried out underground in dark and sometimes wet conditions some research on reflectivity was thought relevant. Lichti and Harvey (2002) conducted a detailed investigation on the effects of surface reflectivity on a time of flight of laser. They experimented on different types of material both wet and dry and discovered no significant errors in measurement but did discover changes in return signal intensity.
2.2 Computing and software
Brown (2004) in her article quotes Spar Point’s Tom Greaves who comments on computer and software requirements for scanners. He comments that some computers are ‘maxing’out in their ability to handle the large amounts of data that scanners produce and that these data sets are probably going to continue to grow. He describes good software as being able to handle multiply scans, be intuitive to use and provide fast navigation around dense point clouds. He also raises the questions of storage and transfer capabilities. Brown (2004) later describes the wish list for software to be better integration between tools from various vendors and better option for importing point clouds into a CAD environment.
Lichti (2002) states the minimum computing power needed to process surveys done from a scanner. He states that a 2.2GHz central processing unit, 756 Mb RAM and a 120 Gb hard drive is needed. A 64 Mb graphics card and a large monitor are also necessary.
Studio can be used with different scanners and not just the I-site scanners. From the Leica web site the cyclone information can be viewed. Again this does the job of selling the product to you but it isn’t as clearly and well presented as the I-site advertising. It is worth to note that cyclone has been developed specifically for the Leica scanners.
Point of Beginning (2004) has carried out an extremely useful and comprehensive survey on scanner software. It compares and contrasts scanner software using a comprehensive list of criteria including computer hardware requirements and is also one of the few publications that include the cost of the software.
2.3 Scanners on the market
Point of Beginning (2004) also carried out a survey of scanners in the market for 2004. This is a very useful publication as it not only alerts the reader to the scanners that are available but also compares and contrasts them with a comprehensive and salient list of criteria. It includes the scanner performance, environmental factors and power supplies and weight of the instrument. Unfortunately they do not include the cost of the scanners. Obviously each manufacturer has its own web site which does its best to sell its products. Appendix D contains pages are from the Reigl website about the technical specifications of the LMS-z210 which is the scanner that was selected for this project.
2.4 Uses and benefits
Jenkins (2004b) reports on the as constructed surveys on the Boston central artery tunnel. The survey department decided to invest in scanners to complete the as constructed surveys which resulted in an estimated 2 million dollar saving. The scanner let them capture exact minimum clearances which would have been difficult using traditional methods. There was also the safety aspect of keeping the crews away from the roads.
Spar Point research (2004) reports on the survey of an open pit mine which had to be surveyed for a realignment of a highway. Again this is a good article to expose the benefits of a scanner. The key benefits were data completeness and accuracy and worker safety.
2.5 Traditional underground survey practice
The optech web site who sells the CMS (Cavity monitoring System) has general information and uses of the CMS. It is an informative site and gives an indication of the problems involved with stope surveys.
Lupton’s article offers some good diagrams of stopes surveyed by CMS and explains why accurate surveys of stopes are necessary.
Cannington procedures on drive modeling are difficult to follow without surpac knowledge. However the general idea can be deciphered and it gives a good indication of the actual data needed to be surveyed underground.
2.6 Conclusion
Chapter 3
Research Methods
3.1Introduction
After the relevant research on scanner technology, availability and costs were completed it was decided the best option was to arrange for the hire of a scanner and operator through a survey company who perform scanner surveys. The scanner was on site for three days in which time both underground and surface surveys were performed with the scanner and by traditional methods.
3.2 Equipment
Scanner Hire
[image:24.595.219.431.508.712.2]The scanner used in the trials was the Riegl LMS-z210. This was hired with an operator from Lester Franks Survey and Geographic Pty Ltd based in Adelaide, South Australia. The company’s Tasmanian operation has had some experience in underground surveying but unfortunately the underground experienced operator and extra equipment they used underground, a bracket to attach the scanner to mobile equipment, were unable to be brought to site.
Optech Cavity Monitoring System (CMS)
[image:25.595.194.461.257.491.2]The CMS, figure 3.2, is currently used at Cannington to perform stope surveys. Cannington has two CMS’s and performs on average 3-4 stope surveys per month. The reason for having two CMS’s is not the amount of work but due to the fact that more often than not one CMS has broken down and is away to be repaired. Cannington uses two methods to physically place the CMS inside the stope they are by boom and trolley. Placement of the CMS inside the stope is the most dangerous and critical part of the survey as good placement is necessary to avoid shadows in the collected data.
Figure 3.2: Photograph of the CMS head on the surface at Cannington mine.
CMS Booms
CMS Trolley
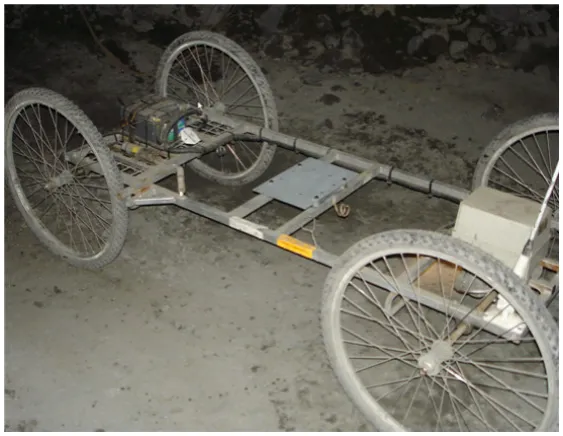
[image:26.595.166.488.174.404.2]The CMS trolley, figure 3.3, is a Cannington invention. The trolley is a remote controlled battery operated unit on which the CMS is attached and propelled out into the bottom of the stope.
Figure 3.3: Photograph of the CMS trolley designed by Cannington.
Leica TCRA 1103
The Leica reflector less total Station, TCRA 1103, is used at Cannington both underground and on the surface. Underground it is used for survey control and for pickups of the development drives from which the digital terrain models (DTM) are created. Amongst other things on the surface it is used for surface stockpile pick ups for volume reports.
Surpac
Lsard
Lsard is the software used to download and process the CMS surveys.
I-site Studio
I-site Studio is a high end scanner software that accepts scan data from a number of different scanners. This software was used by the contractor to download the scan data from the Riegl LMS-z210 in a .3di format.
I-site Voidworks
Cannington has started using I-site Voidworks software to model its stopes in the past year. Voidworks is a cheaper lighter version of Studio that is made by Isite. Previously Surpac was used to model stopes but with Voidworks superior modelling, data handling, manipulation and visualisation properties it was decided to use Voidworks. The registration and orientation of stopes is handled much easier and faster with Voidworks. It is hoped that Cannington will upgrade this year to Isite’s Studio software which is software for most scanner data so if a scanner were eventually purchased the software requirements would be minimal.
3.3 Initial Problems
Before even going underground, on inspection of the contractor’s equipment, it became obvious of a couple of immediate problems.
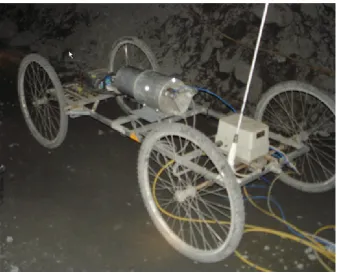
Figure 3.4: Photograph of the scanner attached to a purpose made bracket and fastened to mobile equipment.
To overcome this problem the CMS trolley was modified with a base plate to accommodate the scanner. Because of the scanners limited field of view the base plate had to be able to accommodate the scanner in both a lateral and longitudinal position relative to the trolley. This was done on site and at very short notice and proved to be successful.
[image:28.595.185.467.499.717.2]Another obvious initial problem was that the contractor’s scanner operated by wire connections to a laptop. The lengths of these wires were hopelessly short for undertaking a stope survey. It meant that the operator would have been within one metre of the open brow of the stope, not only an extremely dangerous position to be but also prohibited at Cannington. Longer extension cables were assembled, again on site and at short notice and proved adequate.
3.4 Surveys
3.4.1 Stope Survey
The trial of the scanner was timed so that there were a couple of empty stopes waiting survey. Stope 3597hl (35 = 350 Level, 97 = 97 x-cut, hl = hanging wall lead) was chosen to perform both a scanner survey and a CMS survey.
Methodology - Scanner
Figure 3.6 Scanner attached to the CMS trolley in the lateral position
[image:30.595.158.496.389.662.2]Methodology - CMS
After the scanner survey the CMS trolley was reconfigured to accommodate the CMS. The scanner base plate was removed and the CMS arm attached.
See Figure 3.8: Photograph of CMS trolley with the scanner base plate removed and the CMS arm replaced
With the CMS on the trolley and wires connected to the control box and battery the CMS trolley was manoeuvred out in to the stope. The head of the CMS was surveyed in using the total station. Three different points within the stope were then surveyed in by single shots on the CMS. These same points were surveyed in at the same time with the Total station from the mine survey control. These points were used for registration and orientation of the CMS survey. The survey of the stope was then begun and on completion the trolley manoeuvred out of the stope.
3.4.2 Drive Survey
Drive As Built Survey
There were two reasons for doing a scan of a selected portion of a drive. First was to look at whether the scan data could be used effectively to improve the digital terrain models (DTM) of the drives and the second was to assess whether a scan could be used to monitor the application of fibrecrete used for ground control. To these ends a section of drive on the 280 Level C0 x-cut was selected and surveyed before and after the fibrecrete was applied and the scans continued down the drive to assess performance.
Methodology - Scanner
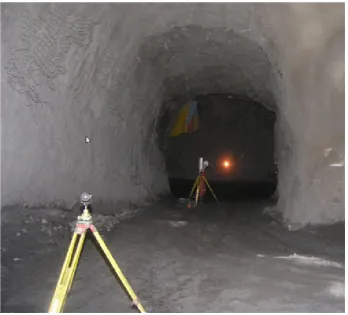
Figure 3.9: Photograph of the drive survey on 280 Level performed with the scanner.
Methodology - Total Station
3.4.3 Surface Stockpile Survey
Although scans of surface stockpiles are well documented, none have been carried out at Cannington before and nor had any of the survey staff been involved with them. Unfortunately time and work constraints prevented a pick up of the stockpile by traditional methods but there was time for a scan survey.
Methodology - Scanner
[image:34.595.116.539.364.663.2]The stockpile was scanned on arbitrary coordinates, as only a demonstration of what the scanner could do was needed. Survey tripods were set up around the stockpile and coordinated on arbitrary coordinates. The scanner was then set up on each of the tripods and scans completed.
Figure 3.10: Photograph of the scanner set up on the ROM (Run of Mine) stockpile
3.5 Data Registration and Processing
Scanner Survey
All the scan surveys were downloaded directly into I-site studio software where they were initially stored in .3di format. The scans were registered i.e. coordinated and orientated within Studio.
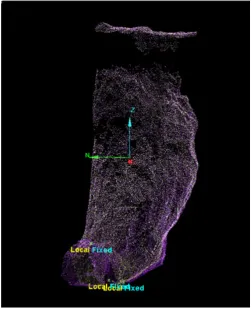
[image:35.595.200.453.406.718.2]For the stope and drive scans the control points surveyed by the total station were processed in Surpac and imported into Studio as a dxf file. These control points were then used to perform a matching point pair registration. This is a function in both Studio and Voidworks where the control points are selected and the matching point pairs to these control points from the scan survey are also selected. These point pairs will be in a different orientation to each other and the matching point pair registration will match the scan points to the proper coordinated points moving the rest of the scan data with it and hence orientating the scan on proper coordinates.
I-site Voidworks does not have the capability to accept .3di files so these files were then stored in dataengines, which are memory mapped object databases that can be accessed from both Voidworks and Studio. Once the scans were registered the scans were accessed through Voidworks and analysed and compared to the data obtained from traditional survey methods.
CMS Survey
The CMS survey was downloaded through the lsard program which is the CMS software used to download and preliminarily orientate and coordinate the CMS. It produces a dxf file that was imported into Voidworks. There the data underwent the same kind of transformation as the scans although different control points were used.
Total Station Drive Survey
The drive survey was downloaded into surpac as a string file.
Chapter 4
Results and Analysis
4.1 Introduction
The results and analysis of this project were analysed from two perspectives. The first was from the logistical and practical function of the scanner and the second from the data produced by the scanner. Contrasting these aspects with the traditional methods will build a better picture of the capability and feasibility of using a terrestrial scanner at Cannington.
4.2 Practical Function
The practical function aspect looked at the physical and practical requirements to perform a survey task with the scanner. Factors that were considered relevant were:
• The time it took to do each survey task in the field • Logistics
• Safety aspects • Reliability
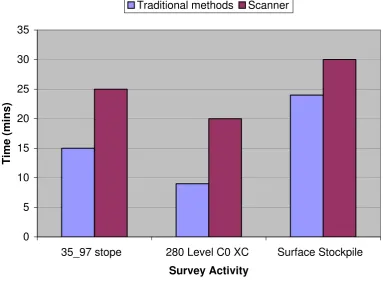
4.2.1 Survey Times – set up
The survey times were divided into two components to better analyse the contrasts. The first component looked at was the set-up times. This was the time that it would take to set up the relevant instruments and perform the necessary coordination and orientation of the instruments in order to start the data gathering. Figure 4.1 shows a column graph of the set-up times.
0 5 10 15 20 25 30 35
35_97 stope 280 Level C0 XC Surface Stockpile
Survey Activity T im e ( m in s )
[image:38.595.128.512.206.488.2]Traditional methods Scanner
Figure 4.1: Time taken to set up instruments in order to start surveying
35_97 stope
The surveys of the stope using the CMS and scanner were both carried out from the bottom of the stope using the CMS trolley. The basic set up of both instruments was similar in that they both were bolted to the trolley and the trolley run out into the stope. Both methods required the instruments to be coordinated with the total station and extra control (i.e. points common to the instruments and total station survey).
range across the horizontal and vertical planes. If the Riegl LMS-Z210 had been put out into the stope in a vertical orientation (i.e. normal operation set up) then there would have been a shadow (no data) above the scanner from 40 degrees above the horizontal. There would also be a shadow from 40 degrees below the horizontal but as the survey was from the bottom of the stope at approximately 0.5m off the floor (the height of the trolley) the greater data loss from the scanners restricted view would be above the scanner.
[image:39.595.197.457.379.715.2]To compensate for the Riegl LMS-Z210 restricted field of view the scanner was actually bolted to the cms trolley on its side. This effectively eliminated the shadow in the vertical plane but moved the shadow to the horizontal plane. To overcome this shadow two scans were needed. The scanner had to be moved through a horizontal angle of 90 degrees after the first scan and then another scan taken.
The extra set up time for the scanner was due to the requirement of this second scan. The cms trolley was brought back out of the stope and the scanner unbolted and then bolted into the new position. The cms trolley was then moved back into the stope where the scanner head was resurveyed as well as any new control that was needed.
The CMS has full field of view range across the vertical plane and 0 degrees to 288 degrees in the horizontal plane which was adequate to cover the stope in one set up and hence less time was required for set up.
280 Level C0 XC
Drive as built pickups at Cannington are done quite quickly using the total station. Survey control in the form of wall stations are used to quickly set up where you think appropriate and to resect off the wall stations and then go straight into the survey. If you need to move position instead of surveying in a temporary point the total station can be moved and another resection carried out. Using wall stations and resections are a fairly new concept in underground surveying and have definitely increased the speed of pick ups.
Figure 4.3: Voidworks screen capture of the scanner drive survey showing shadow areas above and below the scanner.
Surface Stockpile
4.2.2 Survey Times –Data gathering
Figure 4.4: Times the instruments took to gather the data
35_97 stope
The CMS survey was carried out at its maximum settings which gave the maximum coverage possible. These settings meant that the CMS performed a full revolution at degree intervals from 0 degrees horizontal through the vertical plane to 144 degrees. To complete this task took the CMS took 90 minutes.
The scanner survey was carried out in the medium mode. The Riegl LMS-Z210 has 3 modes in which data can be gathered coarse, medium and fine. The time shown in figure 4.4 is the time taken to carryout both scans in medium mode in the different configurations necessary to eliminate data shadows.
280 Level C0 XC
The times shown for the scan survey of the drive C0 XC are for the scanner being used in medium mode.
0 10 20 30 40 50 60 70 80 90 100
35_97 stope 280 Level C0 XC Surface Stockpile
Survey activity T im e (m in s )
4.2.3 Logistics
[image:43.595.108.547.237.367.2]The management of the practical details for the scanner trial raised a few issues. As mentioned in Chapter 3 there were a couple of teething problems which were managed quickly and successfully. There was the issue of the scanners field of view as previously discussed but perhaps the biggest issue was the Riegl LMS-z210 weight. Figure 4.5 shows a table of the instruments respective weights.
Table 4.5: Instrument Weights
Instrument Weight
Riegl LMS-Z210 Scanner 13.5Kg Riegl LMS-Z210 Battery 3Kg
CMS head 5Kg
CMS battery 10 Kg
Leica TCRA1103 2Kg
The reason why weight was such an issue was related to the stope survey part of the trial. The stope surveys for the trial were all carried out from the bottom of the stope but it is almost always necessary to get 2 or more stope surveys, from the bottom and top and sometimes midway in order to obtain complete data coverage.
Traditionally stope surveys from levels other than the bottom level have been performed by CMS using the CMS booms. The CMS is attached to the booms, 7m in total and pushed out into the stope. The booms are supported on tripods and the light weight of the CMS head enables the task of manoeuvring the CMS head out into the stope to be managed easily and safely.
4.2.4 Safety Aspects
Any work underground has hazards due to the underground environment but out of the three survey tasks completed the most hazardous would have been the stope survey. The hazard of surveying from the bottom of a stope is the possibility of a rock fall from the large opening in the ground which is the stope. The hazard of surveying from the middle or top of the stope is the potential of falling into the stope. Therefore anything which reduces your time around or near a stope would be a safety improvement.
In Figure 4.4 the bar graph depicts the large difference in actual survey time between the CMS and the scanner. This at first glance looks overwhelmingly in favour of the scanner but in reality more time was actually spent within the hazard areas of the stope when using the scanner. The CMS required only one set up and because the actual survey time takes so long, an hour and a half, the CMS was left unattended whilst the surveyors completed other tasks in the mine away from the stope. The scanner required two set ups due to its field of view which meant the time within the hazard areas of the stope were doubled. The speed of the scan actually meant that the surveyors waited with the scanner until it had finished further adding to the time around the hazardous area. From the point of view of the equipment though, and not personnel, the CMS is exposed to the open stope up to of 25 times longer than the scanner and so has a vastly greater chance of being damaged by a rock fall.
Again the safety implications involving the drive surveys whether using the scanner or the total station were related to the set up times. Although the scanner actually performed the surveys in half the time as the total station the time taken to set up the scanner was twice that of the total station and also included an extra set up. Also because of the need of control targets extra equipment i.e. tripods and targets were needed in the drive for the scanner survey. The hazards involved in a drive pick up survey are minimal but this extra time and equipment in the drive could increase the potential for an accident.
total station or more recently GPS. Both methods involved the surveyors climbing all over the stockpiles with high potential for a trip or fall accident as well as working amongst heavy machinery. The time taken to perform the survey by traditional means is also significantly longer exposing the surveyors to the hazards for a longer period.
Performing the stockpile survey with the scanner involved four set ups around the base of the stockpile and one set up on top of the stockpile. The surveyor only had to climb on the stockpile to set up the scanner on top so actual time spent on the stockpile was minimal compared to the traditional survey.
4.2.5 Reliability
One of the problems with the CMS is its reliability. As mentioned before Cannington has two CMS’s due to its unreliability so when one is away being repaired one is still serviceable.
4.3 Data
The second phase of analysing the scanner trials was to look at the data produced from the scanner and to compare and contrast this with the data produced from the traditional methods. The issues thought relevant to analyse were:
• Data quantity • Data quality • Registration • Data manipulation • Final product • Data usefulness
4.3.1 Data quantity
[image:46.595.147.502.590.682.2]The attraction of a scanner is the ability for it to survey many points very quickly. The Riegl LMS-z210 advertises its scanning rate at 8,000 to 12,000 points per second. Table 4.6 shows the number of points surveyed with each instrument. The time shown is the estimated time the instrument spent gathering the data as shown in Fig 4.4 i.e. not set up times. These times are a best approximation. The ROM stockpile survey was not done with the total station however an estimated time and point number was calculated from similar previous surveys.
Table 4.6: Number of data points gathered by each instrument
Survey Instrument Number of points Estimated time
3597 Stope Scanner 814,335 0.03 Hrs
CMS 52,887 1.5 Hrs
280 C0 XC Scanner 1,133,663 0.033 Hrs
Total Station 220 0.12 Hrs
ROM stockpile Scanner 1,196,982 0.06 Hrs
As can be seen in table 4.6 there is an enormous difference in the number of points obtained by the scanner and the time the scanner takes to get these points when compared with traditional survey practices.
A scan carried out in medium mode will when exported to a dxf file produce a file approximately 49,000 KB. A CMS will produce a dxf file approximately 7000 KB and a total station survey of about 500 points will produce a dxf file of approximately 30 KB. It is important to note that these are raw file sizes which will be filtered and manipulated to produce final products of smaller sizes. For example 3597 when the final model was completed produced a dxf file of 3,311 KB with the CMS and 10,854 KB with the scanner.
4.3.2 Data accuracy and usefulness
Data accuracy
Obviously all this extra data produced by the scanner would be useless if it were not accurate. It is not the intention of this report to analyse the accuracy of the data fully as this in itself would be a major undertaking. Riegl report that the LMS-Z210 has a measurement accuracy of ± 25 mm which is acceptable for an as-built pick up. The data quality was assessed by the registration process and by comparing data acquired by traditional methods which was used as a benchmark for accuracy. DTM solids of the data were created to better analysis the results.
Registration Process
measurement accuracy. Again this is a broad generalisation and to fully investigate this matter would involve a lot more work. When the transformation was performed on the scanner data a tolerance error of 0.05 was obtained. This suggests that the scanner is measuring accurately but it must be made clear that this is an undeveloped analysis and further work would be needed if a full analysis was required.
Data comparison
[image:48.595.146.509.401.709.2]Another method used for analysing the accuracy of the scan data was to compare the scan data, after registration, for the 280 drive pick up with the pick up performed with the total station. Again this is a simple analysis but gives a good indication of any gross errors. Figure 4.7 shows both data sets modelled into separate solids. There is a good relationship of the scanner data (gold) with the datum (total station data - red) however there are differences between the models in close up which will be discussed later in the chapter.
Data Usefulness
It is a popular misconception that the extra data generated by a scanner can be a double edged sword. On one hand it is valuable to have the extra data but this can be negated by the extra time needed to manage and store the data.
[image:49.595.176.477.299.532.2]As seen in table 4.6 the scanner produces an enormous amount of data. Most scanner software and indeed I-site Voidworks have the facilities to easily manage and manipulate the data. An example of the extent to which a scanner will scan can be seen in Figure 4.8 where the outline of a vehicle is clearly visible.
Figure 4.8: Voidworks screen capture of the extent of the data capture. Notice the survey vehicle clearly visible.
ignoring the null points in the middle. As seen in Figure 4.9, this function means that the internal points do not necessarily have to be deleted saving editing time.
Figure 4.9: Voidworks screen capture of the loop wrap function. This function creates a polygon around the outermost points selected.
Another function that is common to scanner software is the filter function. There are a number of ways this function can operate but perhaps the simplest is to filter by minimum separation. This is where all points within a specified distance of each other will be deleted at a touch of a button.
The amount of data a scanner gathers is becoming less and less of a problem as software and computers develop further.
Model Comparison
out does not allow for accurate direct volume comparisons between models. Although it is possible to compare volumes, the control and methodology would have had to have been more rigorous to allow for fair comparisons. However by looking at the model structure it is possible to see the improvements made by the scanner. Figure 4.10 shows a cross-section of the drive C0 XC on the 280 Level. The cross- section shows two models, the red is the model obtained by the total station data and the gold from the scanner data. In this section it is quite clear that the scanner data has produced a more correct model. The straight lines for the floor and wall of the total station model stand out against the scanner model.
Figure 4.10: Voidworks screen capture of a cross-section of the two solid models of 280 Level C0 XC. The scanner model is gold and the total station model is red
Figure 4.11: Voidworks screen capture of a cross-section of the two solid models of 280 Level C0 XC. The scanner model is gold and the total station model is red
Unfortunately the ROM stockpile was not surveyed with the total station but an adjoining stockpile was. In Figure 4.12 the contrasts in the two surveys is quite apparent. The ROM stockpile carried out with the scanner is almost photographic in detail while the stockpile next to it, surveyed by the total station, is quite blocky in appearance.
[image:52.595.151.503.516.732.2]Other uses
The quantity and quality of the data measured by the scanner raises the possibility of using the data for diverse purposes.
[image:53.595.184.471.400.688.2]The ground support of drives with fibrecrete (a concrete and fibre mix) can be quite expensive. At Cannington the fibrecrete is sprayed on to the backs and upper walls by a contractor. A problem can arise when what is instructed to be sprayed on the backs and walls is less than what is said to have been sprayed on the walls and backs. This is usually due to spray rebound which generally ends up on the floor and the roughness factor of the backs. This can quickly escalate to a lot of money if there are large areas to fibrecrete. The scanner was used as a trial to see if it could be used to monitor the fibrecrete thickness. A scan before and after the fibrecrete was applied was taken. Figure 4.13 shows a cross-section of the survey clearly demarking the extent of the fibrecrete.
Figure 4.14 shows a scan of a drive with the points showing different reflectance values. Also the detail in the rock can be made out. Notice the drill traces in the backs. This ability to see differences in the rock due to reflectance and being able to see detail in the rock such as faults could be of value to both mining and geotechnical engineers. Again this is an area which requires a lot more experiment and analysis than what was proposed in this project.
Chapter 5
Discussion and Recommendation
5.1 Discussion
The trial surveys carried out with the scanner were successful in that they have exposed a new survey instrument, new to underground mining, which needs to be discussed further in order to establish whether it would be feasible to incorporate into the survey department at Cannington. The relevant issues the trials have raised and require further discussion and maybe further work are:
• Field of view
• Improvement to base plate
• Weight and survey from top and intermediate levels • Blue tooth
• Pros and Cons
Field of View
The Riegl LMS-z210 field of view had a significant bearing on the survey trials. The restricted field of view effectively increased the survey set up times as extra surveys were required to compensate for the limited view. It is important to note that the Riegl LMS-z210 is now relatively speaking quite an old instrument and the newer scanners have improved field of views. For example the newer series of the Riegl LMS-z210 has a 360 degree horizontal scan. However the cost of these newer instruments is obviously higher and each scanner has its own peculiarities and would not necessarily be suited to an underground environment.
Base Plate
would save time would be to have the scanner bolted on in one position and have the base plate rotated through 90 degrees. It may even be possible to do this remotely saving having to bring the CMS trolley out of the stope.
Weight
Weight of the scanner head was another significant feature of the survey trials. Weight becomes a problem when trying to perform stope surveys from any level other than the bottom. As mentioned before the Riegl is a relatively old instrument now and new scanners on the market weigh less than the LMS-z210 but still weigh too much to deploy into the stope using the same method as CMS booms.
Figure 5.1: Photograph of North Surveys survey vehicle with a scanner on the top of the boom.
Bluetooth
Bluetooth allows for wireless connections between electronic equipment. On both the scanner and CMS download and power cables had to be used. Using Bluetooth would eliminate the need for these cables. However using Bluetooth underground may raise a few problems with radio frequencies and would need to be properly investigated. Also there could still be the need to connect the battery to the scanner if you could not get the battery out into the stope with the scanner.
Pros and Cons
The main advantages were the high quantity and quality data a scanner can acquire very quickly. This data can be managed quite easily with scanner software and the resulting models are more precise resulting in better reconciliation, improved future design and improved monitoring. Safety can be improved on the surface by limiting time spent in the area of the stockpiles and reducing the amount of climbing over the stockpile. The reliability of the instrument is also an advantage over the CMS which has a poor reliability record. The fact that a scanner is multi-functional when compared with a CMS (i.e. a CMS is generally limited to stope surveys.) is also an advantage.
The disadvantages were the time needed to actually set up for the survey. The weight of the instrument was another factor as this prevented a cms being done from a mine level other than the bottom. The sizes of the raw data files are large but these can be quickly edited and reduced to more manageable sizes.
5.2 Recommendation
Chapter 6
Conclusion
6.1 Achievement of Objectives
The aim of this project was to investigate the feasibility of using a laser scanner at BHP Billiton Cannington underground mine to replace some traditional survey methods. To accomplish this, a range of objectives were proposed and were by and large satisfactorily realized.
The research of scanner technology and those scanners most suitable for trial was carried out reasonably well and quickly. The logistics of getting the scanner and personnel to a remote operation and the initial teething problems were a bit of a challenge but the outcome was acceptable. It was hoped that more than one scanner could be trialed but budget and time constraints prohibited this. The trials were carried out and the jobs processed and the results analyzed and compared to traditional methods. The trials looked at the logistical and functional aspects of using a scanner as well as analyzing the data gathered by the scanner. From these trials a number of issues and concerns were raised. From the discussion of the trials it was concluded that it was feasible to use a scanner at BHP Billiton Cannington mine from a logistical and data prospective.
6.2 Further Work
Reference List
Boehler, W, Vicent, B and Marbs, A, 2003, Investigating Laser Scanner Accuracy,
Institute for Spatial Information and Surveying Techniques viewed 3 April 2005, http://www.i3mainz.fh-mainz.de/publicat/cipa2003/laserscanner_accuracy.pdf
Brown, L, 2004, A Forum of Its Own, Point of Beginning v2, September 2004, viewed 7 April 2005,
http://www.pobonline.com/CDA/ArticleInformation/Article/1,9169,131919,00.html
BHPBilliton Cannington Mine, 1999, Survey Procedures, Cannington
Fröhlich, C and Mettenleiter, M, Terrestrial Laser Scanning – New Perspectives in 3D Surveying, International Society for Photogrammetry and Remote Sensing viewed 18 March 2005,
http://www.isprs.org/commission8/workshop_laser_forest/FROEHLICH.pdf
Greaves, T, 2004, ‘Laser Scanning: How Does It Work, Anyway? ', Spar Point Research
Archives, vol. 2, no. 23, viewed 30 March 2005,
http://www.sparllc.com/archiveviewer.php?vol=02&num=23&file=vol02no23-01
Greaves, T, 2005, ‘How to Buy a 3D Laser Scanner: Spar Point's Top 10 Checklist’,
Spar Point Research Archives, vol. 3, no. 12, viewed 30 March 2005,
http://www.sparllc.com/archiveviewer.php?vol=03&num=12&file=vol03no12-01
I-SITE, 2005, I-SITE Pty Ltd, South Australia, viewed 6 April 2005, http://www.isite3d.com
Jenkins, B, 2004, ‘Laser Scanning Saves $2 Million for Boston’s Big Dig’, Spar Point Research Archives, vol. 2, no. 25, viewed 31 March 2005,
http://www.sparllc.com/archiveviewer.php?vol=02&num=25&file=vol02no25-01
Kersten, Th, Sternberg, K, Mechelke, C and Pardo,A. 2004, Terrestrial Laser Scanning System Mensi GS100/GS200 – Accuracy tests, experiences and projects at the Hamburg University of Applied Sciences, International Society for Photogrammetry and Remote Sensing viewed 18 March 2005,
http://www.commission5.isprs.org/wg1/workshop_pano/papers/PanoWS_Dresden2004 _Kersten.pdf
Leica Geosystems, 2005, Leica Geosystems AG, Switzerland, viewed 6 April 2005, http://www.leica-geosystems.com
Lichti, D and Harvey, B, 2002, The effects of reflecting surface material properties on time-of-flight laser scanner measurements, International Society for Photogrammetry and Remote Sensing viewed 18 March 2005,
http://www.isprs.org/commission4/proceedings/pdfpapers/180.pdf
Lichti, D (2002), 3-D Laser Scanning Workshop 17-18 June 2002:Advanced theory and operation matters, University of New South Wales, Sydney.
Lupton, J, Cavity Monitoring System and Stope Analysis, Infomine, viewed 7 April 2005,
http://technology.infomine.com/UGmine/publications/Underground%20Mining.pdf
Optech, 2005 Optech Incorporated, Canada, viewed 6 April 2005, http://www.optech.ca
Schulz, T and Ingensand, H, 2004, Terrestrial Laser Scanning –Investigations and applications for High Precision Scanning, International Federation of Surveyors viewed 23 March 2005,
http://www.fig.net/pub/athens/papers/ts26/TS26_1_Schulz_Ingensand.pdf
Spar Point Research, 2004, ‘Open-Pit Mine Surveyed with Laser Scanning’, Spar Point Research Archives, vol. 2, no.1, viewed 31 March 2005,
http://www.sparllc.com/archiveviewer.php?vol=02&num=01&file=vol02no01-01
Appendix A
University of Southern Queensland Faculty of Engineering and Surveying
ENG 4111/2 Research Project PROJECT SPECIFICATION
FOR: Paul Tozer
TOPIC: Assessment of the capability of a terrestrial scanner in underground and surface mining at BHPB Cannington mine.
SUPERVISOR: K McDougall
SPONSORSHIP: BHPBilliton Cannington Mine
PROJECT AIM: This project aims to assess the capability of a terrestrial scanner in underground and surface mining looking at the practicality, safety, accuracy and usefulness of the data, and cost compared with current survey methods at Cannington mine.
PROGRAMME: Issue B, 09 Mar. 05
1. Identify possible uses for a scanner at Cannington. Identify possible benefits. 2. Research information on current scanner uses underground and critically assess.
Research information on Scanner instruments in general and assess which ones are feasible to trial in terms of cost, practicality and software requirements. 3. Design methods of carrying out surveys in an underground environment in
particular stope surveys and development drives. 4. Carry out risk assessments.
5. Carry out surveys by scanner and existing methods comparing survey time, cost, personnel required and note advantages and disadvantages with each method. 6. Process Data and compare and evaluate data.
7. Discuss results and make recommendations. 8. Document work in dissertation.
AGREED: (student)
(supervisor)
Appendix B
B
B
B
B
Safe Work Instruction
Work description: CMS Stope Surveying Work number: SUR - 002a
Area/s: Underground Number of pages: 2
Date reviewed: Reviewed by:
Standard protective equipment required: Safety Glasses, Safety boots, Hard Hat, self-rescuer, ear plugs, gloves.
Additional equipment required: Harness, lanyard and/or 10 metre inertial reel, radio, Stope light.
Task
Steps
Key Points
1. Prepare for Job.
1. Read this in conjunction with SUR-002 - CMS Open Stope Surveys.
2. Place all CMS equipment at a safe distance from the Stope edge, (no closer than 6m).
3. Locate a suitable anchor point (refer to SWI-UG0105C - “Working near open holes”) for the inertial reel.
4. Put on the additional PPE, ie. harness and attach inertial reel to anchor point.
5. Assess whether there is a need to set up (one or two) tripods, or if the ground surface permits anchoring at ground level.
6. Unpack equipment on the best ground surface available, for personal safety and equipment care. 7. “Take 5” assessment.
Caution Safe working distance from stope edge without PPE is 3 metres. Stop Stop Stop Stop Think ThinkThink Think Identify Plan Proceed
2. Operating the Optech CMS.
1. Again check the stope conditions, access drive, rock overhang, walls, backs. Check for cracks and incoming water from the surrounding rock. 2. Establish tripods as required in the position which
gives best data coverage, and safe anchoring, (ie. Weigh down the base).
3. Feed the CMS boom cable (male end first), through each boom section one at a time, starting at the Scanning Head.
4. Lock each boom joint once the cable is thread through each section.
5. Attach the Scanning Head onto the cable, taking care not to manually rotate, (damage), any components of the head, and lock into place. 6. Attach the Front Target at (preferably) 1m from
the Scanning Head.
7. Anchor the CMS boom and head on the Tripod(s), or on the ground.
8. Attach the CMS cable to the box and proceed with Survey.
Ensure that Harness and Lanyard are securely attached.
Warning Check ground conditions near stope edge prior to setting up any
3. Completing the job.
1. Ensure CMS has finished operating. 2. Power off as directed.
3. Disconnect CMS boom cable from box. 4. Check for any change in ground conditions. 5. Undo anchor points on the boom and carefully
retrieve CMS head, ensuring it is not caught or jarred on any obstacle.
6. Disassemble head first, then remainder of boom/cable/targets.
7. Retrieve all equipment from within 6m of Stope edge, (including tripods), prior to removing harness and inertial reel
Appendix C
Appendix D