Interactive Technology in Teaching Judgemental Forecasting
MEHRYAR NOORIAFSHAR
University of Southern Queensland, Toowoomba, Australia
Abstract
This paper is based on an experiment which utilized the Classroom Performance (CPS) for teaching judgmental forecasting to undergraduate students. The system was adopted and utilized in a constructivist manner to simulate a Delphi exercise for long term prediction of water consumption. The main purpose was to teach judgmental forecasting in an interactive manner. A group of 20 students undertaking the undergraduate course of Business Forecasting at the University of Southern Queensland in Australia took part in this exercise. Although the students were in the same physical location, the technology enabled them to express their opinions without revealing any identity. The positive outcome a specially designed test has confirmed the effectiveness of this technology-based method of classroom teaching.
Key words: Judgemental, Forecasting, Anonymous, Technology, Classroom Performance System
Introduction
Forecasting is possibly an activity which is required by most businesses. Organisations, regardless of their size or nature of business, need to forecast short, medium or long term values for variables such as sales or demand. The analysts can adopt a number of different approaches which range from simple averaging methods to sophisticated techniques such as multiple regression or autoregressive approaches. Irrespective of the method used, no forecast is 100% accurate, but any forecast is better than having no forecast at all. We must remember that in addition to mathematically based approaches, there are also non-quantitative ways of making predictions. Although there is a heavy emphasis on the use of quantitative approaches, non quantitative or judgmental methods play a significant role.
This paper presents how the latest interactive technologies can assist in teaching judgmental forecasting for the increasingly important topic of water consumption prediction. For further information on using forecasting techniques for water consumption, see Davis M. (2003); Havlak R. (2004); and Rolf J. (2004)
Technology and Two Way Interactive Participation
The Classroom Performance System (CPS) by eInstruction (www.eInstruction.com) was adopted by the author for teaching the undergraduate course of Business Forecasting in 2005. The system was used to:
2. Motivate and generate discussions based on the class opinion during the session.
3. Guide students towards identifying appropriate factors for solving case studies.
4. Assign tests and quizzes at appropriate stages of the course to assess progress.
CPS is the state-of-the-art in bringing full participation and interactivity to the classrooms. Students are provided with handsets (clickers) which are used to respond to questions provided by the teacher. The correct answers to questions along with the results are shown immediately on the screen without identifying individual students. The system also presents the percentages of the responses in the forms of Histograms or Pie Charts.
The anonymous feedback provided by CPS is certainly a factor which encourages all students to participate in discussions. Students who are not sure about the right answers would be able to participate without being recognized and embarrassed. Students who know the correct answer will receive the confirmation about their response. Hence, they will be further motivated. As reported by Hafner (2004) Paul Caron uses CPS in his law classes at the University of Cincinnati to break through the “cone of silence”.
In order to utilize CPS more effectively, the author has developed and adopted a constructivist approach which motivates and guides the students towards finding the correct answers.
It should be noted that under constructivism, the learner is guided to find the solution by constructing his/her own understanding. Obviously this process is assisted by the teacher’s guidance. An interactive system such as CPS can be utilized to provide the necessary guidance in a multimedia manner. It should be noted that a rich learning environment such as an interactive multimedia would satisfy a major objective of the constructivist approach (Phillips, 1998). See Bruner (n.d.), Dougiamas (1998) and Mahoney (2004) for some examples of introduction to constructivism.
Recent research findings have confirmed that students, regardless of their background, have a preference for visual features in teaching materials (Nooriafshar et al., 2004; and Nooriafshar and Maraseni, 2005). Hence, appropriate images were incorporated into the CPS quizzes and questions to act as prompters and help with remembering.
Judgmental Forecasting
Quantitative forecasting methods are based on the assumption that historical patters and behaviours will be extrapolated into the future. In other words, changes in the patterns and behaviours will not occur in the future. However, if these relationships change in the future, then human judgement must be also incorporated into the forecasting method.
ancient Greece. The Delphi method of forecasting uses the opinions of a number specialists who posses knowledge and experience in the domain in question. These experts express their opinions in an iterative manner. This method was first used in a RAND Corporation project which was funded by the US Air Force back in the 1950s.
The idea is to remove the group dynamics and the influence of the most vocal members so that every member is given the opportunity to express their opinion freely and privately. Hence, anonymity is one of the main features. Opinion seeking can be carried out by Person, Mail, Phone, Fax or E-Mail.
The opinions are summarised and redistributed to every Delphi panel member to reconsider their initial opinion. They may then modify or adjust their first opinion based on the feedback from other members. The revised versions are submitted to the administrators for summarising. This process can be repeated several times. Three iterations are assumed to be sufficient for reaching a reasonable consensus.
The Delphi Exercise: Prediction of the Long Term Water Consumption
After providing the foundations of the Delphi method, the Business Forecasting students (20) were invited to participate in the following specially designed interactive case study. The students were told to assume that they were the panel members in a Delphi exercise. It must be noted that despite the fact that the students were physically in the same room, the privacy and anonymity was achieved and provided by the technology used.
Case Study - Assume that the Water Authorities in Toowoomba are trying to predict the water consumption for 2035 in the City. Apply the Delphi method to help the Authorities with this prediction. You may use the following information:
Toowoomba is located in southern Queensland about 130 km to the west of Brisbane (the Capital). The population is around 90,000. Toowoomba is the centre of the Darling Downs, one of the richest agricultural regions in Australia. There are no heavy industries in Toowoomba. There are some light industries. The number of dwellings in town has been growing steadily over the past 15 years. One of the main employers in town is the University of Southern Queensland (USQ). USQ has about 25000 students of which 5000-6000 are on-campus. The city’s water is provided by three dams. One of the main features of Toowoomba is that it is the Garden City of Australia. Every spring the city holds the Carnival of Flowers. Many private and public gardens are displayed for the show. In order to avoid water shortages, restriction on the use of sprinklers are imposed usually after the Carnival.
Hint: Average water usage per person per day is assumed to be around 280 litres. Gardens need water. There is a potential growth for the USQ student and staff numbers. More houses mean more water usage!
Table 1: Possible Factors and their Importance Factor Importance City Population H M L Number of Houses H M L Number of Industries H M L Average Annual Rainfall H M L Average Family Income H M L
Other H M L
Where: H is High, M is Medium and L is Low
The students were then asked to consider how they might use some figures and trends for the above factors in forecasting.
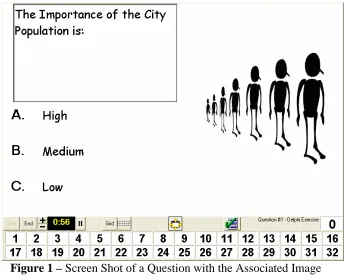
[image:4.595.198.414.91.215.2]The next phase was to carry out the Delphi exercise. The questions on the factors and their importance were presented to the group on the screen using CPS. The questions were complemented with appropriate images to help with visualisation. See Figure 1 for an example of the questions presented to the students.
Figure 1 – Screen Shot of a Question with the Associated Image
Immediately after receiving the responses for each question, the feedback was automatically analysed, summarised and presented to the panel on the screen in the form of Bar and Pie charts. Hence, the students (panel members) became aware of the panel opinion without knowing the sources and their identities. The panel members were invited to reconsider their choices and make adjustments in light of other members’ opinions. They were advised not to be forced to go along with the majority opinion if they really believed in the validity of their own choices.
[image:4.595.132.476.336.611.2]adjustments to the initial choices at each round. There was clearly a majority opinion for each question at the end. Armed with the panel feedback and the author’s guidance, the members were invited to make predictions. It was agreed that the Population would certainly play an important role in future consumption figures. However, certain factors such as the number of houses and average income would also have an influence on the future figures. Students were then guided to think about a model to make the prediction. They were advised that it would be acceptable and appropriate to incorporate some mathematics too. The fact that we are dealing judgemental forecasting should not deter us from relying on the use of a little bit of model building. With further guidance, the following model was developed and shown to everyone:
Water Consumption = Per Person Consumption * City population +
Additional Percentages caused by Number of Houses, Number of Industries,
Average Annual Rainfall and Average Family Income
It was explained that the choice for the additional percentages could be based on each factor’s importance ratings (High, Medium or Low). Hence, additional percentages would be incorporated into the equation. It was also suggested that opinion seeking with regard to agreed percentages could also be carried out in a Delphi style. Students realised that consumption per person is also subject to variation due better and more efficient ways of using water, new technologies, education, pricing, fines and restrictions. Hence, they found out that the use of a judgemental forecasting method, as opposed to models which rely solely on extrapolation of historical data, should also be considered.
At the end of the exercise, the students were tested on the key concepts presented to them. The Class Average Point of around 70% indicates that students had grasped the concepts and ideas. It should be noted that these students did not have any formal preparation and revision for this test.
Conclusions
The Classroom Performance System (CPS) was adopted to encourage full student participation and to create two way interactivity for teaching judgmental forecasting. The topic was the use of the Delphi method for forecasting long term water consumption of the city of Toowoomba in Queensland, Australia. The participants were Business students who were studying an undergraduate course on Business Forecasting.
As demonstrated in this experiment, the latest technologies were adopted to teach students how to carry out a judgmental forecasting exercise in an interactive and constructivist manner. The positive outcome of the quiz which was given to the students at the completion of the exercise is an indication of the method’s effectiveness.
References
Bruner J. (n.d.), Constructivism Theory Retrieved August 15, 2004 from
http://www.artsined.com/teachingarts/Pedag/Constructivist.html
Davis M. (2003), Will the U.S. have enough water in the years to come? Water
demand forecasting seeks an answer, Retrieved May 12 2005 from
http://www.siu.edu/~perspect/03_fall/water.html.
Dougiamas M. (1998), A journey into Constructivism Retrieved September 15, 2004 from http://dougiamas.com/writing/constructivism.html#intro
Hafner K. (2004), In Class, the Audience Weighs In Retrieved March 15, 2004 from
http://www.nytimes.com/2004/04/29/technology/circuits/29hand.html?pagewante d=all&position=
Havlak R. (2004), Predicting Water Use in Urban Residential, Retrieved May 12 2005 from http://twri.tamu.edu/usgs/2003-04/havlak.pdf.
Mahoney M. (2004), What is Constructivism and Why is it Growing? Retrieved October 8, 2004 from
http://www.constructivism123.com/What_Is/What_is_constructivism.htm
Nooriafshar M., Maraseni T.N. (2005), “A Comparison of Learning Preferences and Perceptions of High School Students for Statistics”, Proceedings of the Hawaii
International Conference on Statistics, Mathematics and Related Fields,
Honolulu, Hawaii, USA, 9th-11th January.
Nooriafshar M., Williams R. and Maraseni T.N. (2004), “The Use of Virtual Reality in Education”, The American Society of Business and Behavioral Sciences (ASBBS) 2004 Seventh Annual International Conference, Cairns, Queensland, Australia, 6th-8th August.
Phillips R. (1998), Models of learning appropriate to educational applications of
information technology Retrieved October 4, 2004 from
http://lsn.curtin.edu.au/tlf/tlf1998/phillips.html
Rolf J. (2004), “Assessing demands for irrigation water in North Queensland”,