Version: Submitted Version Monograph:
Smith, Paula, Rudd, Peter orcid.org/0000-0002-8824-3247 and Coghlan, Misia (2008) Harnessing Technology Schools Survey 2008 : Data. Research Report. Becta , Coventry.
Reuse
Items deposited in White Rose Research Online are protected by copyright, with all rights reserved unless indicated otherwise. They may be downloaded and/or printed for private study, or other acts as permitted by national copyright laws. The publisher or other rights holders may allow further reproduction and re-use of the full text version. This is indicated by the licence information on the White Rose Research Online record for the item.
Takedown
If you consider content in White Rose Research Online to be in breach of UK law, please notify us by
Harnessing Technology: Schools Survey 2008
Report 2: Data
Paula Smith, Peter Rudd and Misia Coghlan
National Foundation for Educational Research
Table of contents
Table of contents... 2
Introduction ... 3
1. Survey respondents ... 4
1.1 Gender ... 4
1.2 Years of experience ... 6
1.3 Role ... 9
2. Technological infrastructure ... 15
2.1 ICT equipment ... 15
2.2 Infrastructure ... 32
2.3 Connectivity ... 43
3. Management, leadership and administration ... 63
3.1 ICT strategy and leadership ... 63
3.2 Finance ... 76
3.3 Use of ICT in school management and communication ... 81
3.4 Collaboration ... 89
3.5 Purchasing ... 98
3.6 Safety and security ... 113
4. Using computers for teaching and learning ... 120
4.1 Resources ... 120
4.2 Use in lessons/curriculum ... 132
4.3 Use of ICT facilities ... 156
4.4 E-assessment and reporting ... 159
5. Practitioner perceptions, confidence and CPD ... 168
5.1 CPD ... 168
5.2 Practitioner perceptions ... 185
5.3 Impact of ICT ... 198
6. Special themes: Home access ... 224
6.1 Home access... 224
Introduction
This report is one of two volumes that set out the main findings from the Harnessing Technology Schools Survey 2008, a national survey of ICT (information and
communications technology) in primary, secondary and special schools. The National Foundation for Educational Research (NFER) carried out the survey on behalf of Becta in December 2007 and January 2008.
Report 1 presents the main findings and analyses from the 2008 Harnessing Technology Schools Survey and discusses some of the implications of these findings.
1. Survey respondents
1.1 Gender
Table 1.1 Q1 Gender
Response %
Primary
Female 79
Male 19
No response 2
N = 159
Secondary
Male 65
Female 33
No response 3
N = 150
Special
Female 60
Male 37
No response 3
N = 193
Due to rounding, percentages do not sum to 100.
Source: NFER Harnessing Technology School Leadership Survey 2008.
In the school leadership survey, in primary schools, female respondents
outnumbered males by a ratio of around four to one. In special schools, there were also more female than male respondents, but at a ratio of less than two to one. In secondary schools, around twice as many male as female respondents completed the questionnaire.
Table 1.2 Q1 Gender
Response %
Primary
Female 75
Male 23
No response 2
Response %
Secondary
Male 72
Female 28
No response 0
N = 184
Special
Female 57
Male 40
No response 3
N = 201
Due to rounding, percentages do not sum to 100.
Source: NFER Harnessing Technology School ICT Coordinator Survey 2008.
Primary schools had the highest proportion of female ICT co-ordinators who responded to the survey compared with secondary and special schools. A higher proportion of male ICT co-ordinators responded to the survey in secondary schools than in primary and special schools.
Table 1.3 Q1 Gender
Response %
Primary
Female 85
Male 12
No response 3
N = 419
Secondary
Female 51
Male 46
No response 3
N = 793
Almost four-fifths of respondents who completed the teacher survey in primary
schools were female. In special schools, the ratio of male to female respondents was one to three, while in secondary schools, numbers of male and female teachers were fairly equal, with only slightly more female teachers than male teachers responding to the questionnaire.
1.2 Years of experience
Table 1.4 Q2 Years of experience in education
Response %
Primary
20+ years 53
11–20 years 30
6–10 years 13
0–5 years 3
No response 1
N = 159
Secondary
20+ years 60
11–20 years 31
6–10 years 4
0–5 years 4
No response 1
N = 150
Special
20+ years 70
11–20 years 21
6–10 years 7
0–5 years 1
No response 1
N = 193
Due to rounding, percentages do not sum to 100.
Source: NFER Harnessing Technology School Leadership Survey 2008.
Table 1.5 Q2 How many years of professional experience in education do you have?
Response %
Primary
6–10 years 27
11–20 years 27
20+ years 26
0–5 years 21
No response 1
Secondary
N = 176
11–20 years 28
20+ years 27
0–5 years 23
6–10 years 22
No response 1
N = 184
Special
20+ years 42
11–20 years 24
6–10 years 17
0–5 years 15
No response 2
N = 201
Due to rounding, percentages do not sum to 100.
Source: NFER Harnessing Technology School ICT Coordinator Survey 2008.
Table 1.6 Q2 How many years of professional experience in education do you have?
Response %
Primary
6–10 years 28
20+ years 25
0–5 years 22
11–20 years 22
No response 2
N = 419
Secondary
20+ years 34
11–20 years 28
6–10 years 24
0–5 years 12
No response 2
N = 793
Special
20+ years 40
11–20 years 25
6–10 years 20
0–5 years 12
No response 2
N = 466
Due to rounding, percentages do not sum to 100.
Source: NFER Harnessing Technology School Teacher Survey 2008.
1.3 Role
Table 1.7 Q3 Current role in school
Response %
Primary
Headteacher 58
Deputy headteacher 16
ICT co-ordinator 7
Assistant headteacher 6
ICT subject leader 3
Bursar 1
ICT manager 1
Head of ICT 0
Other 4
No response 5
N = 159
Secondary
Assistant headteacher 41
Headteacher 23
Deputy headteacher 21
ICT co-ordinator 3
Head of ICT 3
Bursar 2
ICT subject leader 1
ICT manager 1
Other 2
No response 3
Response %
Head of ICT 1
ICT manager 1
Other 5
No response 2
N = 193
Due to rounding, percentages do not sum to 100.
Source: NFER Harnessing Technology School Leadership Survey 2008.
Table 1.8 Q3 Which of these best describes your role in school?
Response %
Primary
ICT co-ordinator 64
ICT subject leader 21
Headteacher 9
Deputy headteacher 7
ICT manager 5
Assistant headteacher 2
ICT adviser 2
Head of ICT 1
Bursar 0
Other 5
No response 1
N = 176
Secondary
ICT co-ordinator 25
Head of ICT 29
ICT manager 25
ICT subject leader 11
Assistant headteacher 8
Deputy headteacher 3
ICT adviser 1
Bursar 0
Response %
Other 4
No response 1
N = 184
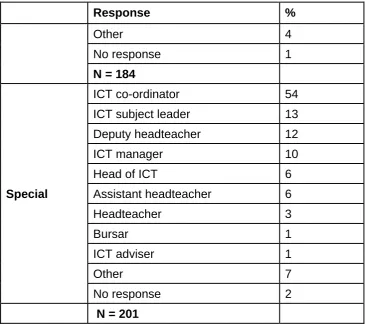
Special
ICT co-ordinator 54
ICT subject leader 13
Deputy headteacher 12
ICT manager 10
Head of ICT 6
Assistant headteacher 6
Headteacher 3
Bursar 1
ICT adviser 1
Other 7
No response 2
N = 201
Due to rounding, percentages do not sum to 100.
[image:12.595.66.432.104.428.2]Source: NFER Harnessing Technology School ICT Coordinator Survey 2008.
Table 1.9 Q5 Which of these best describes your current role in school?
Response %
Primary
Subject co-ordinator 42
Class teacher 39
Department head 4
SENCO 2
Response %
Other 6
No response 1
N = 793
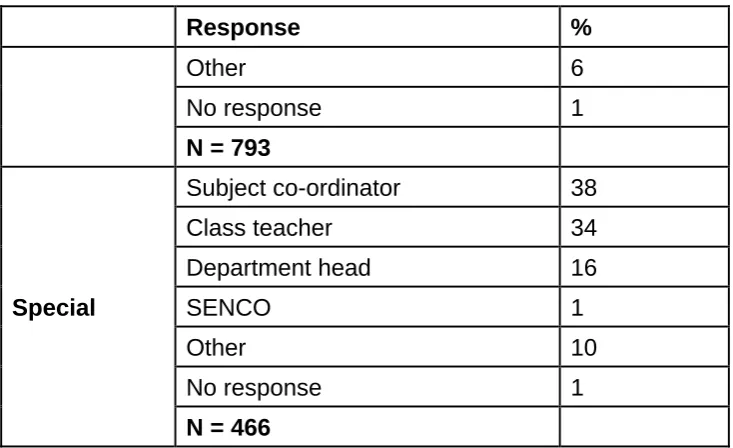
Special
Subject co-ordinator 38
Class teacher 34
Department head 16
SENCO 1
Other 10
No response 1
N = 466
Due to rounding, percentages do not sum to 100.
[image:13.595.66.433.103.327.2]Source: NFER Harnessing Technology School Teacher Survey 2008.
Table 1.10 Q3 What subject do you primarily teach/are you primarily responsible for?
Response %
Primary
English 26
Maths 21
Science 21
Multiple subjects 19
PE 2
History 1
Design and technology 1
No response 8
N = 419
Secondary
Maths 17
English 16
Design and technology 16
Science 15
History 14
Response %
Multiple subjects 1
No response 9
N = 793
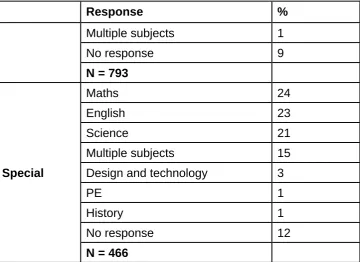
Special
Maths 24
English 23
Science 21
Multiple subjects 15
Design and technology 3
PE 1
History 1
No response 12
N = 466
Due to rounding, percentages do not sum to 100.
Source: NFER Harnessing Technology School Teacher Survey 2008.
Schools were advised to circulate questionnaires to teachers within the core subjects of English, mathematics and science. Secondary schools were also asked to
[image:14.595.70.431.105.367.2]circulate questionnaires to teachers of design and technology, PE and history. The above distribution, therefore, reflects this guidance.
Table 1.11 Q4 Which key stage(s) do you teach?
Response %
Primary
Key Stage 2 50
Key Stage 1 46
Foundation Stage 21
Key Stage 3 0
Response %
Key Stage 2 9
Foundation Stage 0
Key Stage 1 0
No response 1
N = 793
Special
Key Stage 3 57
Key Stage 4 54
Key Stage 2 36
Key Stage 1 21
Post-16 15
Foundation Stage 12
No response 2
N = 466
More than one answer could be given, so percentages do not sum to 100.
Source: NFER Harnessing Technology School Teacher Survey 2008.
Just over one-fifth of respondents in primary schools reported teaching Foundation Stage.
In secondary schools, a very high proportion of respondents reported teaching Key Stage 3, while just under half of respondents taught the post-16 year group.
In special schools, the largest proportion of respondents reported teaching at secondary level, in particular at Key Stage 3.
2. Technological infrastructure
2.1 ICT equipment
Table 2.1 Q4 Please indicate how many of the following types of ICT equipment are available at your school for teaching and learning (differentiate availability for pupils and teachers)
Response Desktop
computers
Laptops Interactive whiteboards
Handheld computers
Data loggers
Tablet PCs
Primary Pupils Mean 27 20 9 7 4 3
Median 25 12 8 7 2 2
Min 1 1 1 1 1 1
Max 75 180 94 15 30 16
N 162 98 135 6 68 14
Teachers and teaching support staff
Mean 15 12 9 4 4 3
Response Desktop computers
Laptops Interactive whiteboards
Handheld computers
Data loggers
Tablet PCs
Secondary Pupils Mean 246 49 24 48 12 12
Median 223 32 20 10 10 10
Min 35 1 1 1 1 1
Max 620 552 80 550 60 43
N 171 144 95 17 101 19
Teachers and teaching support staff
Mean 87 61 28 8 8 6
Median 50 60 24 5 5 2
Min 4 2 2 1 1 1
Max 800 200 84 100 30 49
N 162 169 122 63 41 40
Special Pupils Mean 33 9 9 28 3 6
Median 26 6 8 3 2 3
Min 4 1 1 1 1 1
Max 260 54 28 340 20 16
N 185 119 157 14 51 13
Teachers and teaching support staff
Mean 19 16 9 5 4 3
Median 10 14 8 2 1 2
Response Desktop computers
Laptops Interactive whiteboards
Handheld computers
Data loggers
Tablet PCs
Max 200 85 28 45 30 16
N 154 182 104 29 28 20
Due to rounding, percentages do not sum to 100.
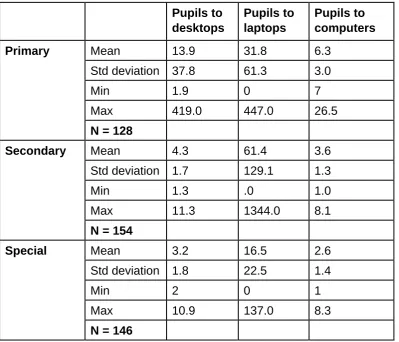
Table 2.1a Numbers of pupils to laptops, desktops and computers (ie desktops plus laptops) in each school1
Pupils to desktops
Pupils to laptops
Pupils to computers
Primary Mean 13.9 31.8 6.3
Std deviation 37.8 61.3 3.0
Min 1.9 0 7
Max 419.0 447.0 26.5
N = 128
Secondary Mean 4.3 61.4 3.6
Std deviation 1.7 129.1 1.3
Min 1.3 .0 1.0
Max 11.3 1344.0 8.1
N = 154
Special Mean 3.2 16.5 2.6
Std deviation 1.8 22.5 1.4
Min 2 0 1
Max 10.9 137.0 8.3
N = 146
Source: NFER Harnessing Technology School ICT Coordinator Survey 2008.
In primary schools, there were an average (mean) of 6.3 pupils to every computer (desktops and laptops). In secondary schools this number was slightly lower, with an average of 3.6 pupils to one computer, and in special schools it was lower still, with an average of 2.6 pupils to every computer.
1
Table 2.2 Q6 Which operating systems (OS) are installed on the majority of your client devices (computers)?
Response %
Primary
Windows XP 93
Windows 2000 15
Window other 7
Windows Vista 5
Apple/MAC OS X 4
Windows NT 3
Apple/MAC OS 9 1
Apple/MAC other 0
Linux Red Hat 0
Linux Ubuntu 0
Linux Suse 0
Linux Xandros 0
Linux Debian 0
Linux other 0
Other 1
No response 1
N = 176
Secondary
Windows XP 95
Windows 2000 10
Apple/MAC OS X 9
Windows Vista 3
Window other 3
Response %
Apple/MAC OS 9 0
Linux Debian 0
Linux other 0
Other 2
No response 1
Special N = 184
Windows XP 95
Windows 2000 10
Windows Vista 7
Window other 6
Apple/MAC OS X 4
Apple/MAC OS 9 1
Apple/MAC other 0
Linux Red Hat 0
Linux Ubuntu 0
Linux Suse 0
Linux Xandros 0
Linux Debian 0
Linux other 0
Windows NT 1
Other 2
No response 0
N = 201
More than one answer could be given, so percentages do not sum to 100.
Source: NFER Harnessing Technology School ICT Coordinator Survey 2008.
The majority of respondents across each of the three types of schools reported that Windows XP was the operating system installed on the majority of their client
Table 2.3 Q7 How would you rate the general fitness for purpose of the following types of equipment that are available for use in your school?
Response Very good
%
Quite good %
Not very good
%
Poor %
Not available %
No response %
Primary
Interactive whiteboards 71 21 3 1 2 3
Laptops 46 42 7 1 1 3
Desktop computers 43 44 7 2 0 3
Data loggers 8 25 8 1 40 18
Tablet PCs 4 4 2 2 68 21
Handheld computers/PDAs 3 5 1 1 69 22
N = 176
Interactive whiteboards 58 36 4 1 0 1
Response Very good
%
Quite good
%
Not very good %
Poor
%
Not available
%
No response
%
Special
Interactive whiteboards 68 27 1 2 1 3
Desktop computers 43 48 7 1 0 2
Laptops 41 50 6 2 0 2
Data loggers 7 15 9 3 47 20
Handheld computers/PDAs
6 7 4 0 64 19
Tablet PCs 6 3 4 67 21
N = 201
Due to rounding, percentages do not sum to 100.
Table 2.3a Q7 How would you rate the general fitness for purpose of the following types of equipment that are available for use in your school? (Combined responses)2
Response Good % Not good % N
Primary
Interactive whiteboards 96 4 167
Laptops 92 8 168
Desktop computers 90 10 171
Data loggers 80 21 73
Tablet PCs 70 30 20
Handheld computers/ PDAs 88 13 16
N = 176
Secondary
Interactive whiteboards 96 4 182
Desktop computers 93 7 180
Laptops 86 15 179
Data loggers 68 32 122
Handheld computers/ PDAs 72 28 61
Tablet PCs 78 22 49
N = 184
Special
Interactive whiteboards 97 3 195
Desktop computers 92 8 198
Laptops 92 8 198
Data loggers 66 34 67
Handheld computers/ PDAs 77 24 34
Tablet PCs 68 32 25
N = 201
In terms of the fitness for purpose of ICT equipment in schools, in general,
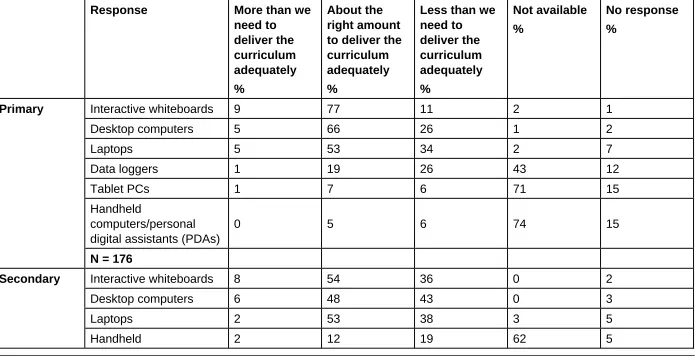
Table 2.4 Q8 How would you rate the quantity of the following different types of equipment that are available for use in your school?
Response More than we
need to deliver the curriculum adequately %
About the right amount to deliver the curriculum adequately %
Less than we need to deliver the curriculum adequately %
Not available %
No response %
Primary Interactive whiteboards 9 77 11 2 1
Desktop computers 5 66 26 1 2
Laptops 5 53 34 2 7
Data loggers 1 19 26 43 12
Tablet PCs 1 7 6 71 15
Handheld
computers/personal digital assistants (PDAs)
Response More than we need to
deliver the curriculum adequately
%
About the right amount to deliver the curriculum adequately
%
Less than we need to deliver the curriculum adequately
%
Not available
%
No response
%
computers/personal digital assistants (PDAs)
Tablet PCs 2 10 18 63 7
Data loggers 1 33 37 21 8
N = 184
Special Interactive whiteboards 9 66 23 1 1
Desktop computers 5 76 18 0 2
Laptops 3 57 33 4 3
Data loggers 1 14 20 54 11
Handheld
computers/personal digital assistants (PDAs)
1 11 4 73 11
Tablet PCs 0 6 6 76 12
N = 201
Source: NFER Harnessing Technology School ICT Coordinator Survey 2008.
Table 2.4a Q8 How would you rate the quantity of the following different types of equipment that are available for use in your school?3
Response More than we need to deliver the curriculum adequately
%
About the right amount to deliver the curriculum adequately
%
Less than we need to deliver the curriculum adequately
%
N
Primary Interactive whiteboards
9 80 11 170
Desktop computers
5 68 27 171
Laptops 5 58 37 161
Data loggers 1 41 58 80
Response More than we need to deliver the curriculum adequately
%
About the right amount to deliver the curriculum adequately
%
Less than we need to deliver the curriculum adequately
%
N
Desktop computers
6 50 44 179
Laptops 2 57 41 170
Handheld
computers/PDAs 7 37 57 60
Tablet PCs 7 33 60 55
Data loggers 2 47 52 131
Special Interactive whiteboards
9 68 24 197
Desktop computers
5 77 18 198
Laptops 3 61 36 188
Data loggers 1 41 58 69
Handheld
computers/PDAs 3 72 25 32
Tablet PCs 0 48 52 23
Due to rounding, percentages do not sum to 100.
On the whole, primary and special schools tended to think that they had the right number of whiteboards and desktop computers to deliver the curriculum adequately.
[image:30.595.68.532.258.751.2]Among secondary schools, around half of those schools that provided a valid response, and over one-third of respondents, reporting that they had fewer interactive whiteboards and desktop computers than they needed to deliver the curriculum effectively.
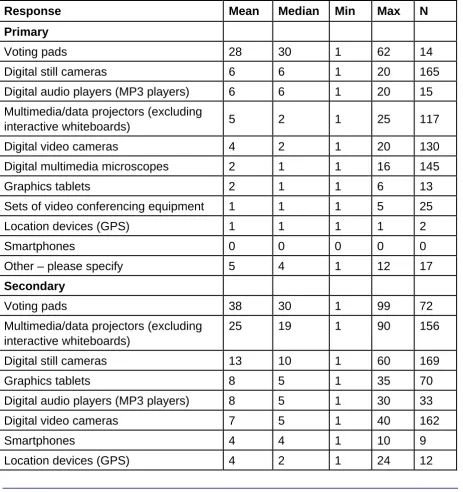
Table 2.5 Q9 How many of the following devices are available at your school for teaching and learning?
Response Mean Median Min Max N
Primary
Voting pads 28 30 1 62 14
Digital still cameras 6 6 1 20 165
Digital audio players (MP3 players) 6 6 1 20 15
Multimedia/data projectors (excluding
interactive whiteboards) 5 2 1 25 117
Digital video cameras 4 2 1 20 130
Digital multimedia microscopes 2 1 1 16 145
Graphics tablets 2 1 1 6 13
Sets of video conferencing equipment 1 1 1 5 25
Location devices (GPS) 1 1 1 1 2
Smartphones 0 0 0 0 0
Other – please specify 5 4 1 12 17
Secondary
Voting pads 38 30 1 99 72
Multimedia/data projectors (excluding interactive whiteboards)
25 19 1 90 156
Response Mean Median Min Max N
Digital multimedia microscopes 3 2 1 25 99
Sets of video-conferencing equipment 2 1 1 20 68
Other – please specify 5 4 1 16 9
Special
Voting pads 29 30 10 64 13
Digital still cameras 11 10 1 34 191
Digital video cameras 4 3 1 25 178
Graphics tablets 4 3 1 16 29
Multimedia/data projectors (excluding
interactive whiteboards) 4 2 1 36 146
Digital audio players (MP3 players) 4 2 1 16 29
Smartphones 3 2 1 6 3
Sets of video-conferencing equipment 3 1 1 20 30
Digital multimedia microscopes 2 1 1 9 136
Location devices (GPS) 2 1 1 10 9
Other – please specify 8 4 1 40 27
Source: NFER Harnessing Technology School ICT Coordinator Survey 2008.
Considering all the different devices that were listed in this particular question for ICT co-ordinators about assistive technology in their schools, the most frequently
reported devices were voting pads, with an average (mean) of 28 or more voting pads in schools across each of the sectors.
Table 2.6 Q11 Does your school have any of the following assistive technology devices that are used to support pupils with special educational needs?
Response %
Primary
Devices to support physical access (eg tracker balls,
switches, alternative/onscreen keyboards, pointing devices)
35
Devices to support sensory access (eg video magnifiers, text-to-speech software, screen magnifiers, Braille displays, printers/copiers, hearing loops)
32
Devices to support cognitive access (eg predictive word processors, voice-recognition systems)
Response %
Other 5
No response 46
N = 176
Secondary
Devices to support sensory access (eg video magnifiers, text-to-speech software, screen magnifiers, Braille displays, printers/copiers, hearing loops)
45
Devices to support physical access (eg tracker balls,
switches, alternative/onscreen keyboards, pointing devices)
30
Devices to support cognitive access (eg predictive word processors, voice-recognition systems)
23
Other 3
No response 41
N = 184
Special
Devices to support physical access (eg tracker balls,
switches, alternative/onscreen keyboards, pointing devices)
79
Devices to support sensory access (eg video magnifiers, text-to-speech software, screen magnifiers, Braille displays, printers/copiers, hearing loops)
61
Devices to support cognitive access (eg predictive word processors, voice-recognition systems)
31
Other 16
No response 13
N = 201
More than one answer could be given, so percentages do not sum to 100.
Source: NFER Harnessing Technology School ICT Coordinator Survey 2008.
2.2 Infrastructure
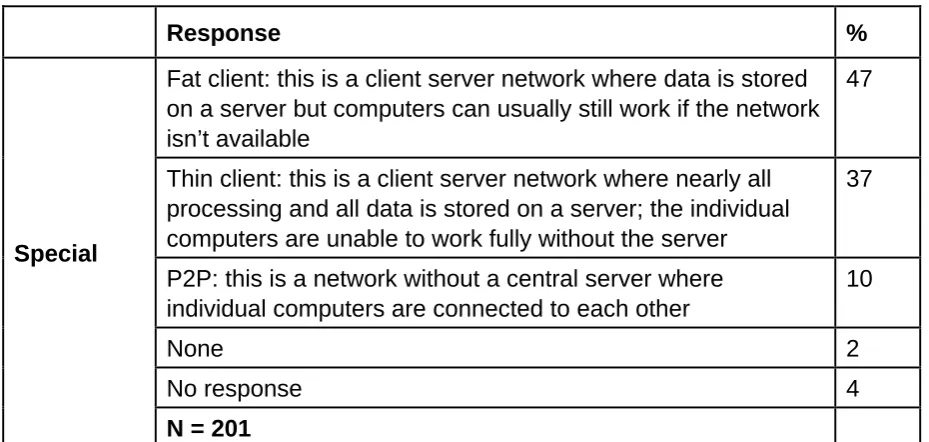
Table 2.7 Q12a Please indicate what type of computer network is provided in your school for learning
Response %
Primary
Fat client: this is a client server network where data is stored on a server but computers can usually still work if the network isn’t available
42
Thin client: this is a client server network where nearly all processing and all data is stored on a server; the individual computers are unable to work fully without the server
39
P2P: this is a network without a central server where individual computers are connected to each other
13
None 4
No response 3
N = 176
Secondary
Fat client: this is a client server network where data is stored on a server but computers can usually still work if the network isn’t available
59
Thin client: this is a client server network where nearly all processing and all data is stored on a server; the individual computers are unable to work fully without the server
34
P2P: this is a network without a central server where individual computers are connected to each other
1
None 1
No response 5
Response %
Special
Fat client: this is a client server network where data is stored on a server but computers can usually still work if the network isn’t available
47
Thin client: this is a client server network where nearly all processing and all data is stored on a server; the individual computers are unable to work fully without the server
37
P2P: this is a network without a central server where individual computers are connected to each other
10
None 2
No response 4
N = 201
Due to rounding, percentages do not sum to 100.
Source: NFER Harnessing Technology School ICT Coordinator Survey 2008.
The most frequently reported response across each of the schools was that the network was a fat client network where data is stored on a server but computers can usually still work if the network is not available. Slightly more secondary schools had this type of network compared with primary and special schools, and the number had increased slightly since the 2007 survey.
[image:34.595.65.530.103.324.2]The least frequently reported network type was P2P (peer to peer); this was particularly true in secondary schools.
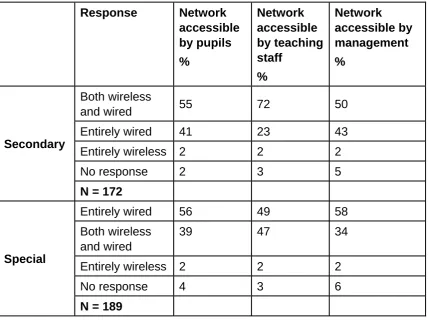
Table 2.8 Q12b Please indicate if this network is wireless, wired or both. (Please answer for pupils and staff)
Response Network accessible by pupils %
Network accessible by teaching staff
%
Response Network accessible by pupils
%
Network accessible by teaching staff
%
Network accessible by management
%
Secondary
Both wireless
and wired 55 72 50
Entirely wired 41 23 43
Entirely wireless 2 2 2
No response 2 3 5
N = 172
Special
Entirely wired 56 49 58
Both wireless and wired
39 47 34
Entirely wireless 2 2 2
No response 4 3 6
N = 189
Due to rounding, percentages do not sum to 100.
A filter question of Q12a.
Source: NFER Harnessing Technology School ICT Coordinator Survey 2008.
[image:35.595.68.498.104.424.2]Networks accessible by pupils were most frequently reported as being entirely wired or a combination of wireless and wired. Almost three-quarters of secondary school respondents reported that teaching staff had access both to wireless and wired networks, while a half of respondents in these schools reported that management had access to both wired and wireless networks.
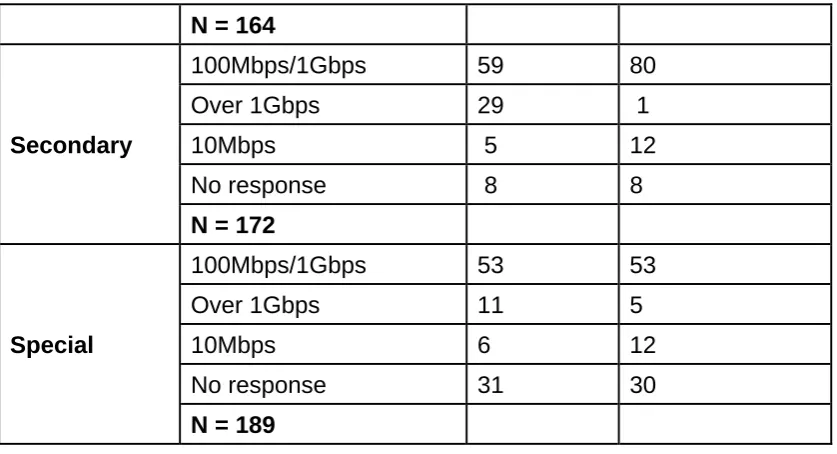
Table 2.9 Q13 At what speed is your network rated?
Response Backbone %
Connection to client devices
%
Primary
100Mbps/1Gbps 31 36
10Mbps 13 14
Over 1Gbps 8 6
N = 164
Secondary
100Mbps/1Gbps 59 80
Over 1Gbps 29 1
10Mbps 5 12
No response 8 8
N = 172
Special
100Mbps/1Gbps 53 53
Over 1Gbps 11 5
10Mbps 6 12
No response 31 30
N = 189
Due to rounding, percentages do not sum to 100.
A filter question of Q12a.
Source: NFER Harnessing Technology School ICT Coordinator Survey 2008.
[image:36.595.67.486.104.331.2]A network speed of 100Mbps/1Gbps was the most frequently reported network speed for both the backbone and connection to client devices across each of the three school types. Respondents in primary and special schools were more likely than respondents in secondary schools to answer ‘no response’ to this question. Fewer primary schools reported a connection speed of 100Mbps/1Gbps in comparison with secondary and special schools.
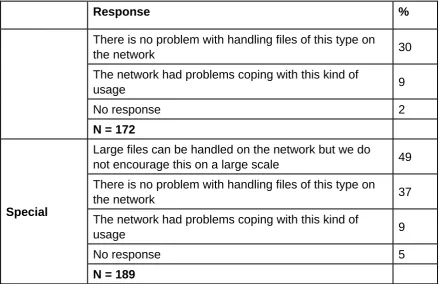
Table 2.10 Q14 Is your network performance sufficient to work with large multimedia files such as large sound or video files?
Response %
There is no problem with handling files of this type on
the network 43
Large files can be handled on the network but we do
Response %
There is no problem with handling files of this type on
the network 30
The network had problems coping with this kind of
usage 9
No response 2
N = 172
Special
Large files can be handled on the network but we do
not encourage this on a large scale 49
There is no problem with handling files of this type on
the network 37
The network had problems coping with this kind of
usage 9
No response 5
N = 189
Due to rounding, percentages do not sum to 100.
A filter question of Q12a.
Source: NFER Harnessing Technology School ICT Coordinator Survey 2008.
[image:37.595.66.507.105.389.2]Almost half of all respondents said that the network could handle large files but that this was not encouraged on a large scale. This was more the case in secondary and special schools. In primary schools, most respondents said they had no problem handling large multimedia files on their networks.
Table 2.11 Q15a Who has the main responsibility for day-to-day maintenance and support for your school’s network(s)?
Response %
Primary
A teacher/ICT co-ordinator 24
An ICT technician who is shared with another
school 20
A local authority support service 18
A dedicated, school-based ICT technician 15
An ICT technician who is loaned from another
school 4
Response %
Other 17
No response 0
N = 164
Secondary
A dedicated, school-based ICT technician 80
A teacher/ICT co-ordinator 2
ICT supplier 2
An ICT technician who is shared with another
school 1
An ICT technician who is loaned from another
school 0
A local authority support service 0
Other 13
No response 1
N = 172
Special
A dedicated, school-based ICT technician 39
A teacher/ICT co-ordinator 16
A local authority support service 13
An ICT technician who is shared with another
school 10
ICT supplier 4
An ICT technician who is loaned from another
school 1
Other 15
No response 3
N = 189
Due to rounding, percentages do not sum to 100.
Around a quarter of primary school respondents reported that a teacher or ICT co-ordinator had the main responsibility for day-to-day maintenance and support of the school’s network(s); this was the most frequent response in primary schools, closely followed by sharing an ICT technician with another school, cited by around a fifth of respondents in primary schools.
Table 2.12 Q16 Which of the following best describes the way your school monitors the performance of its network(s)?
Response %
Primary
Ad hoc basis according to need 63
Pre-determined schedule 26
No monitoring takes place 10
No response 1
N = 164
Secondary
Ad hoc basis according to need 66
Pre-determined schedule 29
No monitoring takes place 4
No response 1
N = 172
Special
Ad hoc basis according to need 64
Pre-determined schedule 23
No monitoring takes place 10
No response 4
N = 189
Due to rounding, percentages do not sum to 100.
A filter question of Q12a.
Source: NFER Harnessing Technology School ICT Coordinator Survey 2008.
The most commonly reported response, across all three school sectors, was that schools monitored the performance of their network(s) on an ad hoc basis according to need. Similar proportions – around two-thirds – of respondents in each of primary, secondary and special schools reported this to be the case.
Table 2.13 Q17 How often is this monitoring carried out?
Response %
Primary
Less often than weekly, at least monthly 31
At least weekly 24
Less often than monthly, at least termly 22
Less than once a term 20
No response 2
N = 147
Secondary
At least weekly 45
Less often than weekly, at least monthly 26
Less often than monthly, at least termly 19
Less than once a term 9
No response 1
N = 163
Special
At least weekly 37
Less often than weekly, at least monthly 29
Less than once a term 17
Less often than monthly, at least termly 13
No response 4
N = 164
Due to rounding, percentages do not sum to 100.
A filter question of Q12a.
Source: NFER Harnessing Technology School ICT Coordinator Survey 2008.
Table 2.14 Q15 How frequently do technical problems that prevent the delivery of your lessons occur with each of the following?
Response At least once a week %
About once every 2–3 weeks %
About once a month
%
About once a term
%
Less often
%
Never %
No
response
%
Primary
Computers used by pupils
17 20 15 19 23 3 3
Printers 13 21 22 20 19 2 2
The school’s network
9 15 19 21 24 6 7
The school’s internet connection
8 18 22 27 20 2 2
Interactive
whiteboards 6 12 15 19 36 7 5
Response At least once a week
%
About once every 2–3 weeks
%
About once a month %
About once a term
%
Less often %
Never
%
No
response %
Secondary
Computers used by pupils
16 17 17 19 21 4 5
Printers 14 15 19 18 26 5 3
The school’s internet connection
11 15 21 24 24 3 3
The school’s network
9 13 18 22 29 5 3
Interactive
Response At least once a week
%
About once every 2–3 weeks
%
About once a month %
About once a term
%
Less often %
Never
%
No
response %
Special
N = 793
Printers 14 19 17 21 21 5 4
Computers used by pupils
12 17 23 22 18 5 4
The school’s internet connection
9 17 20 31 17 4 3
The school’s network
8 13 15 27 24 6 8
Interactive
whiteboards 5 11 12 21 36 9 6
N = 466
Due to rounding, percentages do not sum to 100.
Technical problems were least often encountered with the school’s network (around a third of respondents across all three sample groups indicated that technical
problems occurred less often than once a term or never) and interactive whiteboards (more than half of respondents in primary and secondary schools indicated that technical problems occurred less often than once a term or never, and slightly under half of respondents in special schools reported a similar level of incidence).
Teachers in almost one-fifth of primary and secondary schools and just over one in 10 special schools reported technical problems at least once a week with pupils’ computers. Half of respondents in all sample groups reported technical problems occurring with printers at least once a month.
[image:44.595.66.452.354.697.2]2.3 Connectivity
Table 2.15 Q5 Please indicate how many of your computers are regularly connected to a network or to the internet
Response Connected to a network
%
Connected to the internet
%
Primary
All 69 75
More than half 17 13
Less than half 4 0
About half 3 3
None 2 0
No response 6 9
N = 176
Secondary
All 94 88
More than half 5 5
About half 0 1
Response Connected to a network
%
Connected to the internet %
Special
All 66 73
More than half 22 17
About half 3 2
Less than half 2 1
None 4 0
No response 4 7
N = 201
Due to rounding, percentages do not sum to 100.
Source: NFER Harnessing Technology School ICT Coordinator Survey 2008.
[image:45.595.67.451.102.309.2]On the whole, most ICT co-ordinators who responded to the survey said that all of their computers were regularly connected to a network or the internet. This response was most noticeable in secondary schools, where over 90 per cent of respondents reported that all of their computers were networked and over 80 per cent of their computers were connected to the internet. The proportion of respondents who said their computers were networked was slightly lower in primary schools (69 per cent) and special schools (66 per cent), but still more than half of respondents reported that all of their computers were networked and/or connected to the internet.
Table 2.16 Q18 Which of these best describes internet access at your school?
Response %
Primary
Staff have access, pupils have access only under
supervision 64
Staff and pupils have access 35
Staff have access but pupils have no access 0
My school does not have access to the internet 0
No response 1
Response %
Secondary
Staff and pupils have access 73
Staff have access, pupils have access only under
supervision 25
Staff have access but pupils have no access 1
My school does not have access to the internet 0
No response 2
N = 184
Special
Staff have access, pupils have access only under
supervision 63
Staff and pupils have access 36
Staff have access but pupils have no access 1
My school does not have access to the internet 0
No response 1
N = 201
Due to rounding, percentages do not sum to 100.
[image:46.595.67.494.107.404.2]Source: NFER Harnessing Technology School ICT Coordinator Survey 2008.
Table 2.16a Q18 Which of these best describes internet access at your school?4
Response %
Primary
Staff have access, pupils have access only
under supervision 64
Staff and pupils have access 36
Staff have access but pupils have no access 0
N = 174
Response %
Special
Staff have access, pupils have access only
under supervision 64
Staff and pupils have access 36
Staff have access but pupils have no access 1
N = 200
Due to rounding, percentages do not sum to 100.
Source: NFER Harnessing Technology School ICT Coordinator Survey 2008.
Around three-quarters of respondents in secondary schools reported that staff and pupils have access to the internet. A lower proportion of respondents in primary and special schools reported that staff and pupils have access to the internet: just over one-third in each.
In primary and special schools, the most common response was that staff have access but pupils have supervised access; this was reported by just under two-thirds of primary and special schools.
Table 2.17 Q19 Where can teachers and teaching support staff access the internet within your school?
Response %
Primary
In all classrooms 97
In a dedicated ICT room/suite 67
In a library/learning resource centre 48
In a staff room 48
In a school hall 21
In about half of classrooms 2
In less than half of classrooms 1
Other 14
No response 0
Response %
Secondary
In all classrooms 82
In a library/learning resource centre 80
In a staff room 78
In a dedicated ICT room/suite 76
In a school hall 35
In about half of classrooms 13
In less than half of classrooms 4
Other 11
No response 1
N = 180
Special
In all classrooms 96
In a dedicated ICT room/suite 62
In a library/learning resource centre 57
In a staff room 55
In a school hall 25
In about half of classrooms 3
In less than half of classrooms 0
Other 11
No response 1
N = 200
More than one answer could be given, so percentages do not sum to 100.
A filter question of Q18.
Source: NFER Harnessing Technology School ICT Coordinator Survey 2008.
Table 2.18 Q20a How would you rate the school’s internet connection in terms of:
Speed
Response %
Primary
Fast enough for all or most of our requirements
72
Fast enough for some of our requirements 21
Not fast enough for our requirements 8
No response 0
N = 174
Secondary
Fast enough for all or most of our requirements
69
Fast enough for some of our requirements 22
Not fast enough for our requirements 9
No response 1
N = 180
Special
Fast enough for all or most of our requirements
70
Fast enough for some of our requirements 23
Not fast enough for our requirements 7
No response 1
N = 200
Due to rounding, percentages do not sum to 100.
A filter question of Q18.
Source: NFER Harnessing Technology School ICT Coordinator Survey 2008.
Table 2.19 Q20b How would you rate the school’s internet connection in terms of:
Performance
Response %
Primary
About the right amount to deliver the curriculum adequately 67
More than we need to deliver the curriculum adequately 22
Less than we need to deliver the curriculum adequately 12
No response 0
N = 174
Secondary
About the right amount to deliver the curriculum adequately 61
More than we need to deliver the curriculum adequately 26
Less than we need to deliver the curriculum adequately 12
No response 1
N = 180
Special
About the right amount to deliver the curriculum adequately 68
More than we need to deliver the curriculum adequately 22
Less than we need to deliver the curriculum adequately 10
No response 2
N = 200
Due to rounding, percentages do not sum to 100.
A filter question of Q18.
Source: NFER Harnessing Technology School ICT Coordinator Survey 2008.
In terms of performance, the response from ICT co-ordinators in each type of school was fairly similar. Over 60 per cent said that the performance of their schools’
Table 2.20 Q20c How would you rate the school’s internet connection in terms of:
Reliability
Response %
Primary
Functioning most of the time 67
Always functioning 23
Fails regularly 9
No response 1
N = 174
Secondary
Functioning most of the time 56
Always functioning 37
Fails regularly 5
No response 2
N = 180
Special
Functioning most of the time 64
Always functioning 28
Fails regularly 7
No response 2
N = 200
Due to rounding, percentages do not sum to 100.
A filter question of Q18.
Source: NFER Harnessing Technology School ICT Coordinator Survey 2008.
Table 2.21 Q21 Does your school have its own website?
Response %
Primary
Yes 78
No 17
No response 5
N = 176
Secondary
Yes 90
No 3
No response 8
N = 184
Special
Yes 75
No 21
No response 4
N = 201
Due to rounding, percentages do not sum to 100.
Source: NFER Harnessing Technology School ICT Coordinator Survey 2008
Over 80 per cent of schools (across each sector) reported having their own websites. This was particularly noticeable in secondary schools, where 90 per cent of
Table 2.22a Q22 Which of the following is your school website used for?
Response %
Primary
School news 88
Parent resources (eg calendar of events) 79
Providing access to school policy documents 57
Email access for staff/learners/parents 23
(Learner) performance information for parents 15
Providing pupil lesson resources 13
Homework upload/download 7
(Learner) performance information for school staff
6
Providing teacher lesson resources 5
Communication with individual parents 4
Access to management information systems (MIS)
3
Job vacancies 3
Discussion forum 2
Live chat 0
Webcam 0
Other 8
No response 7
N = 137
More than one answer could be given, so percentages do not sum to 100.
A filter question of Q21.
Table 2.22b Q22 Which of the following is your school website used for?
Response %
Secondary
School news 89
Parent resources (eg calendar of events) 68
Providing access to school policy documents 48
Job vacancies 22
Email access for staff/learners/parents 19
Providing pupil lesson resources 15
(Learner) performance information for parents 10
Providing teacher lesson resources 10
Discussion forum 6
Homework upload/download 5
Access to management information systems
(MIS) 3
(Learner) performance information for school
staff 3
Webcam 2
Live chat 1
Communication with individual parents 0
Other 12
No response 5
N = 150
More than one answer could be given, so percentages do not sum to 100.
A filter question of Q21.
Table 2.22c Q22 Which of the following is your school website used for?
Response %
Special
School news 93
Parent resources (eg calendar of events) 81
Job vacancies 64
Providing access to school policy documents 64
Email access for staff/learners/parents 45
Providing pupil lesson resources 37
Providing teacher lesson resources 25
Homework upload/download 21
(Learner) performance information for parents 15
Discussion forum 13
Access to management information systems (MIS)
9
(Learner) performance information for school staff 8
Live chat 5
Communication with individual parents 3
Webcam 2
Other 3
No response 3
N = 165
More than one answer could be given, so percentages do not sum to 100.
A filter question of Q21.
Source: NFER Harnessing Technology School ICT Coordinator Survey 2008.
Across each of the school sectors, school news and parent resources were the most popular uses of the school’s website. Around 90 per cent of respondents across each of the different school types reported that they used their schools’ websites for disseminating school news. Over 60 per cent of respondents said that they used their schools’ websites for parent resources; this was particularly so in secondary schools (81 per cent) and primary schools (79 per cent).
Table 2.23 Q23 Does your school offer secure login areas through its website to any of the following groups?
Response %
Primary
None of these 62
Teachers 27
Other school staff 20
Pupils 15
Parents 15
Governors 5
Other 2
No response 9
N = 137
Secondary
Teachers 55
Other school staff 39
Pupils 38
None of these 38
Parents 18
Governors 7
Other 3
No response 5
N = 165
Special
None of these 58
Teachers 33
Other school staff 25
Pupils 20
Table 2.23a Q23 Does your school offer secure login areas through its website to any of the following groups?5
Response %
Primary
Teachers 91
Other school staff 66
Pupils 48
Parents 16
Governors 46
Other 5
N = 44
Secondary
Teachers 94
Other school staff 66
Pupils 67
Parents 12
Governors 28
Other 5
N = 102
Special
Teachers 96
Other school staff 73
Pupils 55
Parents 16
Governors 27
Other 7
N = 55
More than one answer could be given, so percentages do not sum to 100.
A filter question of Q21.
Source: NFER Harnessing Technology School ICT Coordinator Survey 2008.
Teachers were the group most frequently reported as having secure login areas through schools’ websites, although around a quarter of other school staff and pupils were also reported as having secure login areas. On the whole, more secondary schools reported that teachers, other school staff and pupils had access to secure
login areas through their schools’ websites compared with primary and special schools.
Table 2.24 Q24 Does your school have its own intranet?
Response %
Primary
No 84
Yes 14
No response 3
N = 176
Secondary
Yes 65
No 33
No response 2
N = 184
Special
No 60
Yes 39
No response 1
N = 201
Due to rounding, percentages do not sum to 100.
Source: NFER Harnessing Technology School ICT Coordinator Survey 2008
Table 2.25 Q25 Which of the following can access your school intranet?
Response %
Primary
Teachers 100
Other school staff 96
Pupils 63
Parents 4
No response 0
N = 24
Secondary
Teachers 99
Other school staff 90
Pupils 85
Parents 7
No response 1
N = 120
Special
Teachers 100
Other school staff 94
Pupils 64
Parents 3
No response 0
N = 78
More than one answer could be given, so percentages do not sum to 100.
A filter question of Q24.
Source: NFER Harnessing Technology School ICT Coordinator Survey 2008.
As a whole, all teachers across each school sector were reported as being able to access their schools’ intranets. The majority of other school staff and around three-quarters of pupils were also able to access their schools’ intranets.
The access for these individuals was fairly similar across primary, secondary and special schools, although more pupils in secondary schools (85 per cent) were reported as being able to access their schools’ intranets compared with 64 per cent in special schools and 63 per cent in primary schools.
Response %
Primary
Teachers 96
Other school staff 88
Pupils 54
Parents 4
No response 4
N = 24
Secondary
Teachers 95
Other school staff 85
Pupils 81
Parents 8
No response 5
N = 120
Special
Teachers 95
Other school staff 90
Pupils 49
Parents 1
No response 5
N = 78
More than one answer could be given, so percentages do not sum to 100.
A filter question of Q24.
Source: NFER Harnessing Technology School ICT Coordinator Survey 2008.
Across all sectors, the majority of respondents said that teachers could download material from their schools’ intranets. Most respondents also reported that other school staff and pupils were able to download material from their schools’ intranets.
[image:60.595.67.445.103.493.2]Response %
Primary
School does not have a network for
learning 59
No-one 14
Senior teaching or administrative staff
13
Other teachers 11
Other school staff 7
Pupils 7
Parents or carers 2
No response 15
N = 176
Secondary
Senior teaching or administrative staff
44
Other teachers 42
Pupils 38
Other school staff 36
School does not have a network for learning
35
Parents or carers 11
No-one 10
No response 12
N = 184
Special
School does not have a network for
learning 59
Senior teaching or administrative staff
18
No-one 15
Other teachers 15
Other school staff 12
Pupils 6
Parents or carers 4
No response 11
More than one answer could be given, so percentages do not sum to 100.
Source: NFER Harnessing Technology School ICT Coordinator Survey 2008
Around half of respondents said that their schools did not have a network for learning. This number was proportionally greater in primary and special schools. In both primary and special schools, 59 per cent of respondents said that their schools did not have a network for learning compared with 35 per cent of respondents in secondary schools.
[image:62.595.64.415.340.672.2]In the cases where schools did have a network for learning, around a quarter reported that senior teaching or administrative staff could access the network from outside the school, and just under a quarter said that the network could be accessed from outside the school by other teachers.
Table 2.28 Q20 Are you able to access the school’s network from home?
Response %
Primary
No 72
Don’t know 12
Yes 8
No response 8
N = 419
Secondary
No 45
Yes 40
Don’t know 10
No response 5
N = 793
Special
No 67
Yes 16
secondary schools indicated that they were able to access the school’s network from home. In primary schools, 8 per cent of teachers said they had home access.
Table 2.29 Q21 Do you access the network from home via a broadband connection?
Response %
Primary
Yes 77
No 17
Don’t know 6
No response 0
N = 35
Secondary
Yes 85
No 13
Don’t know 1
No response 2
N = 318
Special
Yes 78
No 19
Don’t know 0
No response 3
N = 73
Due to rounding, percentages do not sum to 100.
A filter question of Q20.
Source: NFER Harnessing Technology School Teacher Survey 2008.
3. Management, leadership and administration
[image:64.595.68.476.202.620.2]3.1 ICT strategy and leadership
Table 3.1 Q4 Does your school have a written strategy or improvement plan for ICT and/or e-learning?
Response %
Primary
Yes, it is embedded within the whole-school
development/improvement plan 70
Yes, we have a separate ICT strategy/plan
(separate from whole-school strategy) 22
No, we don’t have a written strategy/plan 4
No response 4
N = 159
Secondary
Yes, it is embedded within the whole-school
development/improvement plan 62
Yes, we have a separate ICT strategy/plan
(separate from whole-school strategy) 23
No, we don’t have a written strategy/plan 11
No response 3
N = 150
Special
Yes, it is embedded within the whole-school
development/improvement plan 71
Yes, we have a separate ICT strategy/plan
(separate from whole-school strategy) 22
No, we don’t have a written strategy/plan 4
No response 4
N = 193
Table 3.2 Q5a How often is this strategy/plan reviewed?
Response %
Primary
At least annually 84
About every two years 13
About every three years 2
Less often 1
No response 1
N = 146
Secondary
At least annually 84
About every two years 9
About every three years 4
Less often 1
No response 3
N = 128
Special
At least annually 86
About every two years 7
About every three years 4
Less often 0
No response 2
N = 179
Due to rounding, percentages do not sum to 100.
Source: NFER Harnessing Technology School Leadership Survey 2008
Table 3.3a Q6 Please identify which of the following elements are
addressed in the strategy AND identify up to three elements which you are prioritising this year
Primary
Response Elements addressed
in ICT strategy %
Elements prioritising this year
%
Replacement of equipment 80 43
Teacher CPD 73 36
Investments in school ICT infrastructure
61 28
E-safety 54 15
Acceptable use policy 47 8
Participation in the SRF 45 18
Using technology for personalising learning
38 19
Use of learning platform 34 26
Documented data protection policy
34 1
Policy on safe disposal of equipment
30 2
Purchasing of learning platform 25 17
Using technology to offer integrated services via extended school
14 6
Participation in home access scheme
Table 3.3b Q6 Please identify which of the following elements are
addressed in the strategy AND identify up to three elements which you are prioritising this year
Secondary
Response Elements addressed in
ICT strategy
%
Elements prioritising this year
%
Replacement of equipment 84 31
Investments in school ICT
infrastructure 75 32
Use of learning platform 73 55
Using technology for
personalising learning 66 43
Acceptable use policy 64 5
Teacher CPD 63 28
E-safety 63 13
Documented data protection policy
48 5
Purchasing of learning platform 44 23
Participation in the SRF 42 22
Participation in home access
scheme 37 10
Policy on safe disposal of
equipment 23 3
Using technology to offer integrated services via extended school
22 5
Other 2 3
No response 4 3
N = 128 N = 107
More than one answer could be given, so percentages do not sum to 100.
Table 3.3c Q6 Please identify which of the following elements are
addressed in the strategy AND identify up to three elements which you are prioritising this year
Special
Response Elements addressed in
ICT strategy
%
Elements
prioritising this year
%
Replacement of equipment 80 42
Teacher CPD 76 38
Investments in school ICT infrastructure 70 36
Participation in the SRF 56 16
E-safety 54 11
Using technology for personalising
learning 52 25
Acceptable use policy 52 8
Documented data protection policy 46 3
Use of learning platform 35 31
Policy on safe disposal of equipment 34 3
Purchasing of learning platform 28 14
Participation in home access scheme 20 10
Using technology to offer integrated
services via extended school 12 4
Other 5 6
No response 3 8
N = 179 N = 159
More than one answer could be given, so percentages do not sum to 100.
Table 3.4 Q7 Who is involved in developing your school’s whole-school ICT development strategy or plan for improvement? Who has the key responsibility for this plan?
Response Involved in
%
Has key
responsibility
%
Primary Headteacher 87 21
ICT co-ordinator/ICT subject
leader/head of ICT 81 53
School leadership team 66 7
Governors 64 0
ICT technical staff 36 1
No response 2 18
N = 146
Secondary School leadership team 90 38
ICT co-ordinator/ICT subject
leader/head of ICT 90 32
Headteacher 81 11
ICT technical staff 72 2
Governors 63 0
No response 3 18
N = 128
Special ICT co-ordinator/ICT subject
leader/head of ICT 87 57
Headteacher 84 13
School leadership team 75 7
Governors 61 2
ICT technical staff 61 0
No response 2 22
N = 179
More than one answer could be given, so percentages do not sum to 100.