Isra Samtisart
A thesis submitted for the degree of Doctor of Philosophy
of the Australian National University.
Unless otherwise indicated
this thesis is my own work.
Isra Sarntisart
ACKNOWLEDGEMENTS
It is a pleasure to acknowledge my indebtness to many people for all of their
assistance during the years of my PhD study.
My particular appreciation is to my supervisor, Prof. Peter G. Warr,
whose support and guidance has been unfailing, and to my advisors - Drs.
Medhi Krongkaew, George Fane, and Kali Kalirajan - whose encouragement
and advice has been very helpful.
Members of and visitors to the Department of Economics, Research
School of Pacific Studies also allowed me to interrupt their valuable time. I
especially appreciate Prof. Ross Garnaut, Drs. Ross McLeod, Chris Manning,
Hal Hill, and S. Mahendrarajah, for their valuable suggestions, and Dr.
Premachandra Athukorara, whose short visit to the Department was very
helpful.
I am indebted to many people at the Australian National University.
My special thanks go to Dr. Trevor Breusch, Ross Cunningham, and
Christine Donnelly, whose suggestions and assistance have been
encouraging and helpful; and to Dr. P.N. Junankar, Dr. Rod Tyers,
participants in PhD workshop, and my fellow PhD students, with whom
discussion has been most constructive. I have also benefitted from discussion
with members of the Australia-Thai ACIAR project.
The success of my field work was facilitated by the great assistance of
many people in Bangkok. My sincere thanks go to friends and officials at the
Thailand Development Research Institute Foundation, the Department of
Business Economics, the National Economic and Social Development Board,
the National Statistical Offices, the Office of Agricultural Economics, and the
I am also grateful to the Department of Economics in the Research
School of Pacific Studies, for financial support during my PhD study, and to
the Winrock Foundation for the initial sponsorship for my Masters study.
I wish to express my sincere thank to Carol Kavanagh. Her editorial
assistance has been very helpful.
Finally, my special thanks go to my mother, brother, and sisters for
their thoughful encouragement and data collection, and to my family for
ABSTRACT
During the past three decades, economic growth in Thailand has been
marked by the growing dominance of the manufacturing sector. The share of
manufacturing in GDP and in total exports has increased markedly. At the
same time, there has been a sluggish increase in the share of manufacturing
employment in the total labour force. Consequently, the gap between output
per worker in agriculture and the manufacturing sector has widened.
Concurrently, the distribution of income in Thailand has become more
unequal.
The role of industrial protection in industrial development is well-
known. Many studies have estimated the degree of industrial protection in
Thailand during the past three decades. Many have also attempted to
establish the impact of a move from an import substitution regime towards
an export promotion regime. However, no previous studies have examined
the impact of trade liberalisation on income distribution, which is very
important in policy decisions.
Based on a computable general equilibrium (CGE) model, this thesis
attempts to answer the question: ’What would be the income distribution
impact of a move from the 1987 system of industrial protection towards free
trade?’ The answer to this question contributes to empirical knowledge in the
area of protection and income distribution in Thailand.
This thesis also offers methodologies to estimate the size distribution
of income, and to incorporate income distribution into a general equilibrium
framework. The methodologies enhance the analysis of poverty incidence, as
well as income inequality. The methodologies are applied to analyse the
As part of the database construction, the thesis also constructs a Social
Accounting Matrix (SAM) for Thailand, and estimates a system of consumer
demand. SAM provides some important information for the CGE model,
such as production technology and a factor ownership matrix. The estimation
of consumer demand consists of demand for ten commodities by ten types of
households, enriched by price information. This is the most detailed
estimation of consumer demand everdone for the Thai economy.
Results from simulations using the CGE model confirm the argument
in support of free trade. They show that while the move towards free trade
would lead to a more equal distribution of income, it would also lead to a
government budget deficit. The government might choose to borrow or raise
more revenue, through an across the board increase in indirect tax rates or
direct tax rates, to finance its budget deficit. The decision of the government
CONTENTS
Page
Declaration i
Acknowledgement ii
Abstract iv
Figures xi
Tables xii
Glossary xvii
Chapter 1. Introduction 1
1.1. Background of the Problem 2
1.2. General Equilibrium and Income Distribution 6
1.3. Organisation of the Thesis 8
Chapter 2. Industrialisation and Protection During the 1960s, 1970s, and
1980s 10
2.1. Introduction 10
2.2. Economic Growth and Structural Change 11
2.3. Industrialisation and Protection 14
2.3.1. Development of Industrial Protection 15
2.3.2. Protective Measures 18
2.3.3. Degree of Protection 20
2.4. Productivity and Regional Income 28
2.4.1. Productivity Differences 28
2.4.2. Regional Income Disparities 31
Page
Chapter 3. Income Distribution During the Past Three Decades 35
3.1. Introduction 35
3.2. Poverty Incidence 37
3.2.1. Changes in Poverty 37
3.2.2. Features of Changes 40
3.3. Income Inequality 43
3.3.1. Changes in Inequality 43
3.3.2. Features of Changes 46
3.4. Conclusion 48
Chapter 4. Computable General Equilibrium Model and Its Parameter
Settings 50
4.1. Introduction 50
4.2. Computable General Equilibrium Model 51
4.2.1. Producer Goods Industries 53
4.2.2. Margin Sector 55
4.2.3. Investment and Savings 56
4.2.4. Production of Consumer Goods 58
4.2.5. Household Behaviour 59
4.2.6. Export Demand 61
4.2.7. Government Behaviour 62
4.2.8. Price Determination 64
4.2.9. Market Clearing Conditions 68
4.2.10. Miscellaneous Equations 69
4.3. Social Accounting Matrix 70
4.4. Other Parameter Settings in the Model 76
4.4.1. Base Year Nominal Rates of Protection 76
4.4.2. Substitution Between Skilled and Unskilled
Labour 78
4.4.3. Substitution Among Primary Factors 79
4.4.4. Substitution Between Domestic and Imported
Page
4.4.5. Price Elasticity of World Demand for Thai Export 83
4.4.6. Elasticities of Transformation in Agriculture 84
4.4.7. Other Relevant Parameters 87
Appendix 4.1: Producer Goods, Classified by Trade Orientation 90
Appendix 4.2: Equations in the Model 91
Appendix 4.3: List of Variables 95
Appendix 4.4: List of Parameters 99
Appendix 4.5: Typical List of Exogenous Variables 104
Appendix 4.6: Diagrammatic Explanation of the Model 105
Chapter 5. An Estimation of Consumer Demand 108
5.1. Introduction 108
5.2. Datasets 109
5.2.1. Household Expenditure 109
5.2.2. Regional Price Indices 112
5.3. Theory and Estimation 114
5.3.1. Consumer Demand System 116
5.3.2. Discussion of the Results 121
5.4. Conclusion 127
Appendix 5.1: Demographic Variables in Consumer Demand 129
Chapter 6. Poverty and Income Inequality in the General
Equilibrium Model 143
6.1. Introduction 143
6.2. Source of Data and Choice of Unit 145
6.3. Income Distribution: a Nonparametric Estimation 147
6.4. Poverty Line and Poverty Incidence 152
6.4.1. Poverty Line 152
6.4.2. Axioms 154
6.4.3. Measurement of Poverty 156
6.4.4. Poverty Incidence in 1988 159
Page
6.5.1. Axioms 163
6.5.2. Measurement of Inequality 165
6.5.3. Inequality in 1988 168
6.6. Conclusion 170
Appendix 6.1: Percentage Change Form of FGT Class of Index 176
Appendix 6.2: Population Mobility and FGT Class of Index 178
Appendix 6.3: Proof of the Properties of SCV 180
Appendix 6.4: Link between the Model and the Measurement of
Income Distribution 183
Chapter 7. Impact of a Move Towards Free Trade 184
7.1. Introduction 184
7.2. Closure of the Model 187
7.2.1. Macro-economic Closure 187
7.2.2. Factor Markets 188
7.2.3. Foreign Trade 190
7.2.4. Policy Variables 190
7.3. Trade Liberalisation and Direct Taxation 191
7.3.1. Macro Impact 194
7.3.2. Production Impact 196
7.3.3. Factor Market Impact 200
7.3.4. Income Distribution Impact 201
7.3.5. Consumption Impact 205
7.4. Trade Liberalisation and Redistribution Impact 207
7.4.1. Indirect Taxation and Distortionary Effect 208
7.4.2. External Financing and Dutch Disease 212
7.5. Sensitivity Analysis 216
7.6. Conclusion 219
Chapter 8. Summary, Conclusions, and Suggestions 221
8.1. Summary 221
Page
8.3. Suggestions 228
8.3.1. Policy Implementation 228
8.3.2. Future Research 230
FIGURES
Page
Figure 2.1: Agricultural Terms of Trade 31
Figure 5.1: Linear Expenditure System (LES) 119
Figure 6.1: Density of Log of per Capita Urban Household
v
Expenditure 149
Figure 6.2: Density of Log of per Capita Rural Household
Expenditure 150
Figure 6.3: Cumulative Density of Log of per Capita Urban
Household Expenditure 150
Figure 6.4: Cumulative Density of Log of per Capita Rural
TABLES
Page
Table 2.1: Structure of Gross Domestic Product and the
Composition of Manufacturing at Current Prices,
by Industry: 1960-90 12
Table 2.2: Import, by Economic Classification: 1960-90 13
Table 2.3: Export, by End Use: 1960-90 14
Table 2.4: Net Capital Stock at 1972 Prices, by Industry: 1970,
1980,1985, and 1989 15
Table 2.5: Labour Force, by Industry: 1960,1970,1980, and 1990 16
Table 2.6: Regression Analysis of a Relationship between the Level
of Protection and Labour Intensity: 1987 18
Table 2.7: Realized Nominal Rate of Protection for
Manufacturing Industries: 1964,1971, and 1974 21
Table 2.8: Effective Rate of Protection for Manufacturing
Industries: 1964,1971, and 1974 22
Table 2.9: Realized Nominal Rate of Protection for Some
Industries: 1964,1971, and 1974 23
Table 2.10: Nominal Rate of Protection: 1981,1984, and 1987 24
Table 2.11: Effective Rate of Protection: 1981,1984, and 1987 24
Table 2.12: Nominal Rate of Protection for Some Industries:
1981,1984, and 1987 25
Table 2.13: International Comparison of Nominal Rate of Protection 26
Table 2.14: International Comparison of Effective Rate of Protection 27
Table 2.15: Output-Labour Ratio, by Industry: 1960,1970,1980,
Page
Table 2.16: Gross Regional Product at Current Prices, by Industry
and Region: I960,1973, and 1988 32
Table 3.1: Percentage Distribution of National Income at Current
Prices: 1970,1980, and 1989 36
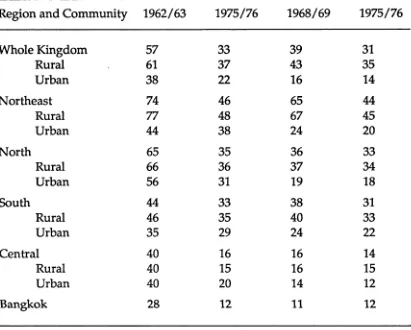
Table 3.2: Poverty Incidence, by Region and Community: 1962/63,
1968/69, and 1975/76 38
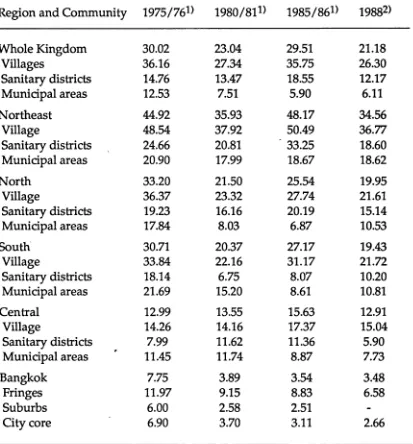
Table 3.3: Poverty Incidence, by Region and Community: 1975/76,
1980/81,1985/86, and 1988 39
Table 3.4: Rank of Poverty and Size of Rural Sector, by Region:
1988 41
Table 3.5: Economic Growth, by Industry: 1962/63,
1968/69,1972/73,1975/76,1980/81,1985/86, and 1988 42
Table 3.6: Land Ownership, Percentage of Paddy Farmers, and
Average Yield per Rai of Paddy, by Region 43
Table 3.7: Income Inequality: 1963,1969, and 1972 44
Table 3.8: Income Inequality: 1975/76,1980/81,1985/86, and 1988 45
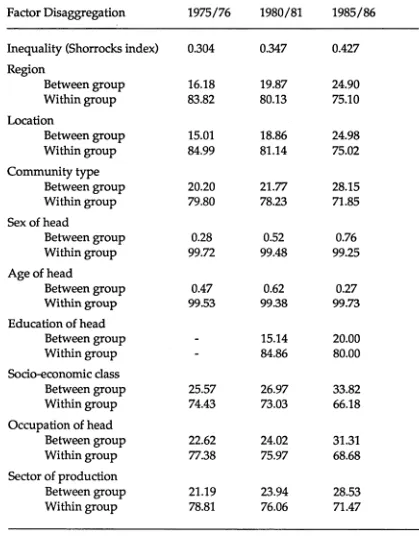
Table 3.9: Factor Disaggregation of Income Inequality:
1975/76,1980/81, and 1985/86 47
Table 4.1: General Structure of the 1988 Social Accounting Matrix 75
Table 4.2: Nominal Rate of Protection (NRP) and Cost Share of
Imported Inputs, by Producer Good 77
Table 4.3: Tax Drawbacks, Rebates, and Total Export: 1985-89 77
Table 4.4: Elasticities of Substitution between Labour and Among
Primary Factors 80
Table 4.5: Armington Elasticity of Substitution and Reciprocal of
Price Elasticity of World Demand for Thai Export 82
Table 4.6: Own Price Elasticities of Supply of Major Crops 85
Table 4.7: Own Price Elasticity of Supply, Share of Agricultural
Product, and Imputed Transformation Parameter 87
Table 4.8: Gross Regional Agricultural Product at 1972 Prices:
1988 88
Page
Table 4.10: Labour Share, by Industry: 1988 89
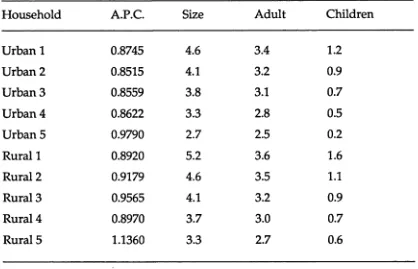
Table 5.1: Urban and Rural Household Characteristics: 1988 111 Table 5.2: Weighted Average of Some Factors, by Household: 1988 112
Table 5.3: Regional Consumer Price Index: 1970 and 1988 113 Table 5.4: Selected Elasticities from Other Studies 115 Table 5.5: Comparison between LES and ELES by Single Equation
Estimation 118
Table 5.6: Average Monthly per Capita Expenditure (PiQi or Ej), by
Commodity and Household 120
Table 5.7: Monthly Committed Per Capita Expenditure (P ^ ), by
Commodity and Household 122
Table 5.8: Marginal Budget Share (ßj), by Commodity and Household 124 Table 5.9: International Comparison of Equivalent Scale 130 Table 5.10: Expenditure (Ej), Own Price (e ^ ), and Cross Price (ej ^
Elasticities of Rice and Cereals, by Household 133 Table 5.11: Expenditure (e2), Own Price (e2 2), anc* Cross Price (e2 j)
Elasticities of Meat and Fish, by Household 134 Table 5.12: Expenditure (e3), Own Price (£3,3), and Cross Price (e3j)
Elasticities of Fruit and Vegetables, by Household 135 Table 5.13: Expenditure (e4), Own Price (e4/4), and Cross Price (e4 j)
Elasticities of Other Foods, by Household 136 Table 5.14: Expenditure (e5), Own Price (£55), and Cross Price (e5 j)
Elasticities of Non-alcoholic Beverages, by Household 137 Table 5.15: Expenditure (s6), Own Price (e66), and Cross Price (e6 j)
Elasticities of Clothing and Footwear, by Household 138 Table 5.16: Expenditure (e7), Own Price (e77), and Cross Price (e7 j)
Elasticities of House and Housing Expenditure, by Household 139 Table 5.17: Expenditure (£8), Own Price (e8 8), and Cross Price (e8 j)
Elasticities of Transport and Communication, by Household 140 Table 5.18: Expenditure (e9), Own Price (£9 9), and Cross Price (£9^)
Elasticities of Medical Expenses, Education and
Page Table 5.19: Expenditure (e10), Own Price (eio.io^ anc* Cross Price
(eio j) Elasticities of Other Non-foods, by Household 142 Table 6.1: Household Characteristics, by Community and Region:
1988 146
Table 6.2: Population, Income, and Expenditure Shares, by
Community and Region: 1988 148
Table 6.3: Composition of Thailand Poverty Line: 1988 154 Table 6.4: Poverty Incidence, by Community and Region: 1988 161 Table 6.5: Decomposition of Poverty Incidence, by Community
and Region: 1988 161
Table 6.6: Inequality and Decomposition of Inequality, by
Community and Region: 1988 169
Table 6.7: Poverty Incidence and Inequality, by Household:
1988 170
Table 6.8: Population and Expenditure Shares, by Household:
1988 171
Table 6.9: Decomposition of Inequality, by Household: 1988 172 Table 6.10: Decomposition of Poverty Incidence, by Household:
1988 173
Table 6.11: Population Share, by Household and Region: 1988 174 Table 6.12: Expenditure Share, by Household and Region: 1988 175 Table 7.1: Nominal Rate of Protection (NRP), by Producer Good:
1987 185
Table 7.2: Primary Factor and Intermediate Input Shares, by
Producer Good 191
Table 7.3: Primary Factor Cost Share, by Producer Good 192 Table 7.4: Cost Share of Domestic and Imported Inputs, by
Consumer Good 192
Table 7.5: Base Year Direct Tax Rate, by Household 193 Table 7.6: Macro Impact of the Move Towards Free Trade and
Page
Table 7.7: Impact of the Move Towards Free Trade and Direct
Taxation on Output Supply and Employment, by Industry 197
Table 7.8: Impact of the Move Towards Free Trade and Direct
Taxation on Trade, by Producer Good 198
Table 7.9: Impact of the Move Towards Free Trade and Direct
Taxation on Domestic Supply and Basic Price, by
Industry and Producer Good 199
Table 7.10: Impact of the Move Towards Free Trade and Direct
Taxation on Return to Primary Factor, by Industry 201
Table 7.11: Factor Ownership Matrix 202
Table 7.12: Income Distribution Impact of the Move Towards Free
Trade and Direct Taxation, by Community and Region 204
Table 7.13: Impact of the Move Towards Free Trade and Direct
Taxation on Income and Consumption, by Household 206
Table 7.14: Impact of the Move Towards Free Trade and Direct
Taxation on Consumer Goods 207
Table 7.15: Indirect Tax Rate, by Producer Good 208
Table 7.16: Comparison between Direct and Indirect Taxations 210
Table 7.17: Comparison between Direct Taxation and External
Financing 213
Table 7.18: Comparison between Market Power and Small Country
Baht
ERP
ESAN
FGT2
HCR
LES
NESDB
NRP
NSO
OAE
SCV
SES
GLOSSARY
Not Available.
Thai Currency, about 25.50 Bahts/US$.
Effective Rate of Protection.
Esan, the Northeast.
Foster, Greer, and Thorbecke Index of Order 2.
Head-Count Ratio.
Linear Expenditure System.
Office of the National Economic and Social Development
Board.
Nominal Rate of Protection.
National Statistical Office.
Office of Agricultural Economics.
Square of Coefficient of Variation
CHAPTER 1
-INTRODUCTION
Higher productivity and economic growth are not the only objectives of
industrialisation. Industrialisation is a means of achieving at least four more
basic objectives (United Nations, 1974, quoted in Meier, 1976). First, it is
viewed primarily as a means of improving working conditions and living
standards for the poor. Second, it has to be closely involved with the
development of all other sectors in the economy. Third, the income generated
by economic growth has to be distributed sufficiently widely to promote
perceptible improvements in general living standards. Fourth, it should also
promote a greater sense of confidence and self reliance of the country.
The arguments for protection in industrial development are well
known. Temporary protection may assist a young industry to compete with
foreign industry and develop its latent strength. It also allows the transfer of
resources from agriculture to the manufacturing industry required for
industrialisation. In addition, industrial protection turns terms of trade
against agriculture. It, therefore, maintains low manufacturing wage rates by
providing cheap food for the manufacturing workers.
On the other hand, protection allows domestic industry to produce at
a higher cost and be inefficient. Because prices are distorted by protection,
resources are redirected away from more productive uses. Subsidy or special
priviledge for export also affects firms' decisions to sell in domestic or world
agriculture, the development of agricultural technology and productivity are
hampered. As a result, differences in the productivity of the two sectors do
not converge and spatial income distribution is not improved.
The problem of income distribution can be viewed in both absolute
and relative terms. In relative terms, income inequality is primarily
concerned with the income position of individuals or households in relation
to each other. Changes in income inequality indicate how the benefits of
economic growth are distributed among individuals and households.
Changes in inequality are socially subjective, however, and are tolerable as
long as the process of change involves Pareto improvement - absolute gains
for all - and does not preclude future and more desirable distributional
changes (Adelman and Robinson, 1989). Poverty incidence is primarily
concerned with the minimum level of income needed to maintain a given
standard of living. Increases in poverty incidence incur hardship. When
income becomes so low that people cannot survive or maintain normal
activity, their poverty indirectly creates problems for those who are not poor,
and becomes a cost to the whole community.
1.1. Background of the Problem
The last three decades have witnessed impressive economic growth in the
Thai economy. Industrial development, an outward looking strategy, and the
world economic environment are behind the success. However, despite the
high growth record, Thailand has failed to distribute the benefits of economic
growth equitably. Income inequality has been worsening since
industrialisation began, while poverty incidence has improved. There has
been increasing concern with the problem of income distribution. In the
seventh development plan (1992-1996), the Thai government has given
priority to the problem, by focusing on the reduction of poverty and an
increase in income of the targetted groups, particularly poor farmers and
farm workers.
Beginning with a relatively small and basic industrial sector, Thailand
export promotion regime. The advantages and disadvantages of the two
regimes have been well discussed in the literature. In sum, import
substitution is expected to supply domestic demand, especially for consumer
goods, initially to foster industrialisation and improve the balance of
payments. Provided that it is not over subsidized, export promotion has
three main supports. First, the domestic resource cost of earning one unit of
foreign currency by export promotion is said to be less than the domestic
resource cost of saving one unit of foreign currency by import substitution.
Second, the process of industrialisation through export promotion rests on
exogenous world demand, and is not limited by a narrow domestic market,
as is import substitution. Third, it is likely to have more linkages to
agriculture and can upgrade the skill of labour. Because export industries are
relatively labour intensive, it is also expected to utilize the country's labour
surplus, increase employment, and improve the distribution of income.
Many empirical studies have attempted to establish a relationship
between income distribution and a change in policy from an import
substitution strategy to an export promotion strategy, especially through
employment and the functional distribution of income. Narongchai (1975)
asserts that import protection policies in Thailand induced capital intensive
investment and have not created sufficient non-agricultural employment.
Narongchai (1977) also supports the move towards export promotion
strategy by showing that it would increase employment in every sector. Kim
and Vorasopontaviporn (1989) show that, if national income increases
exogenously, not only the export sector but also the non-traded sector in
Thailand can create more employment than the import competing sector.
However, Phomphen (1987) and Wattananukit and Bhongmakapat (1989 in
Teerana, 1990), both based on a computable general equilibrium model, point
to the unfavourable income distribution impact of export expansion.
Phomphen points out that a (negative) shock of world demand for Thai
export leads to a reduction in income of farmers and casual labourers. Thus,
income inequality is worsened. Wattananukit and Bhongmakapat, in
assessing the impact of export expansion on income distribution, found that
linkages, requires less imported machinery and raw materials, and benefits
the lower income classes, especially farmers. Whereas, manufacturing export
only benefits non-agricultural households.
The relationship between industrial protection and income
distribution has been of considerable interest to economists. Generally, the
literature focuses on the functional distribution of income, i.e., returns to
labour and capital. In the neoclassical world of two countries, two mobile
factors, and two sectors, the Stolper-Samuelson theorem states that an
increase in the relative price of a commodity will increase the return to factor
used intensively in the production of that commodity in relation to both
commodity prices and will reduce the return to the other factor. Thus,
protection will benefit the factor used intensively in the protected sector.
However, Magee (1978) shows that the theory is not supported by empirical
evidence, since all factors of production in protected industries support
protection. The so-called Ricardo-Viner-Jones specific factors model focuses
on a short run impact, in which a factor is specific to sectors of production.
The model states that the income distribution impact of protection depends
on the consumption basket of consumers.
The implications of these two sector models are limited by the
simplicity of their assumptions since the reality is more complicated. Other
studies attempt a multi-sectoral model (e.g., Jones, 1975). But, most of them
focus on partial equilibrium analyses, that fall short of capturing the
behaviour of economic agents in the general equilibrium framework, and
lack emphasis on the impact of protection on the size distribution of income.
Empirical studies on the effect of trade liberalisation show that many
developing countries experience average annual positive growth rates in the
post-liberalisation era (Michaely et al., 1991). As also pointed out by the same
study, there is no evidence that lower income groups benefit from
liberalisation nor there is any confirmation that liberalisation leads to a
In the case of Thailand, the impact of industrial protection on poverty
incidence and income inequality has not been satisfactorily investigated. No
previous studies have examined the impact of the system of protection on the
size distribution of income, which is very important in policy decisions, both
in terms of economic growth and welfare.
Available studies on industrial protection and income distribution in
Thailand are limited and fall into two categories. Firstly, Corden (1967),
Chalongphob, Pranee, and Tienchai (1988), and Overbosch et al. (1988) are
studies in which the overall income distribution impact of protection is seen
to be ambiguous. Corden points to the progressive effects of import duties,
since imports are consumed mainly by the better-off sections of the
community. He also points to the regressive effects of an export tax on rice,
since it is a transfer of income from rice producers, especially poor rice
growers in the Northeast, (possibly) traders, and millers to the government.
Chalongphob, Pranee, and Tienchai, based on a CGE model, found that the
impact of replacing import taxes with a proportional tax on household
income, to generate exactly the same total tax revenue, was unclear. Their
results depended on the closure of the model. With fixed investment,
inequality of real household income worsens. With a fixed current account,
inequality improves. Overbosch et al., based on THAM-2 CGE model, found
that the income distribution impact of government intervention in
agriculture is inconclusive. On the other hand, Fabers and Kennes (1982,
quoted in O’mara and Le-si, 1985), based on a multi-sectoral macro-economic
model, point to the resource allocation effect of a reduction in import tariffs,
since the share of agriculture in GDP significantly increases. Therefore, their
results indicate that the income distribution impact of a reduction in import
tariffs is favourable.
The impact of industrialisation and trade policy in Thailand has not
yet been fully investigated and clarified. In particular, the impact of
industrial protection on poverty and income inequality has not been
1.2. General Equilibrium and Income Distribution
Because of the interrelationship of all sectors of the economy, especially
between agriculture and manufacturing, the problem of industrial protection
and income distribution requires a general equilibrium analysis. The
theoretical structure of a computable general equilibrium (CGE) model is
well known. Based on the traditional Walrasian equilibrium, a CGE model
consists of a system of equations which explain the behaviour of various
economic agents in the economy. General equilibrium is similar to partial
equilibrium, in that it assumes all producers to be profit maximisers;
consumers to be utility maximisers; and production factors paid according to
their marginal revenue products. It differs from a partial equilibrium model
in that, whereas in a partial equilibrium model all prices other than the price
of a good under consideration are assumed to remain constant, in a general
equilibrium model all prices are variables, and quantity adjusts accordingly.
By making profit and utility maximisation feasible and consistent, the
solution set provided by the CGE model clears all factor and goods markets
simultaneously.
With the relatively large size and complicated nature of the CGE
model, four different approaches have been developed in order to solve for
the solution (Robinson, 1989). The approach used in this thesis, the linearized
Johansen type CGE model, which was introduced by Johansen in 1960,
involves the linearization of all equations in the model and then solving them
by a matrix inversion. Although this approach has been used in many
applications in many countries, its application to income distribution has not
been fully explored.
Generally, income distribution in CGE is measured by the functional
distribution of income - distributive shares among factors of production - and
the socio-economic or class distribution of income. The functional
distribution of income is partly explained by the distribution rigidity of
production functions employed by the model. Typical is the well-known
Cobb-Douglas production function, which implies constant factor shares in
transformation (CET), and the constant ratios of elasticities of transformation
and homothetic (CRETH) production functions imply that factor shares are
functions of the return to those factors. Based on the functional distribution
and a factor ownership matrix, the class distribution can be determined. The
factor ownership matrix explains how each class derives its income from
various factors of production. The distribution of income within each class
explains how equal income is distributed among members of the class.
All other elasticities also affect income distribution in the model,
particularly various elasticities of consumer demand. Based on the
disaggregation of consumers, the elasticities of demand allows consumers to
have different responses to a policy shock through changes in income and
prices. It can also illustrate how a policy shock affects the welfare of
consumers differently. This thesis estimates these important parameters.
CGE modellers can measure the distribution impact of a policy shock
in several ways. Generally, the focuses are on the functional distribution of
income and economic welfare by means of the compensating variation and
the equivalent variation. Some modellers use the changes in utility indices of
consumer groups to show the distribution impact of policy being simulated
(Sierra-Puche, 1984). Some modellers transform the class distribution of
income into the size distribution of income by using a parametric probability
density function such as lognormal and uniform distributions (Adelman and
Robinson, 1978, de Melo and Robinson, 1980, and Narayana et al., 1987).
Following the estimation of a parametric probability density function, the
impact of policy shocks on poverty and inequality can be measured.
The use of a parametric density function has some theoretical
weaknesses, especially the fitness of the function to data. Another alternative,
a non-parametric density function, has many strengths which will be
discussed in Chapter Six. Most importantly, it can be used in a general
equilibrium model and, particularly in a linearised model. With an
appropriate understanding of the measurement of poverty and income
inequality, it can also be used to explore and detail the impact of shock on
income distribution in a general equlibrium framework at disaggregated
1.3. Organisation of the Thesis
The thesis attempts to answer the question: What would be the income
distribution impact of a move from the 1987 system of industrial protection
towards free trade? The answer to this question will contribute to empirical
knowledge in the area of protection and income distribution in Thailand.
The thesis is organized into four main parts - background (Chapters
Two and Three), modelling and parameter estimation (Chapters Four, Five,
and Six), simulation results (Chapter Seven), and main conclusion (Chapter
Eight).
Chapter Two presents the historical background of industrialisation in
Thailand, including economic growth and structural change, and industrial
protection policies during the 1960s, 1970s, and 1980s. The chapter also
reviews the literature on the estimates of nominal and effective rates of
protection during the period. Based on the allocation of resources, changes in
productivity, and industrial location, the chapter points to a relationship
between protection, and the functional and regional distribution of income.
Chapter Three examines changes in poverty incidence and income
inequality during the three decades. Although the chapter presents the long
run trend of poverty incidence and income inequality, the main focus is the
mechanism behind these changes.
To answer the central question of the thesis, Chapter Four constructs a
general equilibrium model for the Thai economy within a consistent
framework of a Social Accounting Matrix (SAM). The model, in the tradition
of the linearized Johansen class of multi-sectoral models, is designed to
reflect the main features of the Thai economy. The chapter constructs a 1988
SAM, which provides some important information on the circular flow of the
Thai economy, production technologies, and income distribution such as a
factor ownership matrix. The chapter also discusses the rationale behind the
parameterization of the CGE model.
Chapter Five deals with the theory and an estimation of consumer
that all households face the same price. In the model, the estimates explain
how ten types of households adjust their demand for ten consumer goods,
when prices and their total consumption expenditure are changed by a policy
shock.
The methodological contribution of the thesis is in Chapter Six. The
chapter offers methodologies to estimate the size distribution of income, and
to incorporate income distribution into a general equilibrium framework.
The methodologies enhance the analysis of poverty incidence and income
inequality both at the national and disaggregated level. The chapter also
estimates parameters used in the modelling of income distribution in the
general equilibrium model.
Chapter Seven presents and analyses the impact of a move towards
free trade. The move towards free trade leads to a government budget deficit.
The analysis in the chapter is designed to capture the differences in the
impact of the way the government chooses to finance the deficit. The impact
on income distribution, the primary concern of this thesis, is examined at
regional and community levels. The chapter also analyses the sensitivity of
the results when the CGE model departs from some critical assumptions.
Chapter Eight summarizes the thesis. The chapter also presents the
main findings, and makes suggestions for policy implementation and future
CHAPTER 2
-INDUSTRIALISATION AND PROTECTION
DURING THE 1960s, 1970s, and 1980s
2.1. Introduction
Economic growth in Thailand has been marked by the growing dominance of
the manufacturing sectors. Expansion of manufacturing in the 1960s was
dominated by protected industries, which were geared toward the domestic
markets for consumer goods. At the beginning of the 1970s, when domestic
markets were saturated, the country moved toward an export oriented
strategy. Manufactured exports have gradually taken the place of the export
of primary products. The economic importance of agriculture has been
declining, not only in GDP share, but also in its share of Thailand's
international trade.
Industrial protection has played an important role in the performance
of Thai manufacturing, raising the domestic price of manufactured products
above world prices and attracting resources from agriculture and other
sectors. Thus, the growth of agriculture, the biggest pool of employment, has
been restrained. With accelerating and sustained economic growth, demand
for food commodities shows a declining trend in relation to demand for non
food commodities.
Estimates of the level of industrial protection during the past three
decades are reported by many studies. These studies focus on the estimation
rate of protection (ERP), by which the resource allocation impact of
protection could be analysed. However, none of the studies discuss directly
the impact of industrial protection on income distribution, which is very
relevant in terms of policy decisions. Although it is well understood that the
present situation of poverty incidence and income inequality cannot be solely
explained by industrial protection policies, the pattern of industrial
protection may have some dimensions which could shed some light on the
impact of protection policies on income distribution in Thailand.
This chapter seeks to examine these dimensions. The first section
provides a broad picture of the Thai economy. The second presents
industrialisation and the systems of industrial protection during the 1960s,
1970s, and 1980s. The third section examines productivity differences, and
the regional dimension of industrialisation and industrial protection, which
might have some distributional impact. The final section summarizes the
chapter.
2.2. Economic Growth and Structural Change
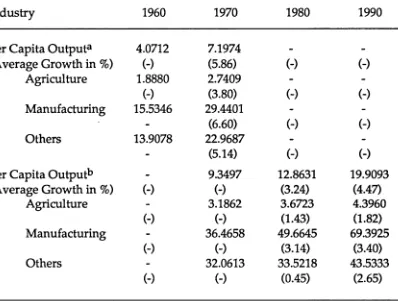
The Thai economy has grown rapidly during the past three decades. The
annual average growth rate was approximately 8% in the 1960s, and declined
to 7% in the 1970s. During the first half of the 1980s, the growth rate fell to
5.7%, but rose dramatically to nearly 10% in the second half. With an annual
population growth rate of about 2%, the growth of per capita GNP reached
8% in that period.
During the past three decades of modern industrialisation, the
manufacturing sector has increasingly become a dominating sector. The
structure of the Thai economy has been changing from an agricultural to a
manufacturing base. The growth rate of the manufacturing labour force was
extremely high, although the absolute level was not enough to shift the
structure of employment. The majority of labour was still in agriculture. The
share in GDP of the agricultural sector sharply declined from nearly 40% in
1960 to 16.7% in 1985, and 12.4% in 1990. The shares of two major crops,
m uch faster than other agricultural products. These reductions accompanied a more than 100% expansion of the m anufacturing sector from 12.5% to 26.1% of GDP. The share of other sectors gradually increased from about 48% to more than 60% in the same period.
TABLE 2.1: Structure of Gross Domestic Product and the Composition of Manufacturing at Current Prices, by Industry: 1960-1990
Industry 1960 1970 1980 1985 1990
GDP (billion Baht) 54 147 659 1014 2051
Total Share (%) 100 100 100 100 100
Agriculture 39.8 25.9 23.2 16.7 12.4
M anufacture 12.5 15.9 21.3 22.1 26.1
Others 47.7 58.2 55.5 61.2 61.5
M anufacturing (%) 100 100 100 100 100
Food & beverages 42.8 31.9 20.1 24.8 18.7
Tobacco & snuff 14.5 7.4 5.3 5.1 3.0
W earing apparel & leather 8.4 11.3 12.1 16.1 18.9
Textiles 4.7 7.5 12.2 9.9 10.5
Petroleum refining .04 5.7 8.2 6.8 4.5
Non-metallic minerals 4.0 4.3 3.7 4.7 4.6
Electrical machinery 0.6 1.9 2.4 2.6 3.4
Transport equipm ent 4.9 5.2 8.2 4.9 9.4
Others 20.1 24.8 27.8 25.1 27.0
Note: There are two series of the National Income of Thailand - old and new series. Differences between the two series are definition, method of calculation, and the base years. Data at constant prices in the old series are based on 1962 prices while those in the new series are based on 1972 prices. In this table, 1960 data are from the old series. The ten year average annual growth rate in 1970 is also based on the old series. The remaings are based on the new series.
Source: National Income of Thailand (various issues), NESDB.
m anufacturing products, which decreased from more than 57% in 1960, to about 22% in 1990, while the total share of wearing apparel, leather, and textiles increased from 13% to 29%. The share of other protected industries, such as electrical m achinery and transport equipm ent also increased.
TABLE 2.2: Import, by Economic Classification: 1960-90
Types 1960 1970 1980 1985 1990
Im port value (billion Baht) 10 27 189 251 842
Average Growth (%) - 11.0 22.4 6.4 28.9
Total Share (%) 100 100 100 100 100
Consum er goods 35.0 19.4 10.2 9.5 9.0
N on-durable 26.6 12.9 6.5 5.1 3.8
Durable 8.4 6.5 3.7 4.4 5.2
Intermediate and raw materials 18.1 24.9 24.0 30.2 33.3
for C onsum er goods 10.7 15.3 14.9 20.4 22.2
for Capital goods 7.4 9.6 9.1 9.8 11.1
Capital goods 24.6 34.7 24.4 30.0 38.8
Other imports 22.3 21.0 41.4 30.3 18.9
Note: 1990 data are predicted figures.
Source: Quarterly Bulletin (various issues), Bank of Thailand.
TABLE 2.3: Export, by End Use: 1960-90
Types 1960 1970 1980 1985 1990
Export Value (billion Baht) 9 15 133 193 587
Average Growth (%) - 5.9 25.8 8.2 25.1
Total Share (%) 100 100 100 100 100
Food 45.4 47.1 44.6 44.8 28.2
Beverages and tobacco 0.3 1.4 1.0 0.9 0.4
C rude materials 50.0 28.9 14.3 10.1 5.5
Mineral fuel and Lubrication 0.0 0.3 0.1 1.3 0.8
Animal & vegetable oils & fat 0.0 0.1 0.2 0.3 0.0
Chemicals 0.1 0.2 0.7 1.3 1.4
M anufactured goods 1.1 14.8 22.1 18.5 18.4
Machinery 0.0 0.1 5.7 8.8 22.3
Miscellaneous m anufactured 0.2 0.4 6.4 12.4 21.5
Miscellaneous 0.7 3.2 2.8 0.7 1.2
Re-export 2.2 3.5 2.1 0.9 0.3
N ote: 1990 data are predicted figures.
Source: Quarterly Bulletin (various issues), Bank of Thailand.
2.3. Industrialisation and Protection
The crucial role of Thailand's industrial protection policies in the expansion of m anufacture has been accepted in the literature. Conventional explanation of the impact of protection is that protection raises domestic prices above w orld prices, bids u p the return to mobile factors of production, and redirects resources from the unprotected sectors to the highly protected sector. Consequently, protected sectors, e.g., m anufacturing or highly processed industries, expand at the expense of non-protected sectors, e.g., agriculture or simple processed industries. Other sectors, such as the non- traded sectors, are also affected but to a lesser degree.
while those of manufacturing and other sectors are quite steady (Table 2.4).
Direk (1990), by showing that the lowest return to capital is in agriculture
and the highest return to capital is in manufacturing, points to the same
conclusion. The manufacturing labour force also expanded at a much faster
rate than agricultural labour (Table 2.5). The average annual growth of the
agricultural labour force, at around 2-3%, can be considered a result of
natural growth rather than resource allocation. The average annual growth
rate of the labour force in manufacturing and other sectors was more than
double that of agricultural labour. However, the share of agricultural labour
in the total labour force, which was about 82% in 1960, was still more than
65% in 1990.
TABLE 2.4: Net Capital Stock at 1972 Prices, by Sector: 1970,1980,1985, and
1989. (Million Baht)
Industry 1970 1980 1985 1989
Total 299854 696556 990197 1287499
(Share in %) (100.00) (100.00) (100.00) (100.00)
Agriculture 25694 47484 61698 68807
(8.57) (6.82) (6.23) (5.34)
Manufacturing 70674 189948 266189 356721
(23.57) (27.27) (26.88) (27.71)
Others 203486 459125 662310 861971
(67.86) (65.91) (66.89) (66.95)
Average Growth Rate (%) - 8.79 7.29 6.78
Agriculture - 6.33 5.38 2.76
Manufacturing - 10.39 6.98 7.59
Others 8.48 7.60 6.81
Source: Unpublished Data, National Economic and Social Development Board.
2.3.1. Development of Industrial Protection
Modern industrialisation in Thailand did not start until around the late 1950s
and the beginning of the 1960s. Since 1958, the policy of the government has
infrastructure. In its first development plan (1961-66), the Thai government
encouraged industrial expansion in the private sector, mainly by granting
privilege and protection to import competing industries. After years of
import substitution, Thailand moved to limit import substitution with a
gradual change to export promotion. The aims of the second plan (1967-71),
emphasized both agricultural and manufacturing export. The plan also
focussed on the quality of export products. However, export was not actively
promoted during this plan.
TABLE 2.5: Labour Force, b y Industry: 1960,1970,1980, and 1990
Industry 1960 1970 1980 1990
Labour Force (Thousand) 13772.1 16652.3 23281.4 31724.3
(Share in %) (100.0) (100.0) (100.0) (100.0)
Agriculture 11334.4 13201.9 16820.6 20635.1 (82.30) (79.28) (72.25) (65.04)
Manufacturing 471.2 682.6 1308.5 2248.7
(3.42) (4.10) (5.62) (7.09)
Others 1966.5 2767.7 5152.4 8840.5
(14.28) (16.62) (22.13) (27.87)
Average Growth Rate (%) - 1.92 3.41 3.14
Agriculture - 1.54 2.45 2.06
Manufacturing - 3.78 6.72 5.56
Others ” 3.48 6.41 5.55
N ote: In 1960, 1970, and 1980, labour force is defined as employed population aged 11 years and over. In 1990, it is defined as employed population aged 13 years and over, which is on average about 4-5% lower than the former definition.
Source: Report of the Population and Housing Census (various issues), National Statistical Office.
Since the third development plan (1972-1976), the government has
attempted to promote export industries. The aims of the third plan were to
promote the export of agricultural and manufacturing products, using locally
available raw materials. The two following plans still focused on the export
sector, but with more emphasis on marketing, industrial decentralization,
granted to promoted firms located in provincial areas. The aim was to
decentralize industrial location away from Bangkok and surrounding
provinces. More export industries were added to the list of promoted
industries. Protection for export industries increased. However, import
competing industries were still heavily protected.
The motives behind industrial protection policies in Thailand are
difficult to verify. Generally, there were four objectives for protection.
The initial objective was to raise revenue (Ingram, 1971). Trade tax is
an important source of government revenue. Between 1972 and 1981, trade
tax contributed about 25%-31% of government revenue. Of this, nearly 90%
was revenue from import tax (Tables 3.7-3.8, Narongchai and Juanjai, 1986).
In the 1980s, it was still an important source of government revenue.
Protection has been regarded as an appropriate means to stimulate
industrialisation. The so-called infant industry argument asserts that
temporary protection may be required for a young industry to be able to
compete with foreign industry and to develop its latent strength. However,
many industries that were receiving high protection in the 1960s and the
1970s were still heavily protected in the 1980s. Nishimizu and Page, Jr.
(1986), studied the comparative advantage of 22 industries, and concluded
that infant industry arguments for protection in Thailand, based on
improvement in total factor productivity and international competitiveness,
are only supported empirically in a minority of protected industries.
The infant industry argument is often accompanied by the
employment argument. In the case of Thailand, the relationship between
labour intensity and the level of protection rejects this argument. Table 2.6
presents OLS estimates of the relationship between the level of protection
and labour intensity in the protected sectors. The level of protection is based
on the 1987 system of protection estimated by Paitoon et al. (1989). Due to the
availability of data, the sectoral labour intensity, the ratio between the wage
bill (wL) and the total non-wage bill (rK), is based on the 1985 input-output
table. Empirical evidence shows that there is a negative relationship between
labour intensity and the level of protection (NRP or ERP). Although the
that of ERP is insignificant. Most importantly, they indicate that protection
tends to be lower for labour intensive industries.
TABLE 2.6: Regression Analysis of a Relationship between the Level of Protection and Labour Intensity: 1987.
Variables Coefficient t-statistics
Dependent Variable: ERP
Constant 0.3848 3.6790
wL/rK -0.0575 -1.6104
Dependent Variable: NRP
Constant 0.2163 7.6220
wL/rK -0.0255 -2.6303
N ote: Based on models: ERP = constant+ß(wL/rK), and NRP = constant+ß(wL/rK). Sources: 1) Input-output Table of Thailand 1985, NESDB.
2) Tables 3.13-3.14, Paitoon et al. (1989).
In an attempt to relieve difficulties of trade deficit, a high tariff was
placed on consumer goods considered to be luxurious. Since foreign
exchange savings, due to the substitution of imported goods by locally
produced goods, was more than foreign exchange dissavings, induced by the
import of raw materials and intermediates used in domestic production;
Chaiyut (1978) points to the success of import substitution policies between
1958 and 1971. Nevertheless, except in 1961, the import substitution regime
in the 1960s was still characterised by a balance of trade deficit. The same
pattern continued in the 1970s and 1980s. This can be explained by a study by
Jansen (1990) who points out that that the majority of manufactured exports
are the products of industries depending on imported inputs.
2.3.2. Protective Measures
The system of industrial protection in Thailand is attributed to many
measures. These are tariffs, import and export licenses, business taxes, and
Narongchai, 1973 and Pairote, 1975). In brief, tariffs are the most extensively
used measures.
Ingram (1971) points out that in 1926, when tariffs steadily increased,
their protective effects began to be felt. However, most rates were modest.
From the 1950s onward, protection for domestic industry became a more
important objective of tariff policy.
Following the 1960 major revision of Customs Duty Acts and the
Announcements of Revolutionary Parties, issued between 1935-1959, non
durable consumer goods and transportation equipment were subjected to
high rates, while duties on imports of intermediate products and durable
consumer goods were generally lower. During the first half of the 1960s,
except for metal scrap, raw silk, and silk yam, most exports were subjected to
low rates of duty of around 10% or less.
Since the 1960s, there have been many important customs duty
revisions which reflect changes in government policy. Customs duty
revisions in the early 1970s supported domestic industry by controlling
export of domestic inputs and providing cheaper imported inputs. The 1970
revisions aimed at solving a severe current account deficit, by the means of
limiting imports of consumer goods and supporting import competing
industries. Export industries, especially those using agricultural raw
materials, were also promoted through the exemption of import duties on
raw materials. A 1982 revision was more export oriented, when import
duties on a wide range of consumer goods were reduced substantially.
The protective effects of other measures are also notable. Import
licensing is used as a measure to safeguard domestic industries producing
consumer goods and intermediate products. Export licensing is used in
compliance with international trade agreements on some products such as
sugar, coffee, and textiles. The protective effects of business tax began in
1973, when different rates of business tax were placed on imported and
locally produced goods. On average, most imported goods are subjected to
higher tax rates than those which are domestically produced. In 1986,
business tax rates on locally produced food, or food products, and various
labour intensive industries. The municipal tax rate, 10% of business tax,
enlarges the protective effect of the business tax. Some products are subjected
to excise tax. The excise tax protects domestic producers of alcoholic
beverages and tobacco since higher rates were placed on imported products.
Cement, petroleum products, lighters, and matches were subjected to the tax
only if they were domestically produced. However, the tax on cement
exports was refundable.
2.3.3. Degree of Protection
Various measures can be used to measure the degree of protection during
these periods. The two most often used measures are the nominal rate of
protection (NRP) and the effective rate of protection (ERP). NRP measures
the extent to which domestic prices have been raised above or pressed under
world prices by tariffs and other trade restrictions. ERP takes into account the
effect of input price distortions as well as output price distortions. It
measures the effect of protection policies on value added in the industry of
interest.
Many studies report the estimates of NRP and ERP in the past three
decades. In most cases, the discussion has focused on aspects of the trade
regime, and the resource allocational impact of protection. Despite
differences in methodology and definition, these studies have similar
findings.
The discussion in this chapter is based on the estimates of NRP and
ERP reported by Pairote (1975) and Paitoon et al. (1989)1*. Pairote reports
estimates of the degree of protection for 58 industries in 1964, and for 82
industries in 1971 and 1974 (Tables 2.7, 2.8, and 2.9). Paitoon reports
estimates of the degree of protection for 111 input-output traded sectors,
1) These differences are classifications of industries by trade
orientation and aggregation methods. For their classifications,
agriculture and non-agriculture, in 1981, 1984, and 1987 (Tables 2.10, 2.11, and 2.12). Because of two fundam ental differences betw een the past studies, this thesis does not attem pt to compare their results across time.
TABLE 2.7: Realized Nominal Rate of Protection for Manufacturing Industries: 1964,1971, and 1974.
Realized Nominal Rate of Protection (%)
liiu u b ir y
1964 1971 1974
A. Classified by trade orientation
Exports -21.3 -12.7 -31.5
Im port Competing 33.1 27.2 13.0
N on-im port Competing 64.0 12.1 -13.7
B. Classified by end uses
Processed Food 10.7 2.8 -33.1
Beverages & Tobacco 170.0 23.1 12.0
Construction Materials 0.0 0.0 -22.5
Intermediate Products I 4.3 8.1 4.4
Interm ediate Products II 21.2 30.5 2.4
Consum er N ondurable 31.0 23.8 4.8
Consum er Durable 27.2a 23.2 25.6
Machinery 40.8a 10.2 2.5
Transport Equipment 41.9 58.8 62.9
N ote: a. Simple average from Pairote's results. Source: Tables 4.1-4.12, Pairote (1975).
Based on the two studies, protection structures in the past three decades are characterised by five common features.
First, in comparison with neighbouring ASEAN countries, Thailand's protection policy is more inw ard oriented (Tables 2.13 and 2.14). Protection for export industries has been relatively lower than for im port competing industries. In the 1980s, Thailand took steps tow ard protectionism, while other ASEAN countries, especially Indonesia, tended to liberalize trade.
agriculture. For the manufacturing sector, ERPs were higher than NRPs and
vice versa for the agricultural sector. Thus, both output and input price
distortions contributed to the contraction of agriculture.
Third, although an export oriented strategy has been attempted since
the beginning of the 1970s, based on the nominal and effective system of
protection, this has been far from successful. Protection for import competing
industries is still relatively higher than for export industries. During the past
decade, protection for export industries increased slightly, while those for
other industries nearly doubled. Export promotion was put on top of existing
policies to protect import competing industries. The focus on heavy
protection for import competing consumer goods led to a change in the
structure of imports, which were predominantly consumer goods (in 1960),
to intermediate products and raw materials for the production of consumer
goods, and capital goods (in 1990).
TABLE 2.8: Effective Rate of Protection for Manufacturing Industries: 1964, 1971, and 1974.
Industry
Effective Rate of Protection (%)
1964 1971 1974
A. Classified by Trade Orientation
Exports -41.90 -24.29 -72.46
Import Competing 39.42 39.68 5.06
Non-import Competing 25.81 15.68 -32.27
B. Classified by End Uses
Processed Food -23.32 -0.31 -71.92
Beverages & Tobacco 49.99 107.41 4.42 Construction Materials -5.66 -16.13 -41.11
Intermediate Products I 4.05 5.30 -0.86
Intermediate Products II 36.06 44.95 -12.76
Consumer Nondurable 16.31 20.53 -6.92
Consumer Durable 18.86a 17.19 28.12
Machinery 7.09a 7.58 -10.46
Transport Equipment 121.69 146.45 181.10
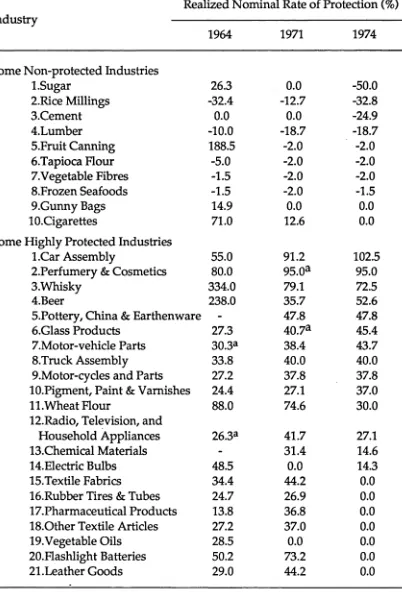
TABLE 2.9: Realized Nominal Rate of Protection for Some Industries: 1964, 1971, and 1974.
Realized Nominal Rate of Protection (%) 1 1 L I S LI y
1964 1971 1974
Some N on-protected Industries
1.Sugar 26.3 0.0 -50.0
2.Rice Millings -32.4 -12.7 -32.8
3.Cement 0.0 0.0 -24.9
4.Lumber -10.0 -18.7 -18.7
5.Fruit Canning 188.5 -2.0 -2.0
6.Tapioca Flour -5.0 -2.0 -2.0
7.Vegetable Fibres -1.5 -2.0 -2.0
8.Frozen Seafoods -1.5 -2.0 -1.5
9.Gunny Bags 14.9 0.0 0.0
lO.Cigarettes 71.0 12.6 0.0
Some Highly Protected Industries
l.C ar Assembly 55.0 91.2 102.5
2.Perfumery & Cosmetics 80.0 95.0a 95.0
3.Whisky 334.0 79.1 72.5
4.Beer 238.0 35.7 52.6
5.Pottery, China & Earthenware - 47.8 47.8
6.Glass Products 27.3 40.7a 45.4
7.Motor-vehicle Parts 30.3a 38.4 43.7
8.Truck Assembly 33.8 40.0 40.0
9.Motor-cycles and Parts 27.2 37.8 37.8
lO.Pigment, Paint & Varnishes 24.4 27.1 37.0
11.W heat Flour 88.0 74.6 30.0
12.Radio, Television, and
Household Appliances 26.3a 41.7 27.1
13.Chemical Materials - 31.4 14.6
14.Electric Bulbs 48.5 0.0 14.3
15.Textile Fabrics 34.4 44.2 0.0
16.Rubber Tires & Tubes 24.7 26.9 0.0
17.Pharmaceutical Products 13.8 36.8 0.0
18.0ther Textile Articles 27.2 37.0 0.0
19.Vegetable Oils 28.5 0.0 0.0
20.Mashlight Batteries 50.2 73.2 0.0
21.Leather Goods 29.0 44.2 0.0
N ote: a. Potential rate.
TABLE 2.10: Nominal Rate of Protection: 1981,1984, and 1987.
Nominal Rate of Protection (%)a
Industry
---1981 1984 1987
Every Industry
Export (E) 6.6 7.0 8.4
Im port Com peting (IC) 14.2 16.1 19.5
Mixed E-IC 10.6 12.1 16.1
M anufacturing Sector
Export (E) 7.1 7.6 9.3
Im port Com peting (IC) 14.9 17.0 20.7
Mixed E-IC 12.2 13.7 17.7
Agricultural Sector
Export (E) 4.2 4.2 4.2
Im port Com peting (IC) 6.2 6.5 6.8
Mixed E-IC 2.7 4.3 7.9
Note: a. Simple average from individual industries. Source: Table 3.13, Paitoon et al. (1989).
TABLE 2.11: Effective Rate of Protection: 1981,1984, and 1987.
Effective Rate of Protection (%)a
Industry
---1981 1984 1987
Every Industry
Export (E) 9.4 9.5 11.0
Im port Competing (IC) 18.0 19.7 26.3
Mixed E-IC 18.3 32.5 36.2
M anufacturing Sector
Export (E) 10.6 10.7 12.8
Im port Com peting (IC) 19.1 20.9 28.2
Mixed E-IC 21.7 38.3 42.0
Agricultural Sector
Export (E) 3.7 3.8 2.9
Im port Com peting (IC) 6.0 6.5 5.6
Mixed E-IC 1.4 3.5 7.2
TABLE 2.12: Nominal Rate of Protection for Some Industries: 1981, 1984, and 1987.
Nom inal Rate of Protection (%) Industry
1981 1984 1987
Some N on-protected Industries
Rice Milling -8.9 -8.9 -6.4
Chemical Fertilizer Minerals -2.0 -2.0 -2.8
Some Highly Protected Industries
M otor Vehicles 16.4 27.7 69.7
M ade-up Textile Goods 42.6 61.4 64.3
Cosmetics 43.2 62.1 59.6
Bakery Products 48.2 48.2 51.4
Structural Clay Products 44.4 44.4 49.3
Soap and Cleaning Preparations 36.9 31.1 41.1
Office and Household Machinery 25.4 31.6 37.7
Household Electrical Appliances 28.6 38.6 36.1
Electrical accumulator
and Batteries 32.9 26.0 35.3
Insulator Wire and Cable 29.0 29.0 33.6
Motor Cycles and Bicycles 25.6 26.2 33.5
Saw Mills 20.3 30.0 33.3
Other Chemical Products 24.2 33.1 32.3
Basic Industrial Chemicals 24.1 32.2 30.4
Paper Products 21.7 23.5 29.9
M onosodium Glutamate 38.4 38.4 29.8
Engines and Turbines 33.9 32.8 29.6
Drugs and Medicines 23.0 28.0 28.9
Breweries 0.9 0.6 10.4
Source: Table 3.13, Paitoon et al. (1989).
Despite being discriminated against, the industries with the highest grow th potential were export oriented industries, and industries producing their intermediate inputs (Paitoon et al., 1989).
m anufactures. On the other hand, discrimination or negative protection decreases the m arket price of agricultural goods and subsidizes non- agricultural consumers at the expense of farmers.
Fifth, the protection structure tends to be biased in favour of highly processed products. Also, protection for agricultural prim ary products was less than the protection for their processed products.
TABLE 2.13: International Comparison of Nominal Rate of Protection
Industry
Nom inal Rate of Protection (%)
Total Export Im port Others
Thailand
1964’) - -21.3 33.1 64.0
1971» - -12.7 27.2 12.1
1974» - -31.5 13.0 -13.7
1981» - 6.6 14.2 10.6
1984» - 7.0 16.1 12.1
1987» - 8.4 19.5 16.1
Malaysia3^
1973 28.2 9.1 4.3 35.4
1978 18.8 12.5 12.7 21.7
Singapore4!
1979 0.5 0.2 0.5 0.9
Indonesia5!
1975 70.0 56.0 74.0 20.0
1980 33.0 27.0 37.0 9.0
N ote: Except for Thailand, export industries (import industries) were those that exported or imported at least 20% of apparent consumption.
Sources: 1) Tables 4.1-4.12, Pairote (1975). 2) Table 3.13, Paitoon et al. (1989). 3) Table 4.3, Hock, L.K. (1985). 4) Table 5.6, Nga, T.B. (1985).