Article
Simplified Mathematical Model for Quantitative
Analysis of Biogas Production Rate in a Continuous
Digester
Wiratni Budhijanto*, Chandra Wahyu Purnomo, and Nobel Christian Siregar
Research Group Science for the Community, Laboratory of Food and Bioprocess Engineering, Chemical Engineering Department, Gadjah Mada University, Jl. Grafika 2, Yogyakarta 55281, Indonesia
* E-mail: [email protected]
Abstract. Experiments were conducted in a horizontal continuous biodigester constructed of 12” ID PVC pipe of 4m, 5m, and 6m length to produce biogas from cow manure slurry. Mathematical models were developed based on a simplified mechanism of anaerobic digestion. The purpose of this attempt was to analyze the digestion phenomena quantitatively and objectively in order to make quick decisions in the optimization of the installed biodigesters in the field. The data from field measurements were used to fit the mathematical model for predicting the rate of biogas production and the selectivity of methane production over carbon dioxide formation. The mathematical models described in this paper were reasonably good to fit the experimental data. Simulation using the model led to more systematic field trials to improve the biodigester performance. The analysis resulted in two useful hints for the practical improvement of the biodigesters. Firstly, the selectivity of methane over carbon dioxide was significantly affected by the ratio of water and manure in the slurry. Secondly, the conversion of the organic matters into biogas could be increased by recycling a portion of the biodigester effluent.
Keywords: Biogas, mathematical model, bioprocess, anaerobic digestion, continuous digester.
ENGINEERING JOURNAL Volume 16 Issue 5 Received 20 February 2012
1.
Introduction
We request authors to follow this guideline and format their manuscripts exactly the same as this document. The easiest way to do this is download this template and replace its contents with those in your manuscript.
1.1. Household Continuous-Biodigester
Many types of biodigester to produce biogas from organic wastes have been introduced and applied on various areas. The most well known type was the large scale communal type, e.g. fixed dome and floating dome types [1]. China, which was among the first countries which systematically developed biogas technology for rural communities, experienced that large scale biodigester often showed some drawbacks for rural implementation. Some of the reasons were the high cost and complication in maintenance [2]. Therefore, as a complementary alternative to the well known large scale biodigester, several initiatives in designing small scale biodigester for household purposes have been applied in Indonesian rural areas.
Since the year of 2007, Gadjah Mada University has developed a particular type of household biodigester made of 12 in PVC pipe illustrated in Fig. 1 [7]. The small scale biodigester is suitable for household purpose and quite affordable to be installed individually in each household possessing only 2-3 cows. After the first 20 days, the digester can be filled continuously. Users can take the effluent as ready-to-use organic fertilizer in addition to the biogas for their daily cooking activity. There have been 23 units installed in the Sitimulyo Village (in Bantul District) and currently these units support the village as one of UGM pilot project for Energy Self-Sufficient Village Program.
d
a
b c e
Fig. 1. Household biodigester developed by Gadjah Mada University (a. 4 in PVC pipes, b. 4 in 45o elbow, c. 12 in plug, d. 12 in PVC pipe, and e. 3/4 in PVC pipe (gas outlet)).
1.2. Necessity of Quantitative Analysis
Publications on low-cost digesters are generally dominated by field trials, which despite their utmost importance, still need a more systematic study to improve the efficiency, to solve long-term problems, and/or to determine the steady-state methane yield.
This project was based on interaction with community and iteration process involving on-field applications, community empowerment, user feedback, and economic consideration for business development. Consequently, the experimental method had to result in biodigester improvement directly applicable on the actual unit to the users’ satisfaction.
Biogas production takes a considerably long time to be stable. Therefore, experimental works is always time consuming and energy intensive. While this project needs direct application on the field, it cannot afford conventional trial and error experiments. On the other hand, quick decisions require a prior calculation so that the variables tested on the field units can be significantly narrowed and hence experimental work can be minimized to merely verifying the result of the mathematical simulation.
1.3. Simplified Mechanism
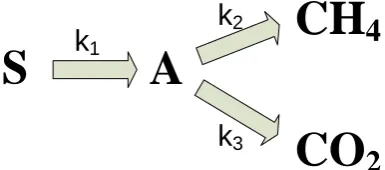
A simplified mechanism of the bioprocess in biogas production was proposed as illustrated in Fig. 2.
S
A
CO
2
CH
4
k
1k
2k
3Fig. 2. Simplified mechanism of biogas production.
All organic compounds convertible to biogas is designated as volatile solid (S). Volatile solid is defined as a portion of the feed digestible to form methane. The first stage of biogas production process is the conversion of these organic compounds into simple carboxylic acids (designated as A) as the result of hydrolytic microorganism activities. The second phase is the biogas formation, which is an anaerobic process due to methanogenic microbes. There are two possibilities of the fate of A. The desired fate is the conversion of A to methane (CH4). However, a portion of it is always inevitably converted into carbon dioxide (CO2) as a side product of microorganism metabolism. Selectivity is defined as the ratio between CH4 formed to the unwanted CO2. In an imperfect biodigester design, CO2 coexistence with CH4 could be high.
The purposes of the optimization efforts in biogas production are not only to obtain the highest conversion of S but also to achieve the highest possible selectivity towards CH4. In Fig. 2, the rates of the formation of A, CH4, and CO2 are governed by the rate constants k1, k2, and k3 respectively. The values of those rate constants are highly affected by the concentrations of nutrients, population of microorganisms, temperature, and pH. Optimization of CH4 production can be conducted systematically by optimizing the conditions so that the values of rate constants are most favorable towards maximum CH4 production rate and selectivity, i.e. choosing the conditions so that k1 and k2 will be maximum while k3 will be minimum. The scope of this paper is limited to the development of mathematical models and their physical interpretation with a verification using limited field measurements. This model is the first version that might be oversimplified. Improvements on the models will be presented in another publication of this work.
1.4. Summary of Mathematical Models
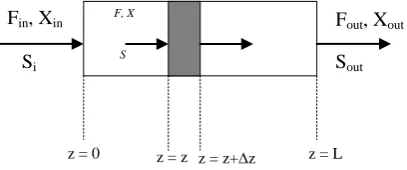
Steady state operation illustrated in Fig. 3 was used to develop a model representing the rate of organic matters conversion into new cells of microorganisms and products (CH4 and CO2). The model was derived based on the assumption that biogas production is growth associated product formation and the growth rate of the mixed culture in the biodigester is represented by the versatile growth model of Moser’s equation [3]. Complete mass balance of the configuration shown in Fig. 3 is represented in Eq. (1).
/ /
1 1
( . )z( . )zzg M p 0
X S P S
F S F S X V q X V
Y Y (1)
[image:3.595.201.394.134.219.2]Fig. 3. Volume element representation of the continuous household biodigester.
Further simplifications [4] resulted in the empirical expression of Eq. (2):
1 n
s k dS
S
dz U (2)
in which k1is a constant analogous to the rate constants of S conversion to new cells and biogas (1/day), Us
is linear mass flow rate of materials in the digester (m/s), and n is a constant analogous to the reaction
order of S consumption (dimensionless). Eq. (2) is an empirical equation due to the fact that it does not take into account the complexity of microorganism population in the system and the possibilities of complicated mechanisms of organic matters conversion into biogas (such as the effect of dissolved oxygen, the accumulation of acidic compounds as a result of microorganism metabolism, etc.).
Selectivity is modeled based on the transient data (time dependent) of the process. The mathematical expressions associated with CH4 formation and CO2 formation are represented by Eq. (3) and Eq. (4) respectively:
1
4 2
CH c
d
k A
dt (3)
2
2 3
CO c
d
k A
dt (4)
where dCH4
dt = the rate of methane formation (kmol/day); k2 = CH4 formation rate constant (day
-c1); A =
volatile fatty acid concentration (kmol/m3); dCO2
dt = the rate of carbon dioxide formation (kmol/day); c1
and c2 = adjustable constants representing the empirical orders of reactions. Selectivity is the ratio of CH4
to CO2 and based on Eq. (3) and Eq. (4), given that c1 = c2, then the point selectivity can be put as [5]:
2
3 Selectivity k
k
(5)
2.
Experimental
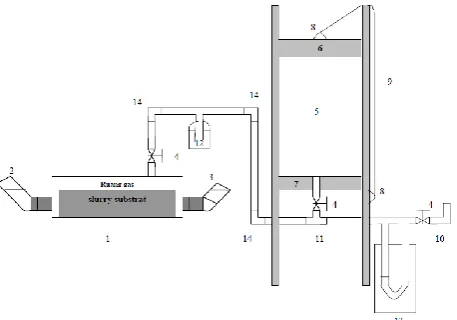
Experiments were conducted on the actual installed units in Sitimulyo Village, Indonesia. The complete unit is illustrated in Fig. 4. Six installed digesters were studied, with 2 units of 4 m of length, 2 units of 5 m of length, and 2 units of 6 m of length.
Slurry of cow manure in water was fed through the inlet until the digester is about 80% filled with slurry and the slurry surface on both inlet and outlet did not leave holes by which air can get into the digester. This was to ensure anaerobic condition in the gas space inside the digester. After the first filling, both inlet and outlet were covered and gas valve to the gas holder was opened. In the first 20 days, the plastic gas holder expanded with produced gas. This first 20 days was the transient phase of biogas
F, X
S
z = z z = z+z
z = 0 z = L
Fin, Xin
Si n
Fout, Xout
[image:4.595.195.399.84.169.2]carbon dioxide. The covers on inlet and outlet holes were removed and steady state phase was started by periodically feeding the digester with slurry of cow manure in water with varied ratios. The owners of the digesters were instructed to vary the feed concentrations for 2 months for every feeding concentration (So = 8.5 kg/m3, So = 10 kg/m3, and So = 18 kg/m3). The biogas production rate and the methane content was measured one month after the change of the feed concentration. During this steady state phase, the same measurement was conducted on the gas, the slurry’s BOD, volatile solids, and volatile fatty acids values on the inlet and outlet.
Fig. 4. Experimental set up (Notes: 1. biodigester, 2. inlet, 3. outlet, 4. valve, 5. gas holder, 6. pressing weight, 7. gas holder support, 8. weight holder, 9. ropes, 10. burner tip, 11. tee, 12. water trap, and 13. manometer).
The data used to fit the model were taken from the actual digesters installed in the village. It had been operational for several weeks after the initial filling so that the pH value had reached a stable value of 6.5 that remained constant during the period of sampling. The temperature was also constant between 29-30oC during the day and 24-25 oC during the night. Therefore, those two parameters were considered as the constants with respect to the model development. Based on our field data, those two parameters did not fluctuate significantly in Indonesian climate.
3.
Results and Discussions
3.1. Consumption of Organic Matters in the Digester Feed
0 2 4 6 8 10 12 5 6 7 8 9 10 z, meter R e m a in in g o rg a n ic c o m p o u n d , k g /m 3
Fig. 5. Verified simulation result for remaining organic compound in the biodigester effluent (at initial feed concentration So=10 kg/m3).
Figure 5 shows that the model represented by Eq. (2) is considerably good to quantify the rate of organic matter consumption in the biodigester. Simulation indicates that the extent of digestion, either to produce CH4 or CO2, is low. Only about 50% initial organic content was digested in a 12 m biodigester. Biogas production practiced in this project relied on indigenous microorganisms existing in the cow manure. Therefore, there is a possibility that increasing manure concentration in the fresh feed would increase microbial population and also availability of nutrient. This will expectedly increase the yield.
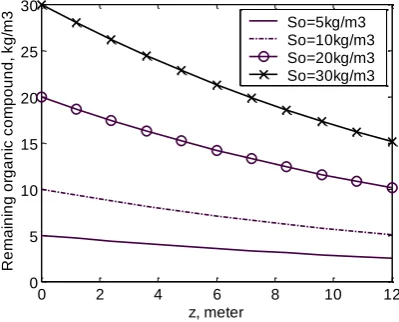
However, simulation results presented in Fig. 6 indicates that at all level of initial organic content in the fresh feed, conversion of the organic matters remain low. Even at extremely high organic content (30 kg/m3), biogas production is not as high as expected. As the purpose of this project was to design biodigester for household purpose, there are constraints inherent with the design, which are: 1). requirement of high biogas productivity to satisfy daily needs of users, 2) requirement of small size biodigester so that it is feasible to build individual unit for each house or a small cluster of neighborhood. Based on the simulation result, increasing initial organic content did not seem to be a plausible solution to increase yield. Another alternative is recycling a portion of the effluent. Two folds benefits are obtained by doing so: 1) residence time can be increased using the same small scale unit, 2) increasing the stability of the microbial population in the digester.
0 2 4 6 8 10 12
0 5 10 15 20 25 30 z, meter R e m a in in g o rg a n ic c o m p o u n d , k g /m 3 So=5kg/m3 So=10kg/m3 So=20kg/m3 So=30kg/m3
[image:6.595.192.394.88.250.2] [image:6.595.193.393.520.681.2]Fig. 7. Simulation of improvement in CH4 production rate in a biodigester with recycle to be compared to a biodigester without recycle (at initial feed concentration So=10 kg/m3).
Figure 7 presents a simulation result of the comparison between CH4 production rate in a biodigester without recycle and the one in a biodigester by recycling 80% of its effluent. The recycle simulated in Fig. 7 is a single recycle in each span on hydraulic residence time. For example, Fig. 7 represents a biodigester designed with hydraulic residence time of 20 days. At the end of each day 20, 80% of the effluent was recycled while the rest 20% was taken as an organic fertilizer and replaced by fresh cow manure slurry. In this scheme, at higher hydraulic residence time, it seems that recycle can give up to 30% increase in CH4 production rate. At short hydraulic residence time, the effect of recycle is not so profound because the longer the residence time, the more carboxylic acids (designated as A in the mechanism illustrated in Fig. 2) already exists in the recycled effluent and these acids greatly enhances CH4 formation.
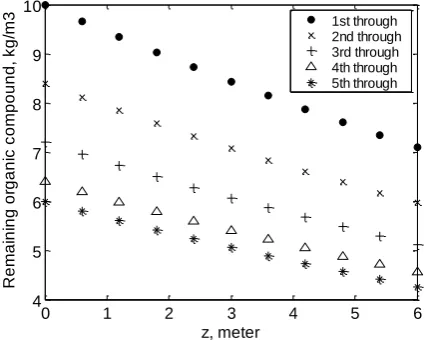
Although Fig. 7 is a positive indication that recycling effluent can increase CH4 production rate, more extent in organic matter digestion can still be possibly obtained with several times of effluent recycles. Figure 8 summarizes the simulation results for biodigester with several times of recycles.
0 1 2 3 4 5 6
4 5 6 7 8 9 10 z, meter R e m a in in g o rg a n ic c o m p o u n d , k g /m
3 1st through
2nd through 3rd through 4th through 5th through
Fig. 8. Calculated values of remaining organic content in the manure after several times of recycles (at initial feed concentration So=10 kg/m3).
Each set of data in Fig. 8 represents calculated values of the remaining organic matters in the sludge at various points in the digester of 6 meter length. Figure 8 shows that up to three times of recycles, remaining organic content still decreases significantly after each span of hydraulic residence time. Nevertheless, the fourth and fifth recycle do not seem to have profound effects. This result leads to a recommendation to recycle the effluent during three times of the residence time (e.g. 60 days for a biodigester operated at 20 day residence time) and feeding fresh feed for one full residence time (e.g. 20 days) before starting to recycle again. Table 1 shows the comparison between simulated results and the field measurement with
0 5 10 15 20
0 0.5 1 1.5 2
Hydraulic residence time, day Without recycle
Recycle ratio 0.8
[image:7.595.186.399.461.631.2]respect to CH4 production. The data have not agreed well with the simulated results. However, it shows a trend that recycles does increase the methane production.
Table 1. Comparison of simulation and field data for recycle cases (three times recycles with 80% of effluent being recycled in every feeding time and So=10 kg/m3).
Digester size
CH4 production (m3/day) Simulation Recycle Actual No recycle
4 m 1.45 0.75 0.60
5 m 1.75 0.60 0.81
6 m 2.00 0.95 0.80
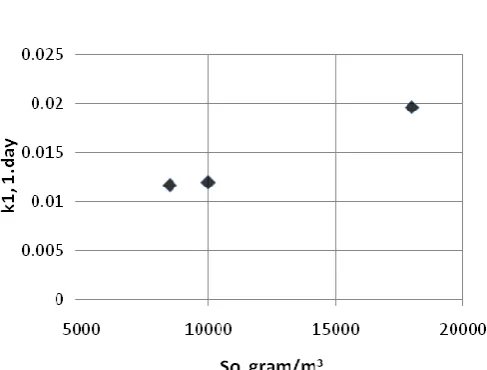
Fig. 9. Increasing k1 by increasing initial organic content in the feed.
Another alternative to increase the biogas production is putting some efforts to increase the value of k1.
Figure 9 shows that at lower values of So (initial organic content in the feed), the values of k1 does not much affected by increasing So. However, at high levels of So, the value of k1 is almost doubled. From the perspective of bioprocess, sludge with higher organic content serves as rich medium for the microorganisms to grow and perform their tasks. Besides, methanogenic microorganisms for biogas production from cow manure are indigenous microbes existing in the manure itself. In slurry with a larger portion of cow manure, there is higher probability of more microbial counts. That is why the value of k1 tends to be higher at higher organic content (in more concentrated digester feed). However, concentrated digester feed sometimes leads to a drawback in a continuous digester. More concentrated feed increases the tendency of precipitation and clogging. Therefore, to increase organic matter digestion rate, it needs to optimize the combination of recycling effluent and initial concentration of the organic matter in the digester feed.
3.2. Selectivity of CH4 Formation
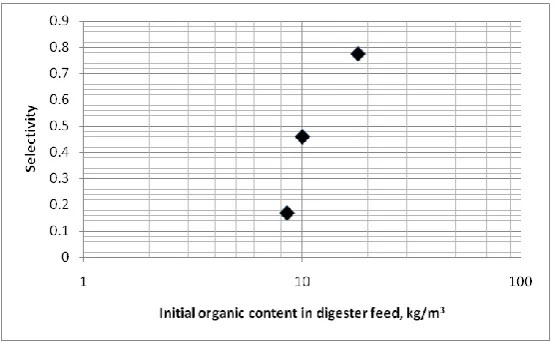
[image:8.595.166.410.261.446.2]Table 2. The effect of initial organic content on biogas (a mixture of CH4 and CO2) production (in 6 m long pipe digester, HRT of 20 days).
So (g/m3) k2 (1/day) k3 (1/day) Biogas prod., m3/day Selectivity
of CH4 over CO2 formation
18000 0.0031 0.004 1.80 0.775
10000 0.0069 0.0149 1.90 0.463
8500 0.0020 0.0118 1.50 0.169
[image:9.595.117.479.118.171.2]Based on the result presented in Fig. 10, further study on the effect of water content on selectivity is still being conducted. The results will be published in a separate paper.
Fig. 10. The effect of initial organic content in digester feed on the selectivity of methane formation.
4.
Conclusion
By means of the mathematical model and field data from Sitimulyo Village, simulations were carried out. Simulation results indicated that:
a. Remaining organic content in the digester sludge is still high at current design of the digester
b. Biogas production rate can be increased by recycling a portion of the effluent. An on-going experiment will determine the best recycling scheme.
c. Ratio of water and cow manure in the digester feed plays very important roles in the rate of digestion and selectivity as well. More water in the feed is preferable in practice because it guarantee clog-free flow of the sludge. However, with respect to both digestion rate and selectivity, too much water leads to lower digestion rate and trigger more CO2 formation.
Acknowledgement
[image:9.595.160.438.231.402.2]References
[1] J. M. Grainger and J. M. Lynch, Microbiological Methods for Environment Biotechnology. London: Academic Press, 1984, pp. 139-157.
[2] L. Yu, K. Yaoqiu, , H. Ningsheng, W. Zhifeng, and X. Lianzhong, “Popularizing household-scale biogas digester for rural sustainable energy development and green house gas mitigation,” Renewable Energy, vol. 33, pp. 2027-2035, 2008.
[3] H. W. Blanch and D. S. dan Clark, Biochemical Engineering. New York: Marcel Dekker, Inc., 1997. [4] N. C. Siregar, “Pemodelan Matematis Digester Kontinyu Horisontal untuk Produksi Biogas dari
Kotoran Sapi,” Thesis S2, Jurusan Teknik Kimia FT UGM, Yogyakarta, 2008.
[5] J. M. Smith, Chemical Engineering Kinetics. McGraw-Hill International Book Company, 1981, pp. 82-83. [6] A. D. Eaton, L. S. Clesceri, E. W. Rice, and A. E. Greenberg, Standard methods for the examination of water
and wastewater, 21st ed. Washington DC: APHA, AWWA, and WEF, 2005.
[7] C. W. Purnomo and A. Pertiwiningrum, “The development of low cost continuous biogas units,” in
Proceedings of 7th International Symposium of High Temperature Air Combustion and Gasification, Phuket,