This is a repository copy of
A survey of statistics in three UK general practice journal
.
White Rose Research Online URL for this paper:
http://eprints.whiterose.ac.uk/1092/
Article:
Rigby, A.S., Armstrong, G.K., Campbell, M.J. et al. (1 more author) (2004) A survey of
statistics in three UK general practice journal. BMC Medical Research Methodology, 4
(28). ISSN 1471-2288
https://doi.org/10.1186/1471-2288-4-28
[email protected] https://eprints.whiterose.ac.uk/
Reuse
Unless indicated otherwise, fulltext items are protected by copyright with all rights reserved. The copyright exception in section 29 of the Copyright, Designs and Patents Act 1988 allows the making of a single copy solely for the purpose of non-commercial research or private study within the limits of fair dealing. The publisher or other rights-holder may allow further reproduction and re-use of this version - refer to the White Rose Research Online record for this item. Where records identify the publisher as the copyright holder, users can verify any specific terms of use on the publisher’s website.
Takedown
If you consider content in White Rose Research Online to be in breach of UK law, please notify us by
Methodology
Open Access
Research article
A survey of statistics in three UK general practice journal
Alan S Rigby*
1, Gillian K Armstrong
2, Michael J Campbell
3and
Nick Summerton
4Address: 1Academic Cardiology, University of Hull, Kingston-upon-Hull, UK, 2NAPP Pharmaceuticals Research Limited, Cambridge, UK, 3Medical
Statistics Unit, University of Sheffield, Sheffield, UK and 4Division of Primary Care & Psychological Medicine, University of Hull,
Kingston-upon-Hull, UK
Email: Alan S Rigby* - [email protected]; Gillian K Armstrong - [email protected]; Michael J Campbell - [email protected]; Nick Summerton - [email protected] * Corresponding author
Abstract
Background: Many medical specialities have reviewed the statistical content of their journals. To our knowledge this has not been done in general practice. Given the main role of a general practitioner as a diagnostician we thought it would be of interest to see whether the statistical methods reported reflect the diagnostic process.
Methods: Hand search of three UK journals of general practice namely the British Medical Journal (general practice section), British Journal of General Practice and Family Practice over a one-year period (1 January to 31 December 2000).
Results: A wide variety of statistical techniques were used. The most common methods included t-tests and Chi-squared tests. There were few articles reporting likelihood ratios and other useful diagnostic methods. There was evidence that the journals with the more thorough statistical review process reported a more complex and wider variety of statistical techniques.
Conclusions: The BMJ had a wider range and greater diversity of statistical methods than the other two journals. However, in all three journals there was a dearth of papers reflecting the diagnostic process. Across all three journals there were relatively few papers describing randomised controlled trials thus recognising the difficulty of implementing this design in general practice.
Background
"Diagnosis is the keystone of good medical practice"[1]
General practitioners (GPs) are primarily diagnosticians [2] yet it appears that diagnosis remains their Achilles heel[3]. The problem has its origins in a misunderstand-ing of the differences of the five Ps (patients, pathologies, presentations, prevalences and predictive values) in hos-pital practice compared to primary care[4]. Decisions
made by GPs are different from those made by hospital clinicians. The precise diagnostic labels may be less important than deciding on an appropriate course of action. Hence, diagnoses are often framed in terms of binary decisions; treatment versus non-treatment, disease versus non-disease, referral versus non-referral, and seri-ous versus non-seriseri-ous for example[4].
Published: 13 December 2004
BMC Medical Research Methodology 2004, 4:28 doi:10.1186/1471-2288-4-28
Received: 15 September 2004 Accepted: 13 December 2004
This article is available from: http://www.biomedcentral.com/1471-2288/4/28
© 2004 Rigby et al; licensee BioMed Central Ltd.
BMC Medical Research Methodology 2004, 4:28 http://www.biomedcentral.com/1471-2288/4/28
From a statistical viewpoint the binary decision making process has a lot of appeal. For example, the use of the naïve Bayes' discriminant function (and from it the deri-vation of likelihood ratios) is appropriate. Proponents of Bayes' argue for its simplicity and ease of interpreta-tion[5,6]. In contrast, opponents argue that data are not used efficiently if they are simply ploughed through the "black box" of Bayes'[7,8]. Whatever the rights and wrongs of Bayes' as a technique it is time for GPs to become more familiar with statistical methods aimed at diagnosis. In relation to haematuria (blood in the urine) and the diagnosis of urological malignancy two of the authors of this paper (NS and ASR) have used Bayesian techniques in order to seek to refine diagnostic discrimi-nation by general practitioners [9]. The results from this work have been incorporated successfully into local pri-mary care oriented referral guidance.
Many medical journals, both generalist[10,11] and spe-cialist [12-18], have been reviewed for their statistical con-tent. Articles have been published in the fields of radiology, [12-14] otolaryngology, [15,16] rehabilitation medicine[17] and ophthalmology[18] to name but a few. However, general practice is under researched in this area[19]. The aim of this paper is to review three leading UK journals in general practice and to see what statistical methods are being used. It is not our intention to see if the methods are being used correctly but to look at the range of techniques reported. The outcome of this research should give pointers to the future education of GPs who wish to undertake research.
Methods
Three statisticians (MJC, ASR and GKA) (two of them holding Chartered status of the Royal Statistical Society) including one Professor, one Senior Lecturer and one Lec-turer each reviewed one leading UK journal in general practice. The fourth author (NS) is a Primary Care Physi-cian. The journals chosen were the British Medical Journal (BMJ) (general practice section), British Journal of General Practice (BJGP) and Family Practice. These three journals were chosen because they reflected the main primary care journals in the UK. The journals were hand searched for original research articles over a one-year period (1 January to 31 December 2000). Articles were classified for both their statistical content and methods of design according to criteria laid down elsewhere[10,20]. Tables 1 and 2 list the classification criteria used for both study design and statistical methods. Letters were excluded on the grounds that they are typically responses to previously published material rather than original contributions in themselves. We are aware, of course, that not all primary care research is published in these three journals alone and we com-ment on this later.
The main study was preceded by a pilot phase in which a random sample of 10 articles was classified both by statis-tical content and study design by the three statisticians. Where there were differences of opinion, consensus was reached by discussion. We met once to discuss our classi-fication system, and to iron out differences of opinion. One problem lay in how we actually classified study design. For example, one of use used the phrase 'cross-sec-tional survey' while another used the phrase 'question-naire survey' when both meant the same in terms of study design. Another problem was that we missed some of the statistical techniques (where there were many) and this required much more careful reading of the articles when we carried out the main survey. We did not carry out a for-mal reliability study of the pilot phase but instead relied on our experiences both as statisticians, and as journal reviewers. Similarly we chose not to carry out a formal reliability analysis in the main study.
Results
The total number of articles reviewed over a one year period was as follows: BMJ (general practice section) (n = 79), BJGP (n = 145) and Family Practice (n = 81).
Study design
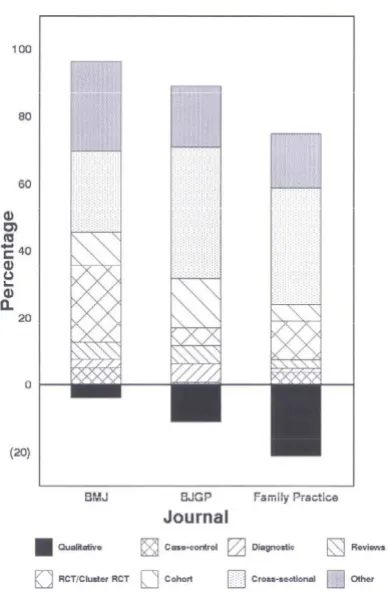
[image:3.612.314.556.107.201.2]The most common design was that of a cross-sectional survey being found in 24.1%, 39.3% and 35.1% of articles in the BMJ, BJGP and Family Practice respectively (Table 3). Although we classified articles by the term 'cross-sectional survey' this was not necessarily the choice term adopted by the journal. Sometimes the phrase 'questionnaire sur-vey' was used and we assumed this was data collected cross-sectionally. We found a similar difference in nomen-clature for our phrase 'cohort study' in which the phrase 'prospective survey' was also found. The highest propor-tion of qualitative studies was in Family Practice (21.0% compared to an average of 11.8%). Qualitative studies included those encompassing terms such as 'focus groups' and 'semi-structured interviews' for example. Figure 1
Table 1: Classification of design methods (after Wang and Zhang, 1988) [19]
Design method
Case report
shows the proportion of papers ranked by a qualitative design. For all three journals, diagnostic studies were infrequently used. Examples of these include those based on screening (e.g., the usefulness of N-terminal brain natriuretic peptide level for screening of patients with heart failure), and calculating the sensitivity and specifi-city of diagnostic tests (e.g., Helicobacter pylori for the
detection of peptic ulcer). Examples of more unusual study designs include those based on video recordings, lit-erature reviews and quasi-experimental designs.
Statistical methods
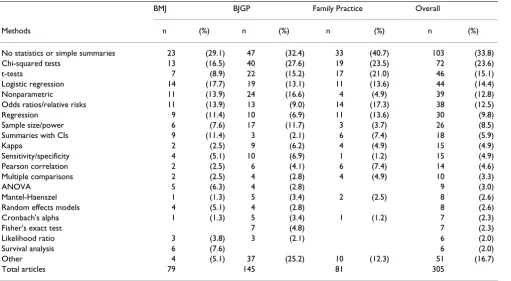
[image:4.612.58.552.93.384.2]The range of statistical methods reported can be seen in Table 4. The number of methods exceeds the number of
Table 2: Classification of statistical methods (after Emerson and Colditz, 1983) [10]
Category Brief description
No statistical methods or descriptive statistics No statistical content, or descriptive statistics only (e.g., percentages, means Standard deviations, standard errors, histograms
Contingency tables Chi-square tests, Fisher's test, McNemar's test Multiway tables Mantel-Haenszel procedure, log-linear models
Epidemiological studies Relative risk, odds ratio, log odds, measures of association, sensitivity, specificity t-tests One-sample, matched pair, and two sample t- tests
Pearson correlation Classic product-moment correlation
Simple linear regression Least-squares regression with one predictor and one response variable Multiple regression Includes polynomial regression and stepwise regression
Analysis of variance Analysis of variance, analysis of covariance, and F-tests
Multiple comparisons Procedures for handling multiple inferences on same data sets (e.g., Bonferroni techniques, Scheffe's contrasts, Duncan's multiple range procedures, Newmann-Keuls procedure) Non-parametric tests Sign test, Wilcoxon signed ranks test, Mann- Whitney test, Spearman's rho, Kendall's tau, test
for trend
Life table Actuarial life table, Kaplan-Meier estimates of survival Regression for survival Includes Cox regression and logistic regression
Other survival analysis Breslow's Kruskal Wallis, log rank, Cox model for comparing survival Adjustment & standardisation Pertains to incidence rates and prevalence rates
Sensitivity analysis Examines sensitivity of outcome to small changes in assumptions
Power Loosely defined, includes use of the size of detectable (or useful) difference in determining sample size
Transformation Use of data transformation (e.g., logs) often in regression
Cost-benefit analysis The process of combining estimates of cost and health outcomes to compare policy alternatives Other Anything not fitting the above headings includes cluster analysis, discriminant analysis, and some
[image:4.612.55.559.441.596.2]mathematical modelling
Table 3: Design methods
BMJ BJGP Family Practice Overall
Designs n (%) n (%) n (%) n (%)
Cross-sectional survey 19 (24.1) 57 (39.3) 31 (34.8) 107 (35.1) Qualitative study 3 (3.8) 16 (11.0) 17 (21.0) 36 (11.8) Cohort study 8 (10.1) 21 (14.5) 4 (4.9) 33 (10.8)
RCT 14 (17.7) 7 (4.8) 8 (9.9) 29 (9.5)
Reviews 4 (5.1) 8 (5.5) 2 (2.5) 14 (4.6)
Reliability/diagnostic 2 (2.5) 8 (5.5) 1 (1.2) 11 (3.6) Case-control study 4 (5.1) 1 (0.7) 3 (3.7) 8 (2.6)
Cluster RCT 4 (5.1) 1 (0.7) 2 (2.3) 7 (2.3)
Other 21 (26.6) 26 (17.9) 13 (16.0) 60 (19.7)
Total articles 79 145 81 305
Note
BMC Medical Research Methodology 2004, 4:28 http://www.biomedcentral.com/1471-2288/4/28
articles as some reported more than one technique. There are differences between the journals. The BMJ shows a greater range and breadth of articles than Family Practice. More sophisticated techniques are reported more often in the BMJ than either of the other two journals. In the BMJ, the two most common statistical methods used were logistic regression (n = 14, 17.7%) and the Chi-squared test (n = 13, 16.5%). The two least common were the Mantel-Haenszel statistic (n = 1, 1.3%) and Cronbach's alpha (n = 1, 1.3%). Relatively new innovations such as random effects models were seen in both the BMJ and the
BJGP. The least sophisticated statistical methods appeared in Family Practice. Methods based on likelihood ratios were seldom found in either the BMJ or BJGP and not at all in Family Practice. Nonparametric tests were often unspecified but where they were included Mann-Whitney U test, Spearman's correlation coefficient and the Wil-coxon matched-pairs signed ranks test. Multiple compari-sons included Bonferonni techniques and Scheffe's contrasts. Survival analysis included Kaplan-Meier curves and Cox regression.
One-third of all articles reported no statistics or simple summaries (for example, mean, median, percentage, standard deviation, interquartile range). No journal arti-cle with a qualitative design had any statistical content.
A large number of articles reported other statistical meth-ods, in particular the BJGP. This was due to a wide range of statistical methods being reported only once. Examples include time series, multilevel modelling and factor anal-ysis. In others, we could not decipher which statistical techniques had been used.
Table 5 shows the rank order of the statistical methods by each journal. Differences between the journals can be seen more clearly.
Discussion
Two-thirds of all journal articles relied on some type of statistical analysis beyond descriptive statistics (Table 4). The Chi-squared test and t-tests were commonly used in the BJGP and Family Practice. Papers in the BMJ and the
BJGP used more sophisticated statistical methods than
Family Practice (Table 4). While both the BMJ and the
BJGP used sophisticated methods, the BMJ used them more often. Why might this be so? The sophistication of methods used is influenced by three factors. First, issuing instructions to authors of a statistical nature. This requires a bank of statisticians available for review to which the
BMJ has access. Second, general articles on statistical aspects of writing papers. Third, tutorial type articles explaining specific techniques. The BMJ continues to take a lead in the latter two areas and indeed published statis-tical guidelines for contributions to medical journals over 20 years ago[21]. Despite the lack of sophistication in
Family Practice, there has been a trend of using more advanced statistics elsewhere,[14,15,17,20] and this has been linked to the increasing availability of computer packages[14]. The BJGP is currently struggling to find sta-tistical reviewers (personal communication by Editor to ASR). It is perhaps too easy for us to lay blame at the Editors door for this lack of sophistication. Statisticians are relatively rare, and review, for the most part, is unpaid.
Although these three journals publish a large proportion of the research in general practice within the UK, they by no means represent 100% of it. To look at this further we examined the year 2000 and undertook a MEDLINE search using the key indexing phrase 'General Practice'. We found over 800 articles in a diversity of journals. Arti-cles were published in the fields of rheumatology, medical ethics, obstetrics, public health, clinical pharmacology, clinical neurology and telemedicine to name but a few.
[image:5.612.86.280.108.408.2]We chose to look at the year 2000. Would our results be different had we selected a different year? The published Proportion of papers ranked by a qualitative design
Figure 1
literature suggests otherwise. In a 20 year old study, Emer-son and Colditz[10] found t-tests (44%) and Chi-squared tests (27%) were the most common statistical methods reported although now Chi-squared tests are more common than t-tests (Table 5). Given the emphasis on statistical computing today we might have expected less reliance on these two methods. What lies behind this lack of progress? Altman and Goodman[22] looked at the speed of the transfer of technology of new statistical meth-ods into the medical literature. They concluded that many methodological innovations of the 1980s had still not made their way into the medical literature of the 1990s suggesting a typical lag-time of 4–6 years. Lag-time is likely to be related to quality statistical review and this may be longer in journals with less impact. It is also worth reporting that since we carried out this survey (year 2000) there will have been a modest increase in the use of newer, more sophisticated statistical techniques.
Now let us turn to study design. The gold standard research design is considered to be the randomised con-trolled trial (RCT). It has been acknowledged that carrying out RCTs in general practice are difficult[23,24]. In our survey we found few RCTs (Table 3). There are particular
problems of recruitment with respect to primary care. Many issues have been discussed. For example, most practices have no formal contractual arrangement to par-ticipate in research and may be unwilling to parpar-ticipate unless there is immediate benefit to their patients. It is known that motivating practices for long-term follow-up studies particularly is not easy[25]. Practices may feel uncomfortable about randomising their patients[26] but, delegation of this duty to another may lead to a break-down of the special doctor/patient relationship. There are statistical and sample size concerns also. Randomisation by practice (so-called cluster randomisation) leads to larger sample sizes being required[27,28].
[image:6.612.57.568.100.381.2]What are the issues here? Are they really that different from secondary care? A recent publication posed the ques-tion 'What do residents really need to know about statis-tics?'[29]. The authors surveyed six journals and catalogued them for their statistical and methodological content. The most popular statistical tests across the whole range of journals were the Chi-squared test fol-lowed by the t-test. The authors concluded that with knowledge of each of these two tests clinicians should be able to interpret up to 70% of the medical literature.
Table 4: Statistical methods
BMJ BJGP Family Practice Overall
Methods n (%) n (%) n (%) n (%)
No statistics or simple summaries 23 (29.1) 47 (32.4) 33 (40.7) 103 (33.8) Chi-squared tests 13 (16.5) 40 (27.6) 19 (23.5) 72 (23.6) t-tests 7 (8.9) 22 (15.2) 17 (21.0) 46 (15.1) Logistic regression 14 (17.7) 19 (13.1) 11 (13.6) 44 (14.4) Nonparametric 11 (13.9) 24 (16.6) 4 (4.9) 39 (12.8) Odds ratios/relative risks 11 (13.9) 13 (9.0) 14 (17.3) 38 (12.5) Regression 9 (11.4) 10 (6.9) 11 (13.6) 30 (9.8) Sample size/power 6 (7.6) 17 (11.7) 3 (3.7) 26 (8.5) Summaries with CIs 9 (11.4) 3 (2.1) 6 (7.4) 18 (5.9)
Kappa 2 (2.5) 9 (6.2) 4 (4.9) 15 (4.9)
Sensitivity/specificity 4 (5.1) 10 (6.9) 1 (1.2) 15 (4.9) Pearson correlation 2 (2.5) 6 (4.1) 6 (7.4) 14 (4.6) Multiple comparisons 2 (2.5) 4 (2.8) 4 (4.9) 10 (3.3)
ANOVA 5 (6.3) 4 (2.8) 9 (3.0)
Mantel-Haenszel 1 (1.3) 5 (3.4) 2 (2.5) 8 (2.6) Random effects models 4 (5.1) 4 (2.8) 8 (2.6) Cronbach's alpha 1 (1.3) 5 (3.4) 1 (1.2) 7 (2.3)
Fisher's exact test 7 (4.8) 7 (2.3)
Likelihood ratio 3 (3.8) 3 (2.1) 6 (2.0)
Survival analysis 6 (7.6) 6 (2.0)
Other 4 (5.1) 37 (25.2) 10 (12.3) 51 (16.7)
Total articles 79 145 81 305
Notes
BMC Medical Research Methodology 2004, 4:28 http://www.biomedcentral.com/1471-2288/4/28
Conclusions
For all three journals there was a dearth of articles reflect-ing the diagnostic process. Why is this? It has already said that diagnosis is the Achilles Heel of GPs[3]. If it is not to remain this way we must start to educate doctors. The question is how. The latest "Tomorrow's Doctors"[30] states that students must have "Adequate knowledge of the sciences on which medicine is based and a good understanding of the scientific methods including princi-ples of measuring biological functions, the evaluation of scientifically established facts and the analysis of data". Clearly, there is a role for teaching statistics in the educa-tion of doctors who wish to undertake research. The much greater prevalence of methods concerning binary data (Chi-squared test, logistic regression, odds ratios/relative risks) over methods concerned with continuous data should be reflected in our (statistical) teaching. Initial training in means, medians and modes should be replaced by relative risk, absolute risk and numbers needed to treat.
Competing interests
The author(s) declare that they have no competing interests.
Authors' contributions
Three authors (ASR, GKA and MJC) carried out the litera-ture review while all four authors contributed to the writing.
Acknowledgements
We wish to thank the referees for their constructive comments.
References
1. Anonymous: Diagnosis: logic and pseudo-logic.The Lancet 1987,
1:840-841.
2. Morrell DC: Diagnosis in General Practice. Art or Science?
London: Nuffield Provincial Hospitals Trust; 1993.
3. Howie JGR: Diagnosis – the Achilles Heel?Journal of the Royal Col-lege of General Practitioners 1972, 22:310-315.
4. Summerton N: Diagnosing Cancer in Primary Care. Oxford: Radcliffe Medical Press; 1999.
5. Hilden J: Statistical diagnosis based on conditional independ-ence does not require it.Computational Methods in Biology and Medicine 1984, 14:429-435.
6. Crichton NJ, Fryer JC, Spicer CC: Some points on the use of 'Independent Bayes' to diagnose acute abdominal pain. Statis-tics in Medicine 1987, 6:945-959.
7. Feinstein AR: The haze of Bayes, the aerial palaces of decision making and the computerised Ouija board.Clinical Pharmacol-ogy and Therapeutics 1977, 21:482-496.
8. Morton BA, Teather D, du Boulay GH: Statistical modelling and diagnostic aids.Medical Decision Making 1984, 4:339-348. 9. Summerton N, Mann S, Rigby AS, Ashley J, Palmer S, Hetherington
JW: Patients with new onset haematuria in relation to uro-logical cancer attending an 'open access' clinic: assessing the discriminant value of items of clinical information in relation to urological malignancies.British Journal of General Practice 2002,
52:284-289.
10. Emerson JD, Colditz GA: Use of statistical analysis in the The New England Journal of Medicine.New England Journal of Medicine
1983, 309:709-713.
11. Ripoll RM, Terren CA, Vilalta JS: The current use of statistics in biomedical investigation: A comparison of general medicine journals.Medicina Clinica 1996, 106:451-456.
12. Elster AD: Use of statistical analysis in the AJR and Radiology-Frequency, methods and subspeciality differences.American Journal of Roentgenology 1994, 163:711-715.
13. Goldin J, Zhu W, Sayre JW: A review of statistical analysis used in papers published in Clinical Radiology and British Journal of Radiology.Clinical Radiology 1996, 51:47-50.
14. Golder W: Statistical analyses in German radiological period-icals: The last decade's development.Rofo-Fortschritte auf dem gebiet der rontgenstahlen und der bildgebdenden verfahren 1999,
171:232-239.
15. Rosenfeld RM, Rockette HE: Biostatistics in otolaryngology journals. Archives of Otolaryngology, head and neck surgery 1991,
117:1172-1176.
16. Bhattacaryya N: Peer review: Studying the major otolaryngol-ogy journals.Laryngoscope 1999, 104:640-644.
17. Schwartz SJ, Sturr M, Goldberg G: Statistical methods in rehabil-itation literature: A survey of recent publications.Archives of Physical Medicine and Rehabilitation 1996, 77:497-500.
18. Juzych MS, Shin DH, Seyedsadr M, Siegner SW, Juzych LA: Statistical techniques in ophthalmic journals. Archives of Ophthalmology
1992, 110:1225-1229.
19. Thomas T, Fahey T, Somerset M: The content and methodology of research papers published in three United Kingdom pri-mary care journals. British Journal of General Practice 1998,
48:1229-1232.
20. Wang Q, Zhang BH: Research design and statistical methods in Chinese medical journals. Journal of the American Medical Association 1998, 280:283-285.
21. Altman DG, Gore SM, Gardner MJ, Pocock SJ: Statistical guide-lines for contributions to medical journals.British Medical Journal
1983, 286:1489-1493.
[image:7.612.55.299.98.351.2]22. Altman DG, Goodman SN: Transfer technology from statistical journals to the biomedical literature – Past trends and future Table 5: Ranking of statistical techniques
BMJ BJGP Family Practice
Methods Rank Rank Rank
Chi-squared tests 2 1 1
t-tests 7 3 2
Logistic regression 1 4 4.5 Nonparametric 3.5 2 9 Odds ratios/relative risks 3.5 6 3 Regression 5.5 7.5 4.5 Sample size/power 8.5 5 11 Summaries with CIs 5.5 17 6.5
Kappa 15 9 9
Sensitivity/specificity 11.5 7.5 13.5 Pearson correlation 15 11 6.5 Multiple comparisons 15 15 9
ANOVA 10 15
Mantel-Haenszel 17.5 12.5 12 Random effects models 11.5 15
Cronbach's alpha 17.5 12.5 13.5 Fisher's exact test 10
Likelihood ratio 13 17 Survival analysis 8.5
Notes
Excluding other methods and no statistics/simple summaries. CI = confidence interval.
Publish with BioMed Central and every scientist can read your work free of charge
"BioMed Central will be the most significant development for disseminating the results of biomedical researc h in our lifetime."
Sir Paul Nurse, Cancer Research UK
Your research papers will be:
available free of charge to the entire biomedical community
peer reviewed and published immediately upon acceptance
cited in PubMed and archived on PubMed Central
yours — you keep the copyright
Submit your manuscript here:
http://www.biomedcentral.com/info/publishing_adv.asp
BioMedcentral
predictions. Journal of the American Medical Association 1994,
272:129-132.
23. Pringle M, Churchill R: Randomised controlled trials in general practice. Gold standard or fool's gold ?British Medical Journal
1995, 311:1382-1383.
24. Sheikh S, Smeeth L, Ascroft R: Randomised controlled trials in general practice: scope and application.British Journal of General Practice 2002, 52:746-751.
25. Tognoni G, Alii C, Avanzini F, Bettelli G, Colombo F, Corso R, et al.:
Randomised controlled trials in general practice: lessons from failure.British Medical Journal 1991, 303:969-971.
26. King M, Broster G, Lloyd M, Horder J: Controlled trials in the evaluation of counselling in general practice.British Journal of General Practice 1994, 44:229-232.
27. Donner A, Brown KS, Brasher P: A methodological review of non-therapeutic intervention trials employing cluster ran-domisation, 1979–1989.International Journal of Epidemiology 1990,
19:795-800.
28. Campbell MJ: Cluster randomised controlled trials in general (family) practice. Statistical Methods in Medical Research 2000,
9:81-94.
29. Reed III JF, Salen P, Bagher P: Methodological and statistical tech-niques: what do residents really need to know about statistics?Journal of Medical Systems 2003, 27:233-238.
30. General Medical Council: Tomorrow's doctors. Recommedations on undergraduate medical education 2002 [http://www.gmc-uk.org/ med_ed/tomdoc.htm].
Pre-publication history
The pre-publication history for this paper can be accessed here:
![Table 1: Classification of design methods (after Wang and Zhang, 1988) [19]](https://thumb-us.123doks.com/thumbv2/123dok_us/8091012.231463/3.612.314.556.107.201/table-classification-design-methods-wang-zhang.webp)
![Table 2: Classification of statistical methods (after Emerson and Colditz, 1983) [10]](https://thumb-us.123doks.com/thumbv2/123dok_us/8091012.231463/4.612.58.552.93.384/table-classification-statistical-methods-emerson-colditz.webp)