This is a repository copy of
Simulation of the effect of bond strength on the breakage
pattern of agglomerates by Distinct Element Method
.
White Rose Research Online URL for this paper:
http://eprints.whiterose.ac.uk/1102/
Conference or Workshop Item:
Moreno-Atanasio, R. and Ghadiri, M. (Submitted: 2004) Simulation of the effect of bond
strength on the breakage pattern of agglomerates by Distinct Element Method. In:
PARTECH 2004, International Congress for Particle Technology, 16-18 March 2004,
Nuremberg, Germany.
[email protected] https://eprints.whiterose.ac.uk/
Reuse
See Attached
Takedown
If you consider content in White Rose Research Online to be in breach of UK law, please notify us by
White Rose Consortium ePrints Repository
http://eprints.whiterose.ac.uk/
White Rose Repository URL for this paper:
http://eprints.whiterose.ac.uk/archive/00001102/
Moreno-Atanasio, R. and Ghadiri, M. (2004) Simulation of the effect of bond
strength on the breakage pattern of agglomerates by Distinct Element Method. In:
PARTECH 2004, International Congress for Particle Technology, 16-18 March
2004, Nuremberg, Germany.
Simulation of the effect of bond strength on the breakage pattern of
agglomerates by Distinct Element Method
Roberto Moreno-Atanasio, Mojtaba Ghadiri
Institute for Particle Science and Engineering. University of Leeds, Leeds, LS2 9JT, U.K.
ABSTRACT
Chemical, pharmaceutical and food industries amongst many others use agglomerates either as intermediate or manufactured products. The mechanical strength of agglomerates under impact or shear deformation during handling and processing is of great interest to these industries for optimising product specification and functionality.
The effect of surface energy on agglomerate behaviour under impact has been investigated using Distinct Element Method (DEM). Four different agglomerates were formed and impacted against a target along the direction of gravity for three different values of the surface energy (0.35, 3.5 and 35.0 J/m2). The agglomerate breakage pattern was influenced by the surface energy and a transition in the mode of failure of agglomerates was observed when the surface energy was varied. Based on the previous work, the surface energy is expressed in terms of Weber Number, We=(V-V02)ρD/γ. Agglomerates showed extensive deformation under impact at the lowest value of surface energy (0.35 J/m2) and no evidence of fragmentation was found for any value of impact velocity. In this case the agglomerates behaved macroscopically in a ductile mode. At values of surface energy larger than 3.5 J/m2 the agglomerates fragmented at the same time as local damage around the impact site occurred. This type of behaviour is typical of semi-brittle material failure. Therefore, the breakage pattern of agglomerates is influenced by the surface energy.
1 INTRODUCTION
Mechanical strength and mode of failure of agglomerates are important for industries which require a good control of strength and quality of granules with reduced cost of production.
The factors that influence agglomerate strength and mode of failure can be classified in four types: single particle properties, interparticle interactions, agglomerate properties and external parameters. The influence of some of these factors on the impact behaviour of agglomerates has been analysed previously [1-4].
The relationship between the mode of failure and strength is not straightforward. There is evidence that agglomerates formed in the same way and impacted at the same velocity fail in different ways [1] and even that the same agglomerate can show different failure patterns depending on the impact site for a certain range of values of packing fraction [2]. Furthermore, as shown by computer simulations, agglomerates with the same number of broken contacts can show different breakage patterns [2,3]. This evidence suggests that the breakage pattern is strongly influenced by the path followed by the forces originated during impact. This introduces a stochastic factor in the breakage pattern since it is impossible to know the path of the propagation of forces a priori and therefore, at present, the exact prediction of the breakage pattern is not possible.
The most important theoretical analyses relating the bond strength as characterised by surface
energy with the strength of agglomerates were developed by Kendall [5] and Rumpf [6]. Kendall defined agglomerate strength as the resistance of the agglomerate to fracture by means of crack propagation. In contrast, Rumpf considered a plane of failure and defined the strength as the force required to break all contacts simultaneously on that plane. These models apply to the cases in which agglomerates show a fragmentation plane and they are not related to the failure by extensive disintegration as sometimes occurs experimentally. Furthermore the application of these two models to predict the impact strength of agglomerates, where the agglomerates are subjected to dynamic loading, is not straightforward.
It has been shown by using computer simulations that the impact strength of agglomerates is strongly influenced by the bond strength [4,7,8] although there is no work that relates the breakage pattern with the bond strength.
The work reported here focuses on the effect of bond strength on the agglomerate breakage pattern. The present investigation has been carried out by keeping all agglomerate properties constant and only changing the strength of the interparticle bonds.
2 SIMULATION DETAILS
2.1 Agglomerate formation
Four different agglomerates made of 3000 monodisperse particles with elastic modulus of
31 GPa, density of 2000 kg/m3, particle radius of 50 m, friction coefficient of 0.35 and Poisson’s ratio of 0.3. For each agglomerate, three different cases corresponding to three different values of the surface energy (0.35, 3.5 and 35.0 J/m2) of the primary particles have been considered.
The agglomerates were formed by randomly positioning 3000 particles within a spherical space. A centripetal field was applied and the particles were brought together in order to form a dense spherical agglomerate. During this first stage the particles were frictionless and non-cohesive, which allowed an easier agglomeration of the material. Once the assemblies reached a stable number of interparticle contacts, friction and surface energy were introduced slowly in small steps in order to avoid the accumulation of residual stresses.
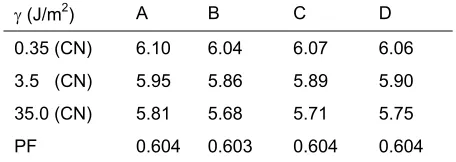
[image:4.595.55.283.520.601.2]The packing fraction, PF, and coordination number, CN, are given in Table 1. The proposed agglomerates showed approximately constant values of packing fraction and coordination number through the whole assembly [7]. The values of packing fraction have been calculated excluding an outer layer of 50 m thickness with the objective of avoiding the effect of the roughness of the surface which is less dense. The differences in coordination number are due to the effect of surface energy. Larger values of surface energy produced a slightly larger compression in such a way that particles came closer to each other although the value of packing fraction does not vary significantly.
Table 1. Coordination number and packing fraction for the different values of surface energy, γ.
γ (J/m2) A B C D
0.35 (CN) 6.10 6.04 6.07 6.06
3.5 (CN) 5.95 5.86 5.89 5.90
35.0 (CN) 5.81 5.68 5.71 5.75
PF 0.604 0.603 0.604 0.604
Particles when in contact can only deform elastically. The interparticle contact force models used are reported elsewhere [3,7].
Once the agglomerates have been formed the impact process was performed by giving an initial impact velocity to the agglomerate in the same direction as gravity and perpendicular to the target.
3 RESULTS
3.1 Analysis of the breakage pattern of agglomerates
In previous work [7] it has been shown that the number of contacts broken in agglomerates scale with surface energy , in the form:
3 / 2 2 0
C D(V V ) ED
N N ⎟⎟ ⎠ ⎞ ⎜⎜ ⎝ ⎛ γ γ
ρ -
(1)
where is the particle density, D the particle diameter, N is the initial number of bonds, E the elastic modulus, the surface energy, V the impact velocity and V0 is the minimum velocity
under which no breakage of contacts is observed. However, Eq. 1 does not predict the breakage pattern for which the exact location of the broken contacts would be necessary to know.
The breakage pattern of agglomerates can be analysed by measuring the size of the residual fragment and the largest detached fragment. When the sizes of these two fragments are comparable with the initial agglomerate size there is a clear indication that the agglomerates have fragmented. If the largest detached fragment is much smaller than the residual fragment, the agglomerate is failing due to the detachment of debris.
Figure 1 shows the size of the residual cluster and the largest fragment detached from agglomerate A. For reasons of brevity the plots for the other three agglomerates have not been shown since similar characteristics were found for all of them. The shape of the curves of the largest fragment with impact velocity suggests that three regimes of breakage can be distinguished.
Table 2 shows the values of impact velocity at which the different regimes of breakage occurred. These values are averaged for the four agglomerates. It is clearly possible to observe that the different regimes occurred at different velocities for different values of surface energy.
Table 2. Ranges of impact velocities at which the different regimes occur.
Regimes 0.35 J/m2 3.5 J/m2 35.0 J/m2
I. Vel (m/s) 0.08 ± 0.02 0.63 ± 0.2 4.2 ± 1.3
II. Vel (m/s) 0.2 ± 0.05 1.3 ± 0.1 7.3 ± 0.5
III. Vel (m/s) 1.8 ± 0.5 4.5 ± 0.9 25 ± 10
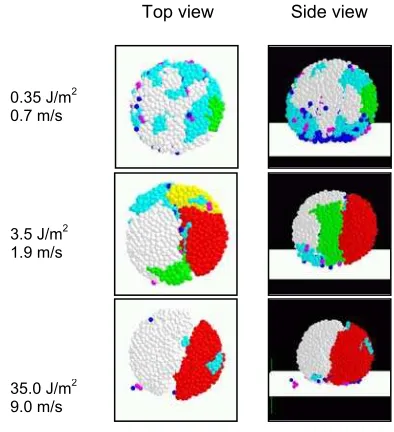
In the second regime there is a strong dependency of the size of the residual fragment on the impact velocity. The agglomerate behaviour during this second regime is different for different values of surface energy. In the assemblies with the lowest value of surface energy (0.35 J/m2) the impact velocity does not modify appreciably the size of the largest fragment detached from the agglomerate. This fragment never reaches more than 10% of the initial agglomerate size. However, for the cases with larger values of surface energy the curve of the size of the second largest fragment as a function of the impact velocity shows a peak. At this peak the sizes of the two largest fragments are comparable. The mean for the four agglomerates of the sum of the sizes of the two largest fragments are 66±7% and 82±12% for the values of surface energy of 3.5 J/m2 and 35.0 J/m2, respectively. This suggests that the agglomerates have fragmented into two large fragments and the production of debris is lower for larger values of surface energy. This can be corroborated by visual observation of the agglomerates after impact.
In Fig. 2 we observe agglomerate A after impact, during the second regime. The fragmentation for larger values of surface energy is accompanied by less production of debris. This characteristics was also observed for the other three agglomerates.
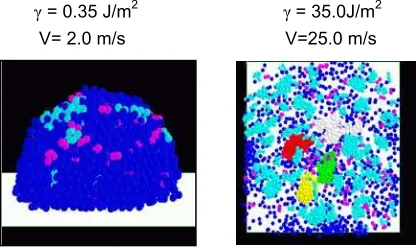
The analysis of the size of the two largest fragments during the third regime does not show any differences for the different values of surface energy in contrast to the second regime. All agglomerates disintegrate into small clusters in all cases (Fig. 1). Fig. 3 shows different views of agglomerate A after impact in the third regime of breakage for the values of surface energy of 0.35 and 35.0 J/m2. For the lowest surface energy, the agglomerate fails by disintegration into small fragments which remain deposited in the impact place. In contrast for the largest value of surface energy the small fragments and single particles detached from the agglomerate fly away from the impact site, presumably due to the large amount of kinetic energy stored in the agglomerate in form of elastic strain energy.
3.2 Discussion
Different types of breakage pattern have been observed depending on the impact velocity and bond strength. For the lowest value of surface energy no fragmentation of the agglomerates was found for any value of impact velocity. The agglomerates seem to fail by extensive deformation and bond breakage leading to disintegration of the agglomerate. These observations are in full agreement with the previous computer simulations and experimental results of the impact of lactose agglomerates where the value of surface energy was 0.25 J/m2
0.1 1 10
0.0 0.2 0.4 0.6 0.8 1.0 1st
0.35 J/m2
2nd 0.35 J/m2 1st
3.5 J/m2
2nd
3.5 J/m2
1st
35.0 J/m2
2nd
35.0 J/m2
Fra g m ent siz e
[image:5.595.59.254.99.228.2]Impact velocity (m/s)
Figure 1: Size of the two largest fragments for agglomerate A as a function of impact velocity and for three different values of surface energy.
Figure 2: Top and side views of agglomerate A impacted at different velocities during the second regime of breakage. Colour coding: light grey, largest fragment; red, second largest fragment, yellow third largest fragment; green, clusters between 300 and 100 particles; cyan clusters between 4 and 100 particles; pink, doublets; blue, singlets.
Top view Side view
[image:5.595.56.282.312.381.2][10]. The failure of this agglomerate could be comparable to the ductile failure of single particles in the sense that the agglomerates fail by extensive deformation accompanied by the disintegration into small fragments. For larger values of the surface energy both fragmentation and disintegration into small fragments occur. This behaviour could be comparable with the semibrittle failure of single particles and is in agreement with other computer simulation work [11] where agglomerates with values of surface energy of 1 J/m2 have shown fragmentation under impact for a certain range of impact velocities.
However, it is not clear that if the change in mode of failure of agglomerates occurs suddenly at a certain value of surface energy or there is a smooth transition between both modes of failure. Further work is necessary to elucidate the effect of factors such as packing fraction, particle density or elastic modulus and yield stress of primary particles on the transition velocities.
4 CONCLUSIONS
Agglomerates show extensive deformation under impact at the lowest value of the surface energy (0.35 J/m2) and no evidence of fragmentation was found for any value of impact velocity. In this case the agglomerates behaved macroscopically in a ductile mode. However, at higher values of surface energy (3.5 J/m2 and 35.0 J/m2) the agglomerates fragmented at the same time as local damage around the impact site occurred. This type of behaviour is typical of semi-brittle materials. In addition, the amount of debris produced at the impact site when the agglomerates fragmented was smaller at the highest value of surface energy (35.0 J/m2).
A transition in the mode of failure of agglomerates is observed when the interface energy is varied.
At low surface energies the agglomerate behaves in a ductile mode. When the surface energy is increased the behaviour is more semibrittle. It is not clear if such a transition is gradual or occurs sharply at a specific value of the surface energy. Agglomerate failure pattern and the transition of one mode of breakage to another is a complex problem whose analysis by Distinct Element Method enables the mapping out of various breakage regimes.
5 REFERENCES
[1] Subero, J. and Ghadiri, M.: Breakage patterns of agglomerates. Powder Technology, 120, (2001) 232-243.
= 0.35 J/m2 = 35.0J/m2 V= 2.0 m/s V=25.0 m/s
[image:6.595.65.275.239.363.2][2] Mishra B. K. and Thornton, C.: Impact breakage of particle agglomerates, International Journal of Miner. Process., 61, (2001) 225-239.
Figure 3: Agglomerate A following impact at different velocities during the third regime of breakage. Colour coding: light grey, largest fragment; red, second largest fragment, yellow third largest fragment; green, fourth largest cluster; cyan clusters between 4 and 100 particles; pink, doublets; blue, singlets.
[3] Moreno, R., Antony, S. J., Ghadiri, M.: Effect of the impact angle on the breakage of agglomerates. Powder Technology, 130, (2003) 132 -137.
[4] Kafui, K. D., Thornton, C.: Numerical simulations of impact breakage of a spherical crystalline agglomerate, Powder Technology, 109, (2000) 113-132.
[5] Kendall, K. J.: Agglomerate strength. Powder Metallurgy, 31, (1988) 28-31.
[6] Johnson, K. L.: Contact Mechanics. Cambridge University Press (1985).
[7] Moreno, R.: Computer simulation of impact of spherical agglomerates using Distinct Element Method. PhD thesis. University of Surrey, Guildford, UK (2003).
[8] Subero, J., Ning. Z., Ghadiri, M. and Thornton, C.: Effect of interface energy on the impact strength of agglomerates. Powder Technology,
105, (1999)66-73.
[10] Ning. Z, Boerefijn, R., Ghadiri, M. Thornton, C.: Distinct element simulation of impact breakage of lactose agglomerates. Advanced Powder Technology, 8, (1996) 15-37.