parameters based on broad-band imaging observations
.
White Rose Research Online URL for this paper:
http://eprints.whiterose.ac.uk/144865/
Version: Published Version
Article:
de Grijs, R., Anders, P., Lamers, H.J.G.L.M. et al. (5 more authors) (2005) Systematic
uncertainties in the analysis of star cluster parameters based on broad-band imaging
observations. Monthly Notices of the Royal Astronomical Society, 359 (3). pp. 874-894.
ISSN 0035-8711
https://doi.org/10.1111/j.1365-2966.2005.08914.x
This article has been accepted for publication in Monthly Notices of the Royal Astronomical
Society © 2005 RAS. Published by Oxford University Press on behalf of the Royal
Astronomical Society. All rights reserved.
[email protected]
https://eprints.whiterose.ac.uk/
Reuse
Items deposited in White Rose Research Online are protected by copyright, with all rights reserved unless
indicated otherwise. They may be downloaded and/or printed for private study, or other acts as permitted by
national copyright laws. The publisher or other rights holders may allow further reproduction and re-use of
the full text version. This is indicated by the licence information on the White Rose Research Online record
for the item.
Takedown
If you consider content in White Rose Research Online to be in breach of UK law, please notify us by
Systematic uncertainties in the analysis of star cluster parameters based
on broad-band imaging observations
R. de Grijs,
1⋆
P. Anders,
2H. J. G. L. M. Lamers,
3,4N. Bastian,
3,5U. Fritze-v. Alvensleben,
2G. Parmentier,
6,7†
M. E. Sharina
8and S. Yi
9 1Department of Physics and Astronomy, The University of Sheffield, Hicks Building, Hounsfield Road, Sheffield S3 7RH 2Universit¨atssternwarte, University of G¨ottingen, Geismarlandstr. 11, 37083 G¨ottingen, Germany3Astronomical Institute, Utrecht University, Princetonplein 5, 3584 CC Utrecht, the Netherlands 4SRON Laboratory for Space Research, Sorbonnelaan 2, 3584 CA Utrecht, the Netherlands 5European Southern Observatory, Karl-Schwarzschild-Strasse 2, 85748 Garching, Germany
6Institute of Astrophysics and Geophysics, Universit´e de Li`ege, Sart-Tilman (B5c), 4000 Li`ege, Belgium 7Astronomical Institute, University of Basel, Venusstrasse 7, CH-4102 Binningen, Switzerland 8Special Astrophysical Observatory, Russian Academy of Sciences, N. Arkhyz, KChR 369167, Russia 9Astrophysics, University of Oxford, Keble Road, Oxford OX1 3RH
Accepted 2005 February 11. Received 2005 February 10; in original form 2004 July 13
A B S T R A C T
High-resolutionHubble Space Telescope(HST) imaging observations of star cluster systems provide a very interesting and useful alternative to spectroscopic studies for stellar population analyses with 8-m class telescopes. Here, we assess the systematic uncertainties in (young) cluster age, mass and (to a lesser extent) extinction and metallicity determinations, based on broad-band imaging observations with theHST. Our aim here is to intercompare the results obtained using a variety of commonly used modelling techniques, specifically with respect to our own extensively tested multidimensional approach. Any significant differences among the resulting parameters are due to the details of the various, independently developed, modelling techniques used, rather than to the stellar population models themselves. Despite the model uncertainties and the selection effects inherent to most methods used, we find that thepeaksin the relative age and mass distributions of a given young (109yr) cluster system can be derived
relatively robustly and consistently, to accuracies ofσt≡log(age/yr)0.35 andσM≡ log(Mcl/M⊙)0.14, respectively, assuming Gaussian distributions in cluster ages and
masses for reasons of simplicity. The peaks in the relative mass distributions can be obtained with a higher degree of confidence than those in the relative age distributions, as exemplified by the smaller spread among the peak values of the mass distributions derived. This implies that mass determinations are mostly insensitive to the approach adopted. We reiterate that as extensive a wavelength coverage as possible is required to obtain robust and internally consistent age and mass estimates for the individual objects, with reasonable uncertainties. Finally, we conclude that theactualfilter systems used for the observations should be used for constructing model colours, instead of using conversion equations, to achieve more accurate derivations of ages and masses.
Key words: methods: data analysis – galaxies: spiral – galaxies: starburst – galaxies: star
clusters.
1 I N T R O D U C T I O N
Thesystematicuncertainties in the determination of the ages, masses
and (to a lesser extent) extinction and metallicity of young
extra-⋆E-mail: [email protected]
†Present address: Institute of Astronomy, University of Cambridge, Madin-gley Road, Cambridge CB3 0HA.
galactic star clusters, based on broad-band imaging observations, but using a variety of analysis approaches, are poorly understood. Our aim in this paper is to intercompare the results obtained from
Hubble Space Telescope(HST) observations of carefully selected
young star cluster samples using a variety of commonly used mod-elling techniques, and to characterize the major differences among the techniques. We will do this specifically with respect to our own extensively tested multidimensional approach, which we will use as our main benchmark.
D
o
w
n
lo
a
d
e
d
fro
m
h
ttp
s:
//a
ca
d
e
mi
c.
o
u
p
.co
m/
mn
ra
s/
a
rt
icl
e
-a
b
st
ra
ct
/3
5
9
/3
/8
7
4
/9
8
0
1
7
2
b
y
U
n
ive
rsi
ty
o
f S
h
e
ffi
e
ld
u
se
r
o
n
1
1
A
p
ri
l 2
0
1
1.1 Star clusters as tracers of violent star-forming episodes
At one time or another during its lifetime, every galaxy will be affected by the external gravitational effects, however minor, exerted by its neighbouring galaxies. Irrespective of the precise interaction geometry, the results of such interactions are often striking: depend-ing on the available gas reservoir, violent star formation will ensue,
frequently predominantly in the guise of active starcluster
forma-tion (e.g. Whitmore et al. 1999; de Grijs, O’Connell & Gallagher 2001; de Grijs, Bastian & Lamers 2003a; de Grijs et al. 2003c; and references therein). Thus, where the above scenario holds, the age distribution of a galaxy’s star cluster population reflects its violent interaction history.
The study of young and intermediate-age star cluster systems in
a variety of galactic environments out to100 Mpc has become a
major field in extragalactic astrophysics in recent years, significantly
stimulated by the superb imaging quality of theHST. One of the
key diagnostic tools often utilized to predict the fate of such cluster systems is the cluster luminosity function (CLF; based on broad-band imaging observations).
Significant age spreads in young cluster systems – which might still be undergoing active cluster formation – affect the observed CLF (Meurer 1995; Fritze-v. Alvensleben 1998, 1999; de Grijs et al. 2001, 2003a). This might, in fact, make an intrinsically log-normal CLF appear as a power law (e.g. Miller et al. 1997; Fritze-v. Alvensleben 1998); the exact shape of the intrinsic CLF, whether a power law or a log-normal distribution, is still being debated (e.g. Vesperini 2000, 2001 versus Fall & Zhang 2001; see also Lamers et al. 2004). It is obviously very important to obtain accurate age estimates for the individual clusters within such a system and to correct the observed CLF to a common age, before interpreting it as
anintrinsicCLF (Fritze-v. Alvensleben 1999; de Grijs et al. 2001,
2003a).
1.2 Star cluster metallicities and the importance of interstellar dust
The metallicities of star clusters produced in the high-pressure en-vironments of galaxy interactions, mergers and starbursts are an important discriminator against the old Milky Way-type globular clusters (GCs), thought to be the oldest building blocks of most nearby spiral and elliptical galaxies. They are expected to corre-spond to the interstellar medium (ISM) abundances of the inter-acting/starburst galaxies, and are therefore most likely to be signifi-cantly more metal-rich than those of halo GCs in the Milky Way and other galaxies with old GC systems. However, ISM abundances span a considerable range among different galaxy types, from early-type spirals to dwarf irregulars (e.g. Ferguson, Gallager & Wyse 1998), and may also exhibit significant radial gradients (Oey & Kenni-cutt 1993; Zaritsky, KenniKenni-cutt & Huchra 1994; Richer & McCall 1995). Hence, a considerable metallicity range may be expected for star clusters produced in interactions of various types of galaxies and even among the clusters formed within one global galaxy-wide starburst.
A significant increase of the ISM abundance in massive gas-rich galaxies may occur during strong bursts (Fritze-v. Alvensleben & Gerhard 1994, their fig. 12b). At the same time, typically within
a few times 108 yr, some fraction of the gas enriched by dying
first-generation burst stars may well be shock-compressed to cool fast enough to be built into later generations of stars or clusters produced in the on-going burst. The same effect may occur when
multiple bursts occur in a series of close encounters between two or more galaxies before their final merger.
Precise (relative) metallicity determinations for individual young star clusters are important not only to address these issues, but also for the correct derivation of ages from broad-band colours or spectral energy distributions (SEDs).
Dust extinction is often very important in young cluster systems. In particular, the youngest post-starburst galaxies and galaxies with on-going starbursts often show strong and patchy dust structures. For instance, the youngest clusters in the overlap region of the two galactic discs in the Antennae galaxies are highly obscured in the optical and are best detected in near- or mid-infrared observations (Mirabel et al. 1998; Mengel et al. 2001). Similarly, Lan¸con et al. (2003) discovered one of the most massive young star clusters in
M82 based on near-infrared (NIR) HST observations; at optical
wavelengths, the cluster is completely obscured. Older merger rem-nants like NGC 7252 or 3921 seem to have blown their inner regions clear of all the gas and dust left over from intense star formation (e.g. Schweizer et al. 1996). Extinction estimates towards individual clusters are therefore as important as individual metallicity estimates in order to obtain reliable ages and masses.
1.3 Multipassband photometry as a prime diagnostic
Spectroscopy of individual massive young clusters, although feasi-ble today with 8-m class telescopes for the nearest systems, is very time-consuming, since observations of large numbers of clusters are required to obtain statistically significant results. Multipassband imaging is a very interesting and useful alternative, in particular if it includes coverage of NIR and/or ultraviolet (UV) wavelengths (e.g. de Grijs et al. 2003b; Anders et al. 2004b). There are obvi-ously limitations to the accuracy of the cluster parameters derived from broad-band imaging observations (e.g. de Grijs et al. 2003a,b;
Anders et al. 2004b; Bastian et al. 2005), but therelativeoverall
characteristics derived for the clusterpopulationsas a whole appear
to be relatively robust.
In this paper, we assess the systematic uncertainties in age and mass determinations, and to a lesser extent also in extinction and metallicity determinations, for young star cluster systems based on the use of broad-band, integrated colours, employing a variety of independently developed methods to analyse extragalactic star clus-ters as so-called ‘simple stellar populations’ (SSPs): star clusclus-ters are the simplest objects to model, since they approximate single-age, single-metallicity populations with a range of stellar masses. Stochastic sampling effects of the stellar initial mass function (IMF) also affect star cluster properties, in particular for low-mass objects. However, since they affect broad-band photometry to a smaller ex-tent than spectroscopy, and because we are dealing here with high-mass clusters only, we will not include these effects in this paper. Our main aim in this paper is to intercompare the results obtained for sets of well-calibrated cluster SEDs using a variety of commonly used modelling techniques, specifically with respect to our own ex-tensively tested multidimensional approach (see Section 3.7).
In order to determine theabsolutesystematic uncertainties caused
by the intrinsic differences in the models and methods in use in the literature, we distributed sets of broad-band star cluster photome-try (described in Section 2) to representatives of the various groups active in this field, and requested them to derive the cluster param-eters using their specific methodology, wherever the data allowed this to be done. The models and methods are described in Section 3; we emphasize that most of the comparisons among methods done in this paper should be considered relative to the results obtained
D
o
w
n
lo
a
d
e
d
fro
m
h
ttp
s:
//a
ca
d
e
mi
c.
o
u
p
.co
m/
mn
ra
s/
a
rt
icl
e
-a
b
st
ra
ct
/3
5
9
/3
/8
7
4
/9
8
0
1
7
2
b
y
U
n
ive
rsi
ty
o
f S
h
e
ffi
e
ld
u
se
r
o
n
1
1
A
p
ri
l 2
0
1
using the AnalySED method described in Section 3.7. We summa-rize the results from applying our AnalySED approach to a large grid of artificial cluster data in Section 4, in order to establish the theoretical benchmark for further comparisons among approaches. In Section 5 we compare the overall, relative parameter distribu-tions, while in Section 6 one-to-one comparisons between the var-ious method plus model combinations for the individual clusters in both of our samples are discussed; the results from each of the methods used for both cluster samples are included in the Appendix. We extend this discussion by considering the effects of converting the cluster photometry to different filter systems (Section 7), and conclude the paper in Section 8.
2 T H E C L U S T E R D ATA S E T S
The field of stellar population modelling using extragalactic com-pact star cluster systems has undergone a major expansion since
high-resolution, well-calibratedHSTobservations became available
to the community. The application of stellar population synthesis of galactic subcomponents has become almost trivial for
galax-ies within ∼20–30 Mpc, while star cluster population modelling
is very well feasible out to ∼100 Mpc, at least for the brighter
(and therefore more massive) clusters within a given cluster pop-ulation [see e.g. de Grijs et al. (2003d) and Pasquali, de Grijs & Gallagher (2003) for examples towards and close to the distance
limit]. On-going and futureHSTprogrammes will continue to
pro-vide high-resolution UV–optical–NIR imaging of large samples of galaxies out to these distances. We therefore expect that modelling simple stellar populations and their broad-band SEDs will remain a key diagnostic tool for both the study of the evolution of extra-galactic star cluster systems and their relation to Milky Way-type GCs, and for the analysis of galactic star formation and interaction histories.
Therefore, we decided to focus our comparison of models and
methods onHST-based imaging data. In addition, the calibration of
HST measurements is well understood, and therefore does not
[image:4.612.59.556.533.739.2]in-troduce additional uncertainties as caused by, for example, temporal variations in the atmospheric transmission that one would have to deal with if ground-based observations were used.
Table 1. HSTSTMAGphotometry of the NGC 3310 cluster sample. The magnitudes are expressed in theSTMAGHSTflight system, derived from the count rates in the images asmSTMAG= −2.5 log(count s−1)+zero-point offset; the zero-point offset is defined by the image header keywordsPHOTFLAMandPHOTZPT.
ID mF300W mF336W mF439W mF606W mF814W mF110W mF160W mF205W
G1-01 18.176±0.034 18.207±0.038 18.735±0.064 19.105±0.046 20.173±0.059 21.162±0.064 22.157±0.119 22.451±0.063 G1-02 17.498±0.032 17.445±0.027 17.905±0.033 18.938±0.062 20.006±0.066 20.858±0.042 22.255±0.091 22.691±0.089 G1-03 19.198±0.080 19.352±0.077 19.398±0.078 20.439±0.095 20.958±0.057 21.482±0.049 22.285±0.063 23.089±0.098 G1-04 19.174±0.042 19.500±0.095 19.858±0.113 20.349±0.085 20.744±0.040 21.231±0.050 21.762±0.043 22.412±0.034 G1-05 19.983±0.182 20.121±0.181 20.032±0.174 20.593±0.121 21.062±0.096 21.740±0.079 22.311±0.069 23.377±0.079 G1-06 17.523±0.023 17.643±0.022 18.402±0.035 18.796±0.040 20.202±0.061 21.239±0.102 22.260±0.158 22.448±0.173 G1-07 16.646±0.011 16.788±0.011 17.248±0.030 17.411±0.030 18.710±0.033 19.607±0.038 20.853±0.072 20.870±0.060 G1-08 20.539±0.168 20.887±0.233 20.553±0.124 21.124±0.089 22.010±0.110 22.668±0.134 23.493±0.192 25.675±1.261 G1-09 20.172±0.078 19.857±0.066 20.091±0.079 20.896±0.089 21.730±0.092 22.065±0.141 22.861±0.187 22.946±0.160 G1-10 18.186±0.040 18.182±0.038 18.744±0.068 19.127±0.052 20.279±0.075 20.925±0.049 21.911±0.043 22.463±0.086 G1-11 19.174±0.071 19.305±0.059 19.511±0.080 20.259±0.094 20.465±0.104 21.390±0.160 21.742±0.160 22.770±0.188 G1-12 17.336±0.115 17.467±0.118 17.864±0.085 18.714±0.162 19.574±0.110 20.386±0.116 21.278±0.104 21.716±0.111 G1-13 19.694±0.115 20.563±0.234 19.594±0.116 21.057±0.199 21.284±0.116 21.629±0.098 21.955±0.072 22.847±0.107 G1-14 20.622±0.370 20.219±0.219 20.308±0.250 21.032±0.175 21.208±0.109 21.774±0.105 22.161±0.094 23.289±0.217 G1-15 19.827±0.228 19.870±0.174 19.891±0.143 20.384±0.071 21.024±0.068 21.604±0.131 22.128±0.166 23.244±0.268 G1-16 21.149±0.804 21.063±0.600 20.762±0.360 20.902±0.158 21.270±0.090 21.876±0.081 22.431±0.113 22.880±0.110 G1-17 19.787±0.094 19.967±0.121 19.455±0.080 20.818±0.117 20.903±0.080 21.218±0.056 21.609±0.056 22.234±0.059
We selected subsamples from large populations of young star cluster systems extensively studied in the literature, which we re-quired to be among the brighter members of their respective pop-ulations (thus minimizing the observational uncertainties), as well as spanning a large age range (based on preliminary analyses, as described below). Ideally, we would have preferred to select cluster
samples for which bothHSTmeasurements in a minimum of four
broad-band passbands could be obtained, as well as independently determined parameters from spectroscopic observations. Unfortu-nately, however, such data sets are not yet available. On the other hand, Schweizer, Seitzer & Brodie (2004) recently showed con-vincingly that spectroscopic age determinations are not necessarily better or more accurate than photometrically obtained ages, at least
in the age range of∼100–500 Myr.
Our basic cluster samples were taken from the following sources:
(i) NGC 3310, a nearby spiral galaxy exhibiting dominant star cluster formation in a circumnuclear starburst ring. This galaxy was
covered byHSTby the largest possible wavelength range. The full
set of eight broad-bandSTMAGmagnitudes for the∼300 clusters in
the galaxy’s centre (located in the starburst ring and outside of it), from F300W (‘mid-UV’) to F205W were published and analysed in de Grijs et al. (2003b,c). We selected 17 of these clusters for the present analysis, all with well-determined, high-quality photometry in the entire set of available passbands (see Table 1).
(ii) NGC 4038/39 (the ‘Antennae’). Standard Johnson–Cousins
UBVIphotometry and Hαequivalent widths (EWs) for its large
population of young to intermediate-age star clusters were obtained
during a number ofHSTimaging campaigns by Whitmore and
col-laborators (see e.g. Whitmore et al. 1999). Of the 20 objects selected for the purpose of this paper (Table 2), all have well-determined
UBVImagnitudes (obtained via conversion of theHSTflight system
magnitudes using the Holtzman et al. (1995) conversion equations;
but see Section 7), while 10 of them have measured HαEWs as
well.
3 M O D E L S A N D M E T H O D S
Although the methods used to derive the global parameters of our cluster samples each have their own merits and disadvantages, there
D
o
w
n
lo
a
d
e
d
fro
m
h
ttp
s:
//a
ca
d
e
mi
c.
o
u
p
.co
m/
mn
ra
s/
a
rt
icl
e
-a
b
st
ra
ct
/3
5
9
/3
/8
7
4
/9
8
0
1
7
2
b
y
U
n
ive
rsi
ty
o
f S
h
e
ffi
e
ld
u
se
r
o
n
1
1
A
p
ri
l 2
0
1
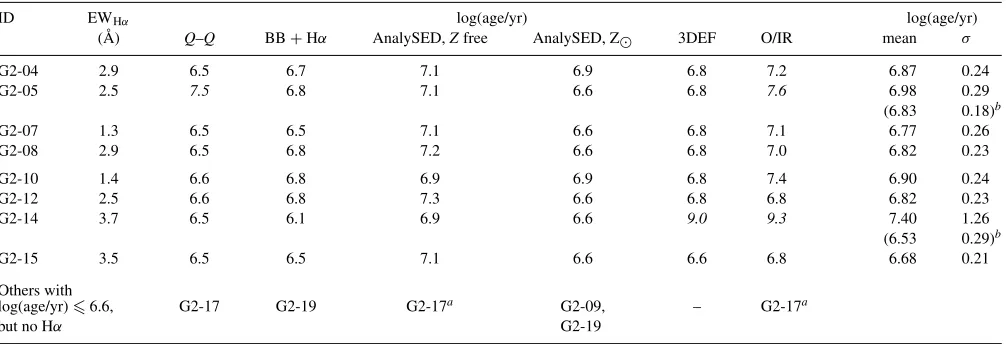
Table 2. Johnson–Cousins photometry and HαEWs of the NGC 4038/39 cluster sample. The broad-band photometry is in magnitudes; 1σ photomet-ric uncertainties are of the order of 0.08 mag for all passbands. The HαEWs are expressed in Å.
ID U B V I log(EWHα)
G2-01 21.944 21.779 21.550 21.098 . . .
G2-02 21.982 21.827 21.569 21.098 . . .
G2-03 23.118 23.075 22.602 21.694 . . .
G2-04 20.437 21.001 20.679 20.086 2.942 G2-05 21.786 21.870 21.212 19.995 2.481 G2-06 21.759 21.659 21.508 21.148 0.700 G2-07 18.467 19.145 19.010 18.634 1.328 G2-08 21.534 21.922 21.292 20.346 2.853 G2-09 21.388 21.412 20.800 20.041 . . .
G2-10 20.273 20.732 20.296 19.516 1.350 G2-11 23.861 23.707 22.769 21.540 . . .
G2-12 18.066 18.831 18.700 18.566 2.487 G2-13 24.436 24.271 23.316 22.181 . . .
G2-14 23.377 23.673 22.261 21.157 3.728 G2-15 18.557 19.428 19.064 18.919 3.497 G2-16 20.159 20.511 20.321 19.823 0.348 G2-17 19.420 19.966 19.656 18.928 . . .
G2-18 22.353 22.196 21.931 21.530 . . .
G2-19 23.285 23.332 22.544 21.511 . . .
G2-20 24.182 23.724 22.809 21.602 . . .
is significant overlap among both the extinction laws and the sim-ple stellar population (SSP) models used for the stellar synthesis modelling.
Therefore, we will first summarize the main characteristics of the SSP models and extinction laws used in this project. Subsequently, in Sections 3.3–3.7 each of the methods employed to obtain the basic cluster parameters are described in detail, roughly in order of increasing complexity and sophistication.
3.1 Extinction laws
In Sections 3.3–3.7 below, we will use a variety of Galactic extinc-tion laws, as published by Savage & Mathis (1979, Secextinc-tions 3.4 and 3.6), Rieke & Lebofsky (1985, Section 3.3) Voshchinnikov & Il’in (1987, Section 3.4) and Fitzpatrick (1999, Section 3.5), as well as the starburst galaxy extinction law of Calzetti et al. (1994, Section 3.7). In the left-hand panel of Fig. 1, we show these extinction laws in relation to each other over the wavelength range of interest for the
present study, normalized at an extinction of 1 mag in theVband
at 5500 Å,AV=1 mag. In the right-hand panel, we zoom in to
dis-play the differences among the individual extinction laws from 0.5
to 2.0µm. From a comparison of the individual extinction curves
in the right-hand panel, it is clear that the differences are generally
0.05 mag at wavelengths longward of 1µm and shortward of∼0.8
µm [with the exception of the Voshchinnikov & Il’in (1987)
extinc-tion law]. In the intermediate wavelength range, the differences are mainly driven by the Rieke & Lebofsky (1985) Galactic extinction law, on the one hand, and the Voshchinnikov & Il’in (1987) curve, on the other. Nevertheless, representative differences from the mean generally do not exceed 0.1 mag, even at these wavelengths, and are often significantly smaller.
[image:5.612.55.294.109.346.2]If we place these differences among the extinction laws in their proper context, i.e. in comparison with the observational data pre-sented in Section 2, we see that they are generally of the same order as or smaller than the observational uncertainties. In addition, as we
Figure 1. Comparison of the various extinction curves adopted; the right-hand panel is a zoomed-in version of the left-right-hand panel. Galactic extinction laws: solid lines, Savage & Mathis (1979); dotted lines, Rieke & Lebofsky (1985); short-dashed lines, Voshchinnikov & Il’in (1987); and long-dashed lines, Fitzpatrick (1999). Starburst galaxy extinction law: dot/long-dashed lines, Calzetti et al. (1994).
will see in Section 5, the vast majority of the sample clusters are
characterized byAV ≪1 mag, so that the differences among the
various extinction laws become negligible for our sample clusters, irrespective of the analysis approach adopted. This conclusion is further strengthened if we realize that the wavelengths crucial for a successful determination of, in particular, extinction values and metallicities are the bluest optical/UV and the redder NIR pass-bands (see e.g. de Grijs et al. 2003b; Anders et al. 2004b), where the differences among the individual extinction curves are smallest.
3.2 Simple stellar population models
All of the methods used in this study rely on a comparison of the observational broad-band SEDs with a grid of model SEDs, in the sense that the star clusters are assumed to represent ‘simple’ stellar populations, i.e. single-age, single-metallicity populations with a range of stellar masses determined by a given stellar IMF. The main differences among the various SSPs used for the comparison made in this paper are related to the use of different descriptions of the input physics, such as: (i) a variety of stellar tracks or isochrones, which may or may not include critical phases in stellar evolution, e.g. the red supergiant (RSG) phase, Wolf–Rayet stars, and the ther-mally pulsing asymptotic giant branch (TP-AGB) phase; (ii) slightly different IMF descriptions; and (iii) different (or no) treatment of nebular emission, particularly in the early phases of stellar evolution. Each of the approaches used in this paper is based on a com-parison with a specific set of stellar evolutionary synthesis models. We will employ: (i) the most commonly used set of models de-veloped by Bruzual & Charlot [Bruzual & Charlot (1993, 1996, hereafter BC96); Bruzual & Charlot (2000, hereafter BC00); and the recently updated Bruzual & Charlot (2003) SSPs]; (ii) the ‘Star-burst99’ models of Leitherer & Heckman (1995) and Leitherer et al. (1999), which are specifically matched to analyse the young stel-lar populations in starburst and interacting galaxies; and (iii) the
G¨ottingen SSP modelsGALEV(Kurth et al. 1999; Schulz et al. 2002;
Anders & Fritze-v. Alvensleben 2003).
3.2.1 The Bruzual and Charlot SSP models
The basic assumptions of the modern sets of the Bruzual & Charlot SSP models (used in Sections 3.3, 3.5 and 3.6) were first developed in Charlot & Bruzual (1991). The versions of the code used in this paper, BC96 and BC00, include a description of SSP evolution for
D
o
w
n
lo
a
d
e
d
fro
m
h
ttp
s:
//a
ca
d
e
mi
c.
o
u
p
.co
m/
mn
ra
s/
a
rt
icl
e
-a
b
st
ra
ct
/3
5
9
/3
/8
7
4
/9
8
0
1
7
2
b
y
U
n
ive
rsi
ty
o
f S
h
e
ffi
e
ld
u
se
r
o
n
1
1
A
p
ri
l 2
0
1
a range of metallicities fromZ=0.0004 to 0.10. The BC96 models and more recent versions are (mostly) based on the evolutionary tracks of the Padova group [Bressan et al. (1993) and Fagotto et al. (1994a,b,c), with additional empirical spectra for stellar masses
be-tween 0.1 and 0.7 M⊙(Charlot & Bruzual 1991)], and cover an age
range from 1.25×10⁵to 2×10¹⁰yr, typically computed using 220
unequally spaced age intervals. The important TP-AGB phase (see Section 3.2.3) is treated semi-empirically. These models cover all of the important phases of stellar evolution from the zero-age main sequence to the post-AGB phase and beyond, for stars with
effec-tive temperatures of 2000Teff/K50 000. The stellar spectra
are based on the theoretical spectral library compiled by Lejeune, Cuisinier & Buser (1997, 1998), which uses the theoretical stellar atmosphere calculations of Kurucz (1979), Fluks et al. (1994) and Bessell et al. (1989, 1991). Lejeune et al. (1997, 1998) have cor-rected the stellar continuum shapes from the Kurucz (1979) models
to agree with observed colours from the UV to theKband. SSPs,
covering the wavelength range from the extreme UV (5 Å) to the
far-infrared (100µm) with a resolution depending on the spectral
range, were calculated assuming a Salpeter (1955) type of IMF,
ξ(m)∝m−αwithα=2.35, and masses ranging from∼0.1 M
⊙up
to 125 M⊙.
3.2.2 The Starburst99 models
The Leitherer et al. (1999) Starburst99 models (used in Sections 3.4 and 3.6) constitute an improved and extended version of the suite of models initially published by Leitherer & Heckman (1995). These models were specifically developed for the evolutionary syn-thesis analysis of populations of massive stars, and are best suited to the conditions typically found in starburst environments. They are based on the Geneva stellar evolution models and the new model atmosphere grid compiled by Lejeune et al. (1997). The tracks of Meynet et al. (1994) were used for stars with masses in excess of
12–25 M⊙(depending on metallicity), with the enhanced mass-loss
prescription in order to better approximate most Wolf–Rayet prop-erties (except the Wolf–Rayet mass-loss rate itself) compared to the standard mass-loss scenario. For stars with masses in the range 0.8
m∗/M⊙12, they used the standard mass-loss tracks of Schaller
et al. (1992), Schaerer et al. (1993a,b) and Charbonnel et al. (1993). These tracks include the early AGB evolution until the first thermal
pulse for stars with massesm∗>1.7 M⊙. The Starburst99
mod-els also include observational high-resolution UV spectra, to allow for the analysis of stellar and interstellar absorption lines and line profiles at various metallicities.
The SSP models cover an age range between 106 and 109 yr,
with an age resolution of 0.1 Myr, for all five metallicities, Z =
0.001, 0.004, 0.008, 0.02 and 0.04 over the entire spectral range from the extreme UV to the infrared. Nebular continuum emission is included in the models in a simplified fashion; its contribution becomes important when hot stars providing ionizing photons (and thus line emission) are present (see Section 3.2.3).
The synthesized models that we use in Section 3.6 below were cal-culated using a standard Salpeter-type IMF, characterized by stellar
masses in the range 1m∗/M⊙100.
3.2.3 TheGALEVG¨ottingen SSP models
The GALEV SSPs (used in Sections 3.4, 3.6 and 3.7) are based
on the set of stellar evolutionary tracks (Kurth et al. 1999), and in later versions the isochrones (Schulz et al. 2002; Anders & Fritze-v. Alvensleben 2003), of the Padova group [with the most
recent versions using the updated (Bertelli et al. 1994, and unpub-lished) isochrones; the latter also include the TP-AGB phase] for the
metallicity range of 0.0001Z 0.05, tabulated as five discrete
metallicities (Z=0.0004, 0.004, 0.008, 0.02 and 0.05,
correspond-ing to [M/H]≈[Fe/H]= −1.7,−0.7,−0.4, 0.0 and+0.4,
respec-tively). For lower-mass stars (0.08m∗/M⊙0.5), which
con-tribute very little to the integrated light of young and intermediate-age SSPs governed by any standard, Salpeter-type IMF, the Padova models are supplemented with the Chabrier & Baraffe (1997) theo-retical calculations that include a new description of stellar interiors of low-mass objects and use non-grey atmosphere models.
TheGALEVmodels are furthermore once again based on the
the-oretical stellar libraries of Lejeune et al. (1997, 1998) for a broad
range of metallicities. For stars hotter thanTeff=50 000 K, pure
blackbody spectra are adopted, as for the Bruzual & Charlot mod-els. The full set of models spans the wavelength range from 90 Å to
160µm.
The Salpeter-type IMF assumed is characterized by a lower
cut-off mass of 0.15 M⊙; the upper mass cut-off ranges between 50
and 70 M⊙, and is determined by the mass coverage of the Padova
isochrones for a given metallicity.
Kurth et al. (1999) cover ages between 1×10⁷and 1.6×10¹⁰
yr, with an age resolution of 107, 108 and 109 yr, for ages108
yr, between 108and 109yr and109yr, respectively. Schulz et al.
(2002) and Anders & Fritze-v. Alvensleben (2003) extended the age
range down to 4×10⁶yr (and slightly reduced the upper age limit
to 14 Gyr), while improving the age resolution to 4 Myr for ages up to 2.35 Gyr, and 20 Myr for greater ages.
The Schulz et al. (2002) version includes important improve-ments with respect to the older versions; they use the newer Padova isochrones, which include the important stellar evolutionary
TP-AGB phase. At ages ranging from∼100 Myr to∼1 Gyr, TP-AGB
stars account for 25–40 per cent of the bolometric light and for
50–60 per cent of theK-band emission of SSPs (see Charlot 1996;
Schulz et al. 2002). Schulz et al. (2002) show that the effect of in-cluding the TP-AGB phase results in redder colours for SSPs with
ages between∼108and 109yr, with the strongest effect (up to1
mag) being seen in (V −K) for solar metallicity, and in (V − I)
forZ0.5 Z⊙. Shorter-wavelength colours and lower-metallicity
SSPs are less affected. Since most young to intermediate-age star
cluster systems observed inHSTpassbands equivalent to the
stan-dardVand Ifilters are in fact aged between about 100 Myr and
1 Gyr, and have often close-to-solar metallicities, inclusion of the TP-AGB phase in the models is obviously important.
Finally, Anders & Fritze-v. Alvensleben (2003) included gaseous continuum emission and an exhaustive set of nebular emission lines
to theGALEVsuite, assuming comparable metallicities for the star
cluster and the surrounding ionized gas. Nebular emission is shown to be an important contributor to broad-band fluxes during the first
few times 107yr of SSP evolution, the exact details depending on
the metallicity.
3.2.4 Model comparison
First, we present a basic comparison among the SSP models used in this paper. Kurth et al. (1999) and Schulz et al. (2002) concluded that, compared to the models of BC96 and Bruzual & Charlot (1993),
respectively, their sets ofGALEVmodels agree very well for solar
metallicity and a Salpeter IMF, for (B − V) colours, and from
the UV up to∼7000 Å, respectively. However, between 7000 and
12 000 Å, as well as in the NIRH- andK-band regime, the BC96
flux contribution is considerably lower than that of the Schulz et al.
D
o
w
n
lo
a
d
e
d
fro
m
h
ttp
s:
//a
ca
d
e
mi
c.
o
u
p
.co
m/
mn
ra
s/
a
rt
icl
e
-a
b
st
ra
ct
/3
5
9
/3
/8
7
4
/9
8
0
1
7
2
b
y
U
n
ive
rsi
ty
o
f S
h
e
ffi
e
ld
u
se
r
o
n
1
1
A
p
ri
l 2
0
1
(2002) spectrum at those wavelengths, which they attribute to the
different treatment of the TP-AGB evolutionary phase (withTeff∼
3000 K).
Anders & Fritze-v. Alvensleben (2003) compare the most
up-to-dateGALEVmodels that include nebular line and continuum emission
with the Starburst99 models. Despite the differences in the input physics and the different sets of stellar tracks and/or isochrones used by these teams, they conclude that the differences between the two sets of models are minor at short optical wavelengths, e.g. (B
−V) colours, during the first gigayear of evolution, and are mainly
due to the better time resolution of the Starburst99 models. Longer-wavelength comparisons show larger differences, due to the different input physics, and in particular a different treatment of RSGs and the TP-AGB phase.
In summary, it appears that over most of the optical wavelength range all of the commonly used SSP models are fairly similar, with minor differences depending on the detailed input physics and the treatment of the various evolutionary phases. At longer (NIR) and shorter (bluer) wavelengths, the differences become more signifi-cant, and will lead to systematic differences in the determination of the basic properties of SSPs, as we will see below.
Quantitatively, for a given set of input physics, varying parameters including the IMF slope, mass-loss and convection prescriptions,
one can justify differences of up to∼0.05 mag in (B−V) (e.g. Yi
2003). However, the difference between, for instance, the Padova and Geneva stellar evolutionary tracks when used by an otherwise
identical SSP code amounts to(B −V)∼0.05 mag, and even
more in(V−I) and(V−K) (e.g. Leitherer et al. 1996; Schulz
et al. 2002).
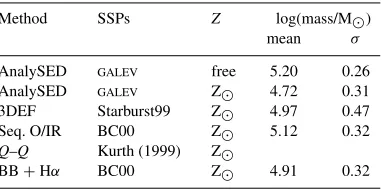
It is clear from the outset that the application of the various SSP models to our sets of sample clusters will result in significantly different masses and mass distributions, simply because of the dif-ferent low- and high-mass boundaries adopted for the Salpeter-type IMF. The mass ratios expected to result from the Starburst99 : the
Bruzual & Charlot : theGALEVSSPs are 1:22.4:33.1, or, in
loga-rithmic mass units, mass estimates based on the Bruzual & Charlot SSPs will result in masses that are 1.35 dex higher than those from
the Starburst99 models; theGALEVmasses will be 1.52 dex more
massive than the Starburst99 ones.
3.3 Method 1: optical/NIR sequential analysis (‘Sequential O/IR’)
The Sequential O/IR method is a two-step approach to derive the age, metallicity and extinction values associated with a given
clus-ter. First, the extinction is estimated using theBVIpassband
combi-nation; subsequently, the extinction-corrected, intrinsic colours are compared, in a least-squares sense, to the BC96 SSP models in order to estimate the cluster age.
While the (B − V) versus (V − I) colour–colour diagram is
affected by the well-known age–metallicity degeneracy, the age and extinction trajectories are not entirely degenerate for this particular
choice of optical colours. For SSPs older than∼100 Myr [i.e. (B−
V)00.18 mag], all age trajectories show the same, roughly linear
growth of the (V − I)0 versus (B −V)0 colours, irrespective of
their metallicity. As a consequence, for such ages, (B−V) versus
(V−I) SSP analysis enables us to derive the visual extinction (and
therefore the intrinsic colours and magnitudes), prior to any age and metallicity estimates (cf. de Grijs et al. 2001).
Using the intrinsic colours we can now derive the most repre-sentative age (and metallicity), by minimizing (in a least-squares sense)
0.5 1 1.5 2 2.5 3 3.5
0.2 0.4 0.6 0.8 1 1.2 1.4
(V
-J)
0
(V-I)0
AV = 1 mag
Z=5Zo Z=2.5Zo
Z=Zo Z=0.4Zo
Z=0.2Zo
Z=0.02Zo
Figure 2. The (V −I)0versus (V −J)0colour–colour diagram of the
BC96 SSPs. The thin curves represent isometallicity tracks; the thick curves connecting filled symbols represent isochrones (from left to right, log(t/yr)
=8.5, 9.0, 9.5 and 10.0, respectively). As an example, the thin boxes repre-sent the medians of typical 1σerror distributions for SSPs of solar metallicity at ages of 600 Myr and 10 Gyr. The arrow indicates the effects of reddening on these models, for a visual extinctionAV=1 mag. For the sake of clarity,
only SSPs older than 100 Myr are shown.
χmin2 (t,Z)=min
3
i=1
CIintr
i −CI
SSP
i (t,Z)
σCIi
2
, (1)
where CIintr
i and CI
SSP
i (t,Z) are the intrinsic and the model-predicted
colour indices in a given colour denoted byi, respectively, for SSPs
with agetand metallicityZ;σCIi are the 1σ uncertainties.
If NIR photometry is available, the cluster ageandmetallicity
can be derived simultaneously: for instance, the isochrones and
isometallicity tracks define a grid in (V −I) versus (V−J) space,
thus allowing one to lift the age–metallicity degeneracy, as shown in Fig. 2. Finally, cluster masses are obtained from their luminosities via the age- and metallicity-dependent mass-to-light ratio.
Our recent study of the intermediate-age star cluster population in region B of M82 provides a good example of what can be achieved
if both opticaland NIR data are available. In that case, both the
age–extinction and the age–metallicity degeneracies can be lifted. Further details, and a discussion about how photometric errors prop-agate into extinction, age, metallicity and mass uncertainties, are given in Parmentier, de Grijs & Gilmore (2003).
3.4 Method 2: reddening-freeQ-parameter analysis (‘Q–Q’)
The basicQ-parameter analysis is a powerful method to determine
SSP ages and extinction values independently. The internal
extinc-tion of the host galaxy to a given cluster is derived from theQUBV
parameter (Johnson & Morgan 1953),
QUBV =(U−B)0−[E(U−B)/E(B−V)]×(B−V)0
=(U−B)−0.72×(B−V). (2)
To estimate the internal reddening, we assess the loci of the clusters
in the (B−V) versusQUBV plane, compared to the intrinsic (B−
V)0colours of the Starburst99 andGALEVSSPs.
Subsequently, age estimates are obtained by minimizing the loci
of the clusters in the plane of the reddening-freeQUBV and QUBV
parameters, where the latter is defined as (Whitmore et al. 1999)
QUBVI =(U−B)0−[E(U−B)/E(V −I)]×(V−I)0
=(U−B)−0.58×(V −I), (3)
D
o
w
n
lo
a
d
e
d
fro
m
h
ttp
s:
//a
ca
d
e
mi
c.
o
u
p
.co
m/
mn
ra
s/
a
rt
icl
e
-a
b
st
ra
ct
/3
5
9
/3
/8
7
4
/9
8
0
1
7
2
b
y
U
n
ive
rsi
ty
o
f S
h
e
ffi
e
ld
u
se
r
o
n
1
1
A
p
ri
l 2
0
1
with respect to the Starburst99 models. Unfortunately, because of a
loop of the evolutionary tracks inQ–Qspace, one cannot achieve
accurate age estimates in the range of log(age/yr) from∼6.5 to 7.2
(see Whitmore et al. 1999). The availability of Hαobservations will
greatly facilitate our age estimates in this age range.
3.5 Method 3: Hαluminosities in addition to broad-band
fluxes (‘BB+Hα’)
For those clusters for which we have Hαflux or EW information
available, we compared the five observed magnitudes (UBVIHα) with the predicted SEDs from the BC00 SSPs at solar metallicity. For each available model age, we varied the reddening between
E(B−V)=0.0 and 3.0 in steps of 0.02, and assumed the Galactic
extinction curve of Fitzpatrick (1999). Each model–age/reddening
combination is scaled to match the clusterV-band magnitude, and
then compared with the observations using a standardχ2
minimiza-tion technique:
χmin2 (t,E(B−V))=min
λ
wλ
mmodelλ −m
obs
λ
2
, (4)
whereλ=U,B,V,I, Hαandwλ=[(0.05)2+σm2λ]
−1. Here,σ
mλ
is the photometric uncertainty (in magnitudes) for a given bandpass; we have included an additional uncertainty of 0.05 mag, which rep-resents the uncertainties in the models themselves [Section 3.2.4; see Fall, Chandar & Whitmore (2004) for validation of the method]. Since bright objects can have very small photometric uncertainties, this keeps the weights from ‘blowing up’ in the very bright object regime.
The predicted Hαmodel flux is calculated from the total number
of ionizing photons under the assumption of photon-limited case B recombination. When converting to magnitudes, we determined the zero-point offset between the models and observations
empiri-cally, by comparing the observed difference in (mHα−mV) for the
strongest Hαemitters with model predictions. We then applied the
empirically determined zero-point offset to the entire data set, and found that for clusters younger than 10 Myr, with measurable Hα emission, age estimates were in good agreement with those derived
by Whitmore & Zhang (2002). (The measured Hαfluxes for the
clusters were converted to theVEGAMAGsystem using the
prescrip-tion given in the WFPC2 Data Handbook.)
We note that, for those clusters without measurable HαEWs, we
applied the simplified method based on the broad-band luminosities only, but using otherwise the same procedure.
3.6 Method 4: three-dimensional SED analysis (‘3DEF’)
The next step up in complexity of the fitting algorithms used in-volves the fitting of the observed cluster SEDs to the Starburst99 and BC00 models using a three-dimensional (3D) maximum-likelihood method, 3DEF, with respect to a pre-computed grid of SSP models. This procedure was described in detail by Bik et al. (2003), based
on their analysis of archivalHST observations of the central star
clusters in M51, and applied successfully to the intermediate-age star cluster system in M82 B by de Grijs et al. (2003a) and to the extended cluster sample in M51 by Bastian et al. (2005). The
ini-tial cluster massMi, age and extinction E(B− V) were adopted
as free parameters. For those clusters with upper limits in one or more filters, but still leaving us with a minimum of three reliable photometric measurements, we use a two-dimensional maximum-likelihood fit (‘2DEF’), using the extinction probability distribution
forE(B−V). This distribution was derived for the clusters with
well-defined SEDs over the full wavelength range [see Bik et al. (2003) for a full overview of this procedure]. The derivation of the most representative set of models for a given cluster is done via a
least-squares (χ2) minimization technique, in which the observed
cluster SED is compared to the full grid of SSP models. In the ap-plication of the 3DEF method, Bik et al. (2003) and Bastian et al. (2005) assumed an uncertainty of 0.05 mag in the magnitudes of the cluster models (0.1 mag in the UV filters).
3.7 Method 5: multidimensional SED analysis (‘AnalySED’)
Finally, we have developed a sophisticated SED analysis tool that
can be applied to photometric measurements in a given numberN
(N4) of broad-band passbands (see de Grijs et al. 2003b; Anders
et al. 2004b). We apply a 3Dχ2minimization to the SEDs of our star
clusters with respect to theGALEVSSP models, to obtain the most
likely combination of aget, metallicityZ and internal extinction
E(B − V) for each object [see Anders et al. (2004b); Galactic
foreground extinction is taken from Schlegel, Finkbeiner & Davis (1998)].
In order to obtain useful results for all of our three free
parame-ters, i.e. age, metallicity and extinction,1we need a minimum SED
coverage of four passbands.
Each of the models is assigned a probability, determined by a
likelihood estimator of the formp∼exp(−χ2), where
χ2(t,Z,E(B−V),m
cl)=
models
(mobs−mmodel)2
σ2
obs
. (5)
Clusters with unusually large ‘best’χ2are rejected, since this is an
indication of calibration errors, features not included in the models (such as Wolf–Rayet star-dominated spectra, objects younger than 4 Myr, etc.) or problems due to the limited parameter resolutions. We include an additional 0.1 mag per passband for ‘model uncertainties’ (0.2 mag for UV filters; see Section 3.2.4).
Subsequently, the model with the highest probability is chosen as the ‘best-fitting model’. Models with decreasing probabilities are summed up until reaching 68.26 per cent total probability (i.e. the
1σ confidence interval) to estimate the uncertainties on the
best-fitting model parameters. For each of these best-best-fitting models, the product of the relative uncertainties, i.e.
age+
age− ×
mass+
mass− ×
Z+
Z−,
was calculated [the superscripts indicate the upper (+) and the lower (−) limits, respectively]. The relative uncertainty of the extinction was not taken into account, since the lower extinction limit is often zero. For each cluster, the data set with the lowest value of this product was adopted as the most representative set of parameters. In cases where the analysis converged to a single model, a generic uncertainty of 30 per cent was assumed for all parameters in linear
space, corresponding to an uncertainty of+−00..115dex in logarithmic
parameter space. [See also de Grijs et al. (2003a,b,c) and Anders et al. (2004a) for applications of this algorithm to NGC 3310 and
1Strictly speaking, the cluster mass is also a free parameter. Our model SEDs
are calculated for SSPs with initial masses of 1.6×10⁹M
⊙; to obtain the
actual cluster mass, we scale the model SED to match the observed cluster SED using a single scalefactor. This scalefactor is then converted into a cluster mass.
D
o
w
n
lo
a
d
e
d
fro
m
h
ttp
s:
//a
ca
d
e
mi
c.
o
u
p
.co
m/
mn
ra
s/
a
rt
icl
e
-a
b
st
ra
ct
/3
5
9
/3
/8
7
4
/9
8
0
1
7
2
b
y
U
n
ive
rsi
ty
o
f S
h
e
ffi
e
ld
u
se
r
o
n
1
1
A
p
ri
l 2
0
1
6745, and NGC 1569, respectively, and Anders et al. (2004b) for a theoretical analysis of its reliability.]
We caution that the multipassband combinations must not be biased to contain mainly short-wavelength nor mainly long-wavelength filters. Coverage of the entire optical long-wavelength range,
if possible with the addition of UVandNIR data, is most preferable
(de Grijs et al. 2003b; Anders et al. 2004b).
Finally, we emphasize once again that we will use this AnalySED method as the basis for our comparisons among the dif-ferent approaches employed in this paper. This decision is based on the fact that the method was validated and tested extensively, both empirically (de Grijs et al. 2003b,c) and theoretically (Anders et al. 2004b), so that we understand the systematic uncertainties in-herent to this approach in depth. In the following section, we will summarize the results from our extensive validation of the Anal-ySED method, in order to justify its use as our benchmark approach for comparison with the other methods described in the previous sections in the remainder of this paper.
4 E S TA B L I S H I N G O U R B E N C H M A R K A P P R OAC H W I T H A RT I F I C I A L D ATA
In Anders et al. (2004b) we presented a detailed study of the relia-bility and limitations of our AnalySED approach. We computed a
large grid of broad-bandHST-based star cluster SEDs on the basis of
ourGALEVmodels for SSPs, including all relevant up-to-date input
physics for stellar ages4 Myr. We constructed numerous artificial
cluster SEDs, and varied each of the input parameters (specifically, age, metallicity and internal extinction; see Section 3.7) in turn to assess their effects on the robustness of our parameter recovery. For each clean model artificial cluster SED we calculated 10 000 addi-tional clusters, with errors distributed around the input magnitudes in a Gaussian fashion.
By analysing artificial clusters, using a variety of input parameters with our AnalySED approach, we found in general good agreement
between the recovered and the input parameters for ages109yr,
i.e. exactly the age range of interest for the clusters in NGC 3310 and the Antennae galaxies analysed in this paper.
We considered several a priori restrictions of the full parameter space, both to the (correct) input values and to some commonly as-sumed values. We easily recover all remaining input values correctly if one of them is restricted a priori to its correct input value; this also provides a sanity check for the reliability of our code. We conclude that the age–metallicity degeneracy is responsible for some
misin-terpretations of clusters younger than∼200 Myr. If we restrict one
or more of our input parameters a priori to incorrect values (such as by using, for example, only solar metallicity, as often done in the literature), large uncertainties result in the remaining parameters.
In order to provide a robust theoretical benchmark for the obser-vational study of systematic uncertainties presented in the remainder of this paper, here we revalidate our AnalySED approach using the exact filter combinations available for our NGC 3310 and Antennae cluster samples (Tables 1 and 2), i.e. by computing a large grid of broad-band star cluster SEDs in a similar fashion as done in An-ders et al. (2004b) – although using only 1000 additional artificial clusters to quantify our model uncertainties; the difference between this approach and the 10 000 additional artificial clusters used in Anders et al. (2004b) is negligible, however. Our artificial cluster SEDs were computed for ages of 8, 60 and 200 Myr and 1 Gyr (the age range covered by our sample clusters; see Sections 5.1 and 5.2),
and for a fixed (internal) extinction ofE(B−V)=0.10 mag and
solar metallicity. The extinction value adopted roughly corresponds
to the mean extinction derived for the individual clusters (Sections 5.1 and 5.2); extinction variations among the sample clusters are small, and their effects (for the derived range of extinction values) on the age and mass estimates are negligible (de Grijs et al. 2003c; Anders et al. 2004b). The adopted solar metallicity also corresponds roughly to the mean metallicity derived for the sample clusters, al-though it may not be correct in individual cases. In order to quantify the effects of metallicity variations, we attempted to retrieve the ages and masses of our artificial clusters by assuming both the
cor-rect (solar) and incorcor-rect (Z =0.008=0.4 Z⊙) metallicities as a
priori restrictions. In addition, we retrieved the ages and masses of the artificial clusters without any restriction to the resulting
metal-licity (‘Zfree’). The latter provides a quantitative indication of the
importance of the age–metallicity degeneracy.
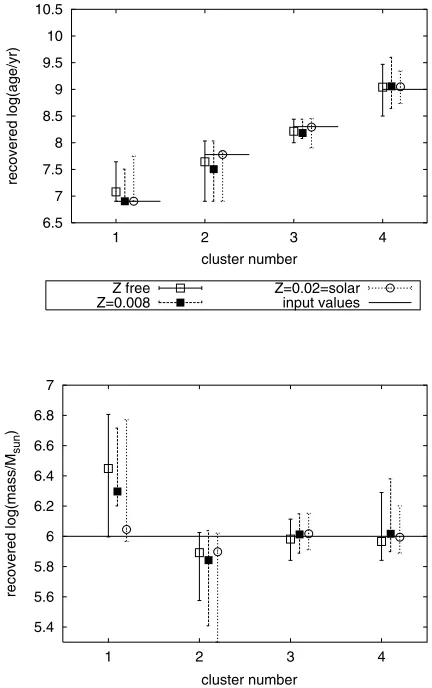
The results of this revalidation are shown in Figs 3 and 4 for filter coverage as for NGC 3310 and the Antennae galaxies, respectively. It is immediately clear that the accuracy of the parameter retrieval is significantly better for the NGC 3310 clusters than for those in the Antennae galaxies, which simply reflects the available filter sets (cf. de Grijs et al. 2003b,c; Anders et al. 2004b). Nevertheless, in all
cases theagesare retrieved well within the modelling uncertainties,
for any assumption on the metallicity of the clusters. For the cover-age corresponding to the NGC 3310 clusters, the difference between
6.5 7 7.5 8 8.5 9 9.5 10 10.5
1 2 3 4
recovered log(age/yr)
cluster number
cluster number Z free
Z=0.008
Z=0.02=solar input values
5.4 5.6 5.8 6 6.2 6.4 6.6 6.8 7
1 2 3 4
recovered log(mass/M
sun
[image:9.612.331.547.330.674.2])
Figure 3. Accuracy of the retrieval of the ages and masses of artificial star clusters based on a wavelength coverage as available for our NGC 3310 cluster sample. The artificial clusters are characterized byE(B−V)=0.1 mag,Z=Z⊙, and ages of 8, 60 and 200 Myr, and 1 Gyr (objects 1–4). The different symbols represent the retrieved values based on a variety of a priori assumptions on the metallicities of the clusters.
D
o
w
n
lo
a
d
e
d
fro
m
h
ttp
s:
//a
ca
d
e
mi
c.
o
u
p
.co
m/
mn
ra
s/
a
rt
icl
e
-a
b
st
ra
ct
/3
5
9
/3
/8
7
4
/9
8
0
1
7
2
b
y
U
n
ive
rsi
ty
o
f S
h
e
ffi
e
ld
u
se
r
o
n
1
1
A
p
ri
l 2
0
1
6.5 7 7.5 8 8.5 9 9.5 10 10.5
1 2 3 4
recovered log(age/yr)
cluster number
Z free Z=0.008
Z=0.02=solar input values
5.4 5.6 5.8 6 6.2 6.4 6.6 6.8 7
1 2 3 4
recovered log(mass/M
sun
)
[image:10.612.316.556.63.179.2]cluster number
Figure 4. Accuracy of the retrieval of the ages and masses of artificial star clusters based on a wavelength coverage as available for our Antennae cluster sample; technical details are as in Fig. 3.
input and retrieved ages islog(age/yr)0.3, and in the majority
of caseslog(age/yr)0.15. Except for the 60-Myr-old cluster,
log(age/yr)0.3 also for those clusters covered by the same
passbands as the Antennae clusters (although the age–metallicity degeneracy is somewhat more important for the 1-Gyr-old cluster in this case). The corresponding uncertainty in the retrieved age of the 60-Myr-old artificial cluster is about twice as large as for the other clusters; its cause is unclear, since the retrieved extinction and metallicity values for this object are not significantly more uncertain than for the other objects.
A similar behaviour, i.e. with slightly larger uncertainties for the Antennae-equivalent wavelength coverage compared to the
cover-age of the NGC 3310 sample, is seen for the retrievedmassesof
the artificial clusters, although to a lesser extent. The mass
uncer-tainties for all clusters older than 60 Myr arelog(Mcl/M⊙)
0.10–0.15. For the youngest, 8-Myr-old object, we are only able to retrieve the masses to within several 0.1 dex in mass (somewhat more accurately for the NGC 3310-equivalent wavelength coverage, particularly if the adopted metallicity is close to the actual value); this is most likely caused by the uncertainties inherent to our present knowledge of stellar evolution in this age range (such as, for exam-ple, the importance of the RSG phase), and the relatively coarse age resolution compared to the rapidity of changes in stellar evolution around 6–12 Myr.
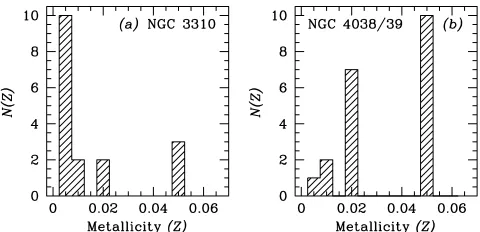
Figure 5. Metallicity estimates of the NGC 3310 and Antennae sample clusters, based on the results obtained from the AnalySED multidimensional approach. Note that these are first-order estimates [yielding an internally consistent overall metallicity distribution (see Anders et al. 2004b)], and that the uncertainties in the individual cluster metallicities are of the order of one step in our metallicity grid, covering metallicities of 0.004, 0.2, 0.4, 1 (Z=0.02), and 2.5 times Z⊙.
Thus we have shown, based on well-understood artificial data, that
we understandquantitativelythe uncertainties inherent to using our
AnalySED approach for age and mass determinations of star clusters based on broad-band imaging. We will be using this approach as our benchmark for comparing our results to those obtained using alternative methods commonly in use in the community.
In Section 3.2.4 we concluded that the differences among the var-ious prescriptions used for the input physics in modern sets of SSP models are very small indeed and apparently not biased systemati-cally. As a consequence of the analysis performed in this section, we conclude then that any differences in the individual (as well as in the mean) cluster ages and masses that we will find in subsequent sec-tions (over and above the modelling uncertainties quantified here) are most likely caused by intrinsic differences among the various methods.
5 C O M PA R I S O N O F T H E R E L AT I V E AG E A N D M A S S D I S T R I B U T I O N S
5.1 Extensive wavelength coverage: NGC 3310
To start our comparison of methods, we will focus on the exten-sive wavelength coverage of the NGC 3310 star cluster system.
With coverage from the F300WHSTmid-UV passband to the NIR
F205W passband, the resulting broad-band SEDs were shown to have sufficient leverage to distinguish metallicity, extinction and stellar population (age) effects (de Grijs et al. 2003b).
While a wavelength coverage as extensive as possible is
pre-ferred, the use ofHST flight system magnitudes (cf. Section 2)
limits the application of the NGC 3310 comparison to the use of the
GALEVSSP models (see Section 3.2.3), which we folded through
theHST/WFPC2 filter curves ourselves (e.g. de Grijs et al. 2003b;
Bastian et al. 2005).
We emphasize, however, that we prefer to use the originalHST
flight filter system, rather than conversions to ‘standard’ systems; in Section 7 we will discuss the systematic effects unavoidably
intro-duced when convertingHSTflight system magnitudes to the
‘stan-dard’ Johnson–Cousins system.
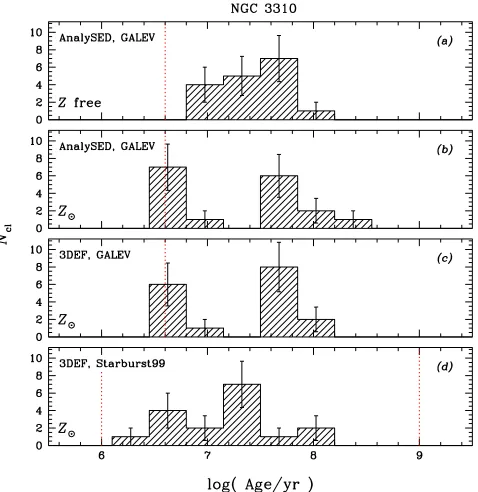
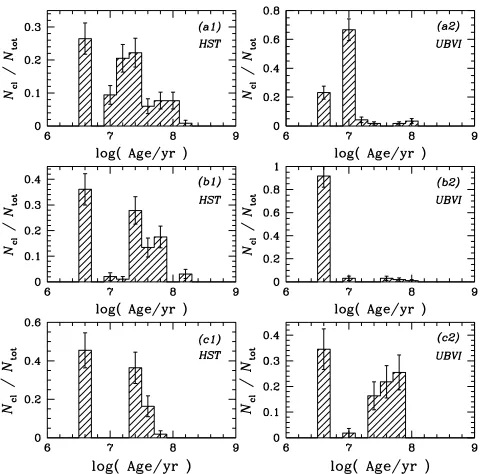
Fig. 5(a) shows the distribution of metallicities for the NGC 3310 clusters; Fig. 6 shows the resulting age distributions for the 17 star clusters of NGC 3310 used for this exercise, obtained using a variety of approaches. In Fig. 6(a), we display the relative age distribution
D
o
w
n
lo
a
d
e
d
fro
m
h
ttp
s:
//a
ca
d
e
mi
c.
o
u
p
.co
m/
mn
ra
s/
a
rt
icl
e
-a
b
st
ra
ct
/3
5
9
/3
/8
7
4
/9
8
0
1
7
2
b
y
U
n
ive
rsi
ty
o
f S
h
e
ffi
e
ld
u
se
r
o
n
1
1
A
p
ri
l 2
0
1
[image:10.612.64.284.65.411.2]